An expressway traffic incident detection method based on
Convolutional Neural Network and Extreme Gradient Boosting
Qingfang Yang
1,2,Yunfeng Fang
1,2,Lili Zheng
1,2,Xiangyu
Zhou
1,2,Bo Peng
1,21.Department of Traffic Information and Control Engineering,Jinlin University
2.Jilin Engineering Research Center for ITS,Changchun 130022,China Correspondence should be addressed to Yunfeng Fang;[email protected]
Abstract:Accurate and efficient traffic incident detection methods can effectively alleviate traffic congestion caused by traffic incidents, prevent secondary accidents and improve the safety of urban road traffic.Aiming at the problems that the traditional machine learning event detection method cannot fully extract the parameter characteristics of traffic flow and is not suitable formulti-dimensional and non-linear massive data, we propose a new traffic event detection method(CNN-XGBoost).This method combines the respective advantages of Convolution Neural Network(CNN) and Extreme Gradation Boosting (XGBoost). Firstly, we preprocessed the original freeway traffic incident detection data set by constructing initial variable set, data normalization, data balance processing and dimension reorganization. Secondly,we use CNN network to automatically extract the deep features of event detection data, and use XGBoost as a classifier to classify the extracted features for expressway traffic event detection.Finally, we use the data set of Hangzhou expressway microwave detector in China to carry out simulation experiments on CNN-XGBoost. The experimental results show that compared with XGBoost,CNN, Support Vector Machine (SVM) and Gradient Boosting
Decision Tree (GBDT) and other methods , CNN-XGBoost method can effectively improve the accuracy of expressway traffic event detection and has better generalization ability.
Key words: Traffic Engineering: Traffic Incident Detection; CNN-XGBoost;Convolution Neural Network;Deep Learning.
1. Introduction
Urban expressway plays the role of skeleton road network in the urban road system and bears huge traffic demand.Traffic incidents have a particularly serious impact on background traffic.
US Federal Highway Administration (FHWA),2005 statistics show that 70% of traffic congestion on urban expressways is caused by accidents, and the losses caused by accidents in US cities exceed 35 billion US dollars [1] per year.In recent years, the number of traffic accidents (including minor accidents) in Beijing has reached about 100,000 each year, with direct economic losses of about 140 million yuan and indirect losses incalculable.Traffic accidents not only threaten the safety of people's lives and property, but also make congested roads more congested [2].There are about 3000 traffic jams caused by traffic accidents in Beijing every year.It can be seen that traffic congestion caused by traffic accidents occupies a high proportion in the urban traffic system. How to quickly find traffic accidents, determine the incident level and make quick response, improve the efficiency of traffic incident handling and minimize the interference on urban traffic is an important way to urban traffic management and alleviate urban traffic congestion.
Based on the above reasons, automatic traffic incident detection technology has been widely studied. Among them, automatic traffic event detection algorithm based on traffic flow parameters is most commonly used. This kind of automatic traffic event detection method is suitable for roads with continuous traffic flow, and there is no more general automatic traffic event detection algorithm for roads with discontinuous traffic flow [3].Existing automatic traffic event detection algorithms based on traffic flow parameters mostly rely on manual experience to select sample features, and most of them are of shallow structure, with complex models and limited representation capability. The selection results of sample features affect the detection results of the model, and the detection efficiency and accuracy are low under the background of high-dimensional and massive traffic data.In this paper, we propose a combined traffic event detection method (CNN-XGBoost) based on convolution neural network (CNN) and extreme graduation boosting (XGBoost). It uses the features of convolution neural network such as automatic feature extraction and feature selection to effectively extract the features of traffic flow parameters, abstract the essential features of traffic flow parameters, and input them into XG Boost model as input vectors for traffic event detection, avoiding manual selection of sample features and ensuring the accuracy of event detection of the model.The organizational structure of this paper is as follows: Section 2 discusses the related work; Section 3 introduces the combined method of convolutional nerve and XGBoost.Section 4: Experimental Analysis, Data Preprocessing, Parameter Configuration, Method Validation and Comparative Analysis; Section 5: Research Conclusions.
2. Related works
Up to now, many effective models and methods have been applied to the research of automatic traffic incident detection. Early developed traffic incident detection algorithms include California algorithm [4], McMaste algorithm based on catastrophe theory [5], low-pass filtering algorithm [6], etc.The principle of early event detection algorithm is relatively simple. Although it is practical, the detection effect is difficult to meet the requirements. With the in-depth study of traffic flow characteristics and the development of new artificial intelligence technologies, many advanced algorithms such as Bayesian method [7], wavelet theory [8], fuzzy logic method [9], neural network model [10-11], support vector machine model [12-13] and so on appeared in the 1990s.
regarded as a two-class (event and non-event) problem. Through learning traffic flow parameter data upstream and downstream of events, automatically generating detection rules and mining hidden information of data ,it has achieved certain application effects.However, the existing research mainly focuses on the integration and optimization of model methods, which need to rely on manual experience to select sample features and screen input variables. It cannot fully extract the parameter features of traffic flow, and most of them are of shallow structure and have limited representation ability. When facing high-dimensional, nonlinear and massive real traffic data, its event detection effect is unstable.In recent years, Deep learning has achieved success in the field of transportation due to its strong feature extraction ability. Convolution neural network is the research focus of deep learning pattern recognition. Some scholars have applied convolution neural network to traffic parameter feature extraction.Wu et al [14] used one-dimensional convolution neural network to mine the spatial characteristics of traffic flow, and combined with two long-term and short-term memory models to mine the short-term periodic characteristics of traffic flow. Although the method takes spatial characteristics into account, it uses one-dimensional convolution neural network, so the mining ability of spatial characteristics is limited.Wang[15] et al. proposed a convolution neural network model with error feedback to predict traffic flow. CNN is based on the concepts of local receptive field and weight sharing. It requires fewer parameters, reduces the complexity of the model, and can better extract the characteristics of traffic data. However, CNN is not a good classifier and is inefficient in the face of massive data.
XGBoost, also known as extreme gradient boosting, is based on GBDT improvement and is an integrated algorithm formed by combining basis functions and weights through Boosting thought. Xgboost algorithm has the advantages of fast, high efficiency and strong generalization ability, and is widely used in regression and classification fields.Sun Chen, Tian Xiaosheng and others [16] collected a large amount of data generated by oil chromatography on-line monitoring system, and tried to use XGBoos method for transformer fault diagnosis and discrimination. Compared with the performance of several common machine learning algorithms for transformer fault diagnosis, the results show that the XGBoost feature extraction method combined with a simple classifier can achieve very good results.Zhang Yu, Chen Jun, Wang Xiaofeng, Liu Fei and others [17] proposed an Xgboost bearing fault diagnosis algorithm based on classification and regression tree, which was verified by the bearing vibration data of SQI-MFS experimental platform. Compared with the diagnosis results of traditional classifiers (support vector machine, proximity algorithm and artificial neural network) and single classification regression tree, the results show that Xgboost is superior to traditional classification algorithm in bearing fault diagnosis rate, and the calculation time is shorter than traditional lifting decision tree algorithm.
3.Methodology
3.1 Convolution Neural Network
CNN is a kind of feedforward neural network with convolution calculation and depth structure. It has achieved good results in image tasks. Through local connection, weight sharing and downsampling, it has solved the problem of too many parameters in fully connected neural networks. Usually, a deep learning network is constructed by stacking and combining convolution layers and sampling layers. Deep features in sample data are automatically learned layer by layer. Therefore, the learned features have layer characteristics and have stronger mapping ability and generalization ability.Convolution is the most basic and important operation of neural network. Convolution layer is composed of the output of convolution operation and is also called feature extraction layer. Convolution usually traverses the feature map of the previous layer by convolution check to determine the size and quantity. The traversal result plus offset and then through activation function, a new feature map is obtained. The feature maps generated by all convolution kernels are stacked to form the feature map of this layer.The setting of convolution kernel has great influence on the performance of CNN. For Layer
l
(convolution layer), the output ofj
convolution kernel is
j n i M x l j l ij l i lj
f
x
k
b
x
1
1 (1)
In formula (1):
M
jrepresents the input data set, andf
is a non-linear function such as Sigmoid function, RILL function, Softplu function, etc. lij
k
is the convolution kernel of the1
l
data of the layer and thej
data of the layer; l jb
is offset.The convolution layer is usually followed by a sampling layer. The essence of the sampling layer is to statistically calculate the convolution results. While reducing the dimension of the features, it can also retain the local optimal features. Common sampling methods include average sampling and maximum sampling, and the corresponding sampling method is selected to sample the characteristic map of convolution layer. Its general form is
l
j l j l j l
j
f
DO
x
b
x
1
(2)In formula (2):
D()(·)
is a sampling function, and there are many different sampling function schemes such as random sampling, average finding, maximum value, etc. lj
is the weight;l j
b
is offset.3.2 Extreme Gradient Boosting
data. Secondly, regularization is added to the objective function to reduce the complexity of the model. Compared with the traditional gradient tree, the model has better trade-off deviation and variance. Different from the voting mechanism of random forest, it is similar to GBDT to add a new decision tree and use residuals to fit the final value through multiple iterations, which usually uses fewer decision trees to obtain higher accuracy.
For dataset
D
x
i,
y
i
D
n
,
x
i
R
m,
y
i
R
, the predicted values for K trees are:
x
f
F
f
y
i kK
k k
i
,
ˆ
1
(3)
In formula (3): f is the set of decision trees, i.e. adding a new decision tree function to the last round of predicted values to minimize the residual error with the real value. In the XGboost model, regularization is added to the loss function to obtain the final objective function:
k k k ni i i
t
l
y
y
f
L
1 1
ˆ
,
(4)In equation (4):
l
is a differential loss function representing the difference between the predicted valuey
ˆ
i and the true valuey
i , and common loss functions include logarithmic loss function, square loss function and exponential loss function.
is the added regularization, which is the penalty term of decision treef
k and can avoid over-fitting. The expression of
is shown in the formula:
22
1
w
T
f
k
(5)In formula (5):
is the complexity parameter in the regular term, andT
is the number of leaf nodes.
is the penalty coefficient of leaf weightw
, which is generally constant [16]. The values of
and
determine the complexity of the model and are usually given based on experienceThe goal of XGboost is to find the one that minimizes the objective function. In GBDT, only one step statistics is used to optimize the objective function. XGboost rewrites the original objective function while Taylor expansion is performed:
t i t ni i t i i t i
t i
t
i t
n
i t i
t i t
f
x
f
h
x
f
g
y
y
l
f
x
f
y
y
l
L
i i 1 1 2 1 1 1 12
1
ˆ
,
ˆ
,
(6)
In formula (6),
g
i andh
i are the first derivative and the second derivative of the loss functionˆ
t-1i
ti t
n
i i t i i t i
t
l
g
f
x
h
f
x
f
L
1 1
2
2
1
~
(7)3.3 Network structure of CNN-XGBost model
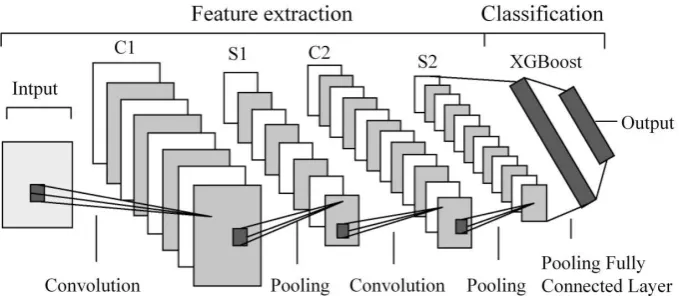
CNN network mainly extracts object features through a plurality of stacked convolution layers and sampling layers, so CNN network can extract better classification features. However, the CNN network uses the fully connected BP neural network as the perceptron, and the gradient descent method is used to find the network to minimize the global error during network training. Therefore, the training takes a long time and the generalization ability of the network is poor. Therefore, the CNN perceptron is not a very good classifier. XGBoost model is a combination of a series of classification regression trees. Its advantages are not easy over-fitting, fast training speed and strong interpretability. Combining the advantages of the two, CNN-XGBoost model is proposed. CNN model is used to automatically extract features of different levels, and then the obtained feature vectors are used as input to XGBoost model for event detection. Fig. 1 shows the structure of CNN-XGBoost network, in which CNN network consists of two convolution layers (C1,C2) and two sampling layers (S1, S2), and xgbost classifier is the final output layer. The whole network consists of two parts. Firstly, the CNN model is used to extract the features. Then the XGBoost model receives the features and classifies them as shown in the figure.
Fig. 1 structure of CNN- XGBoost model
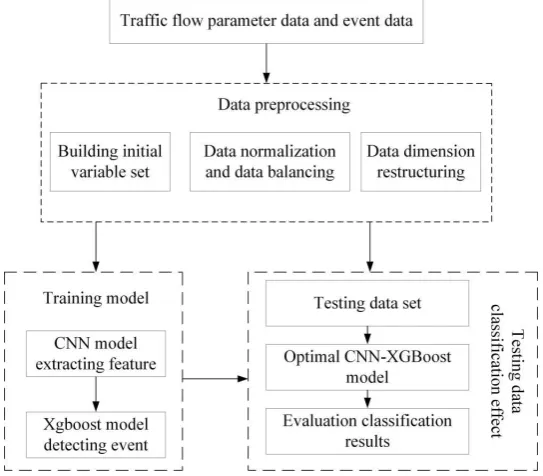
3.3 Training process of CNN-XGBoost hybrid model
optimization algorithm is used in training process, and square loss function is used in XGBoost model. The training process of the model is shown in fig. 2.
Fig .2 Event Detection Framework Based on CNN-XGBoost
4. Experiment and analysis
The operating system of the experimental environment is Windows10, 64 bits, the CPU is Intel core i7-77003.60GHZ, the memory is 16GBDDR, and the software used is Anaconda 3, 64 bits, TensorFlow version 1.1.0.
4. 1 Experimental Data Set and Data Preprocessing
Table 1 Situation of Model Training Set and Test Set Dataset category Total number
of samples
Number of events
Number of event samples
Number of non event samples
Proportion of event samples to total samples Training set 53271 95 10654 42617 20%
Test set 52747 94 10550 42197 20%
Total 106018 189 21204 84814 20%
In order to be more suitable for detection experiments, it is necessary to construct initial variable sets, preprocess the data sets, normalize the data and balance the data sets, and reconstruct the normalized feature dimensions into a 2-dimensional matrix format. The specific pretreatment process is as follows:
1) constructing an initial variable set
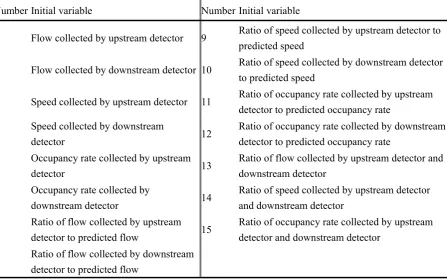
Under normal conditions, the changes of traffic flow parameters (flow rate, speed and occupancy rate) are relatively stable. When a traffic incident occurs, the upstream flow rate and speed at the incident site decrease rapidly and the occupancy rate increases rapidly. Subsequently, the downstream traffic flow and occupancy rate decrease and the speed increases. After the traffic incident ends, the traffic flow parameters return to a relatively stable state. The traffic flow parameters in normal state can be used as the benchmark for incident detection, so it is necessary to predict the traffic flow parameters in normal state, such as SND algorithm [4]. In addition, the combination of traffic flow parameters in upstream and downstream of the incident site has obvious changes. For example, California algorithm uses the difference between the upstream and downstream occupancy rates [5].In this paper, measured values, predicted values and combinations of above and downstream traffic flow parameters are used to construct a more comprehensive initial variable set as shown in Table 2.
Table 2 Initial variables set of traffic incident detection Number Initial variable Number Initial variable
1 Flow collected by upstream detector 9 Ratio of speed collected by upstream detector topredicted speed
2 Flow collected by downstream detector 10 Ratio of speed collected by downstream detectorto predicted speed
3 Speed collected by upstream detector 11 Ratio of occupancy rate collected by upstreamdetector to predicted occupancy rate
4 Speed collected by downstreamdetector 12 Ratio of occupancy rate collected by downstreamdetector to predicted occupancy rate 5 Occupancy rate collected by upstream
detector 13
Ratio of flow collected by upstream detector and downstream detector
6 Occupancy rate collected by
downstream detector 14
Ratio of speed collected by upstream detector and downstream detector
7 Ratio of flow collected by upstream detector to predicted flow 15
Ratio of occupancy rate collected by upstream detector and downstream detector
The initial variable set is divided into three parts: the first part is the basic traffic parameters obtained by the detector;The second part is the combination of traffic parameters of the same detector.The third part is the combination of traffic parameters of adjacent upstream and downstream detectors.The predicted values of traffic parameters are obtained by using a moving average model, and the fifth data is predicted by using the adjacent previous data.
2) data normalization and balance processing
In order to improve the training speed and classification effect of the algorithm and eliminate the influence between different dimensions, the data obtained in the previous step are normalized. Normalize the data to [0,1] range according to formula (8)
min max
min
x
x
x
x
x
ii
(8)In formula (8) ,
x
i is the data obtained in the previous step,x
maxis the maximum value in thedata obtained in the previous step,
x
minis the minimum value in the data obtained in the previous step, andx
i
is the normalized data,x
i
0
,
1
.In practice, the number of traffic event samples is far less than that of non-event samples, and the number of two types of samples is unbalanced. Therefore, traffic incident detection can be regarded as a two-class problem of unbalanced data. In order to balance the two types of samples in the training set, this paper uses over-sampling technique (SMOTE) to increase traffic event samples [18]. The specific implementation steps of SMOTE algorithm are as follows:
Step1. For each sample
x
i in the event sample set, the Euclidean distance is taken as a measurement standard, and the K samples closest to the sample in the event sample set are searched;Step2. Determine the sampling rate N according to the ratio of the number of non-event samples and the number of event samples, and randomly select N samples from the K nearest neighbor samples of each event sample
x
i, and recordx
ij;Step3. Random linear interpolation between randomly selected nearest neighbor sample
x
ijandevent sample
x
ito construct a new event sample:
ij i
i
new
x
rand
x
x
x
0
1,
(9)In formula (9): rand (0 ,1) represents a random number belonging to interval [0,1].
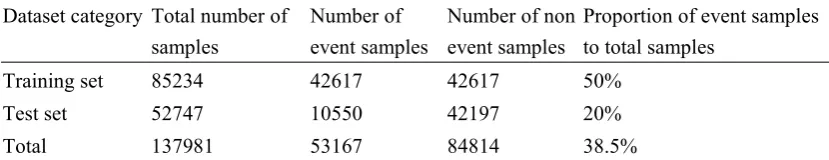
Table 3 Sample Composition after SMOTE Balanced Training Set
3) Data Dimension Reorganization
Because the convolution neural network requires the input data to be in a two-dimensional matrix format, the normalized n-dimensional feature dimensions need to be reorganized into a
M
K
matrix. During dimension reorganization, it is possible that the characteristic dimension is inconsistent with the number of matrix elements, such as the characteristic dimension is greater than the number of matrix elements (N
>K
M
;) or the characteristic dimension is less than the number of matrix elements (N
<K
M
). there are two methods to deal with this problem. One method is to reduce the degree of feature dimension, such as document [17] rejecting features that do not work in classification; the other method is to increase the degree of feature dimension, such as document [18] performing corresponding zero filling operation at the end of the matrix. In this experiment, the second method is used to increase the degree of feature dimension, select 16-dimensional features, and reconstruct their dimensions into a matrix vector as shown in formula (10).
44 43 42 1 4 34 33 32 31 24 23 22 1 2 14 13 12 11 tion Reorganiza Dimension 16 2 1a
a
a
a
a
a
a
a
a
a
a
a
a
a
a
a
a
a
a
(10)4.2 Evaluation Methods
The evaluation indexes of the performance of the common event automatic detection algorithm include traffic event detection rate (DR), false alarm rate (FAR) and average detection time (MTTD), and the three evaluation indexes are calculated as shown in formula (11) to (13):
%
100
RN
TN
DR
(11)In formula (11): TN represents the number of successful detection events; RN represents the actual number of events.
%
100
AN
FN
FAR
(12)In formula (12): FN represents the number of false positives in a specific period of time, AN represents the total number of events detected in a specific period of time.
n ii
t
i
t
n
MTTD
1 01
(13)In formula (13),
t
i
represents the time when the event is detected and an alarm is issued, Dataset category Total number ofsamples
Number of event samples
Number of non event samples
Proportion of event samples to total samples
Training set 85234 42617 42617 50%
Test set 52747 10550 42197 20%
i
t
0 represents the time when the event occurs, and n represents the number of events detectedwithin a certain period of time.
In addition, the classification accuracy rate (CR) is also commonly used as an evaluation index for automatic detection algorithms, which refers to the percentage of correctly classified samples to all samples. For event detection classifiers, more attention is paid to the occurrence of events (positive examples). Area Under Curve(AUC) is also commonly used as its evaluation method. AUC is understood as the lower area of the curve with false alarm rate as the horizontal axis and detection rate as the vertical axis. The larger the area, the better the effect of the event detection algorithm. Performance index (PI) is also used as an evaluation index of event detection algorithm, which includes DR, FAR, MTTD and CR, and is a comprehensive evaluation index. The calculation formula is as follows:
CR
THD
MTTD
FAR
DR
PI
MTTD
11
2
3
41
(14)In formula (14),
1、
2、
3 and
4 are respectively expressed as the weights of DR,FAR, MTTD and CR,
3
1
3 2
1
,
4
0
,THD
MTTD is the threshold of MTTD index,and is generally taken as 10[3].
In this paper, DR, FAR, MTTD, CR, AUC and PI are used as evaluation indexes of event algorithm.
4. 3 parameter setting
When CNN-XGBoost algorithm is used to detect events, it involves setting a large number of parameters. Different combinations of parameters have great influence on the classification accuracy of the model. Unreasonable parameter setting is easy to cause under-fitting or over-fitting of the model. Therefore, in order to find the best parameters before model training, it is often necessary to adjust parameters.
The parameters of CNN-XGBoost algorithm are mostly empirical data. The convolution layer of CNN network includes C1 and C2, and the sampling layer includes Sl and S2. The convolution kernels of C1 and C2 are set to sum respectively, the convolution kernels are 64 and 126 respectively, and Sigmoid is used as the activation function. The Sl and S2 windows are set to, the sampling method is average sampling, and the moving step length is 1. The number of neurons in the full connection layer is 512, the size of Mini-Batch is 64, dropout is 0. 2, and the learning rate is 0.0l The attenuation is 50% every 10 iterations, and the maximum number of iterations is 100.
Table 4 XGBoost algorithm parameters
Parameter name Value Parameter name Value
Learning_rate 0.100 subsample 0.78
max_depth 8.000 colsample_bytree 0.76
n_estimators 150.000 gamma 0.42
scale_pos_weight 0.998 min_child_weight 2.00
4. 3 experimental results and comparative analysis
In order to analyze the influence of training set size on the performance of CNN-XGBoost event detection method, five training sets are randomly selected from the training data sets, namely 20%, 40%, 60%, 80% and 100%, respectively, and then tested on the test set.
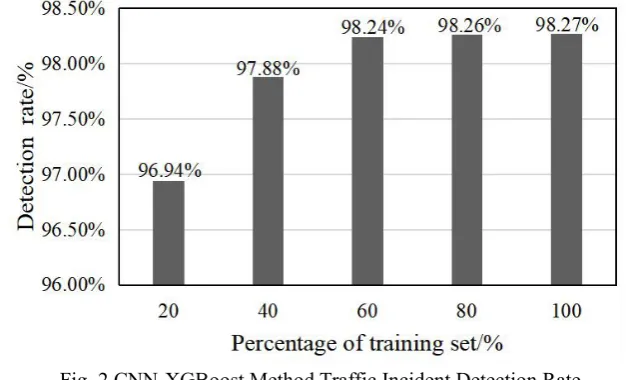
Fig .2 CNN-XGBoost Method Traffic Incident Detection Rate
As can be seen from fig. 3, CNN-XGBoost event detection method has the highest detection rate on 100% training set, reaching 98. 27% accuracy rate, but on 60% training set, the detection rate reaches 98. 24%, the training set increases from 60% to 100%, the detection rate increases relatively little, only by 0. 03%; The training set was increased from 20% to 40%, the detection rate was increased from 96. 94% to 97. 88%, and the accuracy rate was increased by 0. 94. The increase was relatively large. This shows that CNN-XGBoost has strong feature extraction ability, and can train a model with strong representation ability on a limited data set. At the same time, the higher accuracy rate on the test set can also reflect the better generalization of CNN-XGBoost.
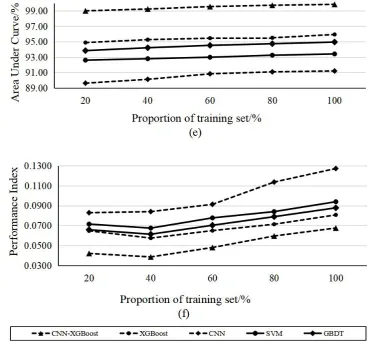
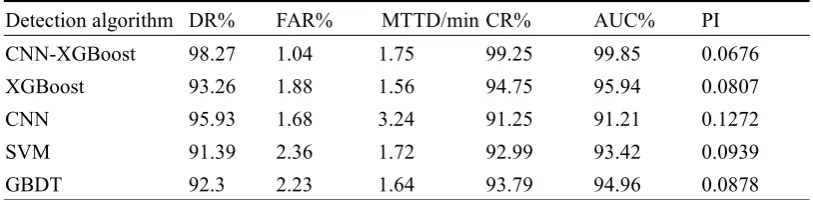
Fig. 3 analysis and comparison of effectiveness of event detection by different methods According to the results in fig. 3 and table 5, when training data sets of different proportions are used, the detection rate and classification accuracy rate of CNN-XGBoost event detection method are above 95%, which is obviously better than xgbost, CNN, SVM, GBDT and other event detection methods. Among them, when using 100% training data set, the detection rate of CNN-XGBoost event detection method is 98.27%, which is 5.37%, 2.44%, 7.53%, 6.47% higher than XGBoost, CNN, SVM, GBDT and other event detection methods respectively. The classification accuracy is 99.25%, which is 4.75%, 8.77%, 6.73% and 5.82% higher than XGBoost, CNN, SVM and GBDT.
Table 5 Detection Effects of Different Event Detection Methods under 100% Dataset Detection algorithm DR% FAR% MTTD/min CR% AUC% PI CNN-XGBoost 98.27 1.04 1.75 99.25 99.85 0.0676 XGBoost 93.26 1.88 1.56 94.75 95.94 0.0807
CNN 95.93 1.68 3.24 91.25 91.21 0.1272
SVM 91.39 2.36 1.72 92.99 93.42 0.0939
GBDT 92.3 2.23 1.64 93.79 94.96 0.0878
Comparing the average detection time of CNN-XGBoost, XGBoost, CNN, SVM, and GBDT models under different proportions of training datasets, we can find that CNN-XGBoost is significantly longer in training time than SVM, GBDT, and XGBoost, but far less than CNN event detection Method, in which the average detection time of CNN-XGBoost event detection method is 1.75min when using 100% training data set, which is 1.12, 0.54, 1.02, 1.07, respectively, for XGBoost, CNN, SVM, and GBDT event detection methods Times.
Through the two indicators of AUC and PI, the comprehensive ability of the event detection method can be evaluated. When different training data sets are used, the AUC of the CNN-XGBoost event detection method has always been greater than 99%, which is significantly better than GBoost, CNN, SVM and GBDT Other event detection methods have higher accuracy in event detection. With 20%, 40%, 60%, 80%, and 100% training dataset ratios, the PI index of CNN-XGBoost has been the lowest among all models.
Based on the above analysis, from the six aspects of detection rate, false alarm rate, training time, classification accuracy rate, AUC and PI indicators, when faced with multi-dimensional and massive traffic data, the CNN-XGBoost event detection method can quickly complete traffic Event detection tasks, with high detection accuracy.
5 Conclusion
The conflict of interest disclosure
There is no conflict of interest regarding the publication of this paper.
The data availability statement
The data used to support the findings of this study are included within the supplementary information files.
Funding statement
No funding was received in the research.
References
[1]Bing Qichun, Gong Bowen, Lin Ciyun, Yang Zhaosheng. Traffic incident automatic detection algorithm for urban expressway [J]. Journal of Central South University (NATURAL SCIENCE EDITION), 2017,48 (06): 1682-1687
[2]Xiaojuan Zhao.Urban expressway traffic incident detection algorithm based on multi-source data [D].Beijing University of technology, 2010.
[3]Shang Qiang, Lin Ci-yun, Yang Zhao-sheng, Bing Qi-chun, Xing Ru-ru. Traffic incident detection based on variable selection andkernel extreme learning machine [J]. Journal of Zhejiang University (Engineering Edition), 2017,51(07):1339-1346+1445.
[4]PAYNE H J, HELFENBEIN E D, KNOBEL H C. Development and testing of incident detection algorithms[R]. Washington D C, USA: Federal Highway Administration, 1976: 1-20
[5]PERSAUD B N, HALL F L. Catastrophe theory and patterns in 30-second freeway traffic data-implication detection[J].Transportation Research Part A, 1990, 23(2): 103-113.
[6]STEPHANEDES Y J, CHASSIAKOS A P. Application of filtering techniques for incident detection[J]. Journal of Transportation Engineering, 1993, 119(1): 13-26.
[7]ZHANG Lun, YANG Wenchen, LIU Tuo.A naive Bayesian classifier-based algorithm for freeway traffic incident automatic detection[J].Journal of Tongji University(Natural Science),2014, 42(4): 558-563.
[8]YIN Chune, CHEN Kuanmin, WAN Jizhi. Automatic detection method for expressway traffic accident based on wavelet equation[J]. China Journal of Highway and Transport, 2014
27(12):106-112.
[9]ROSSI R, GASTaLDI M, GECCHELE G Fuzzy logic-based incident detection system using loop detectors data[J].Transportation Research Procedia, 2015(10): 266-175.
[10]JIANG Guiyan, WEN Huimin, YANG Zhaosheng. Design of freeway automatic incident detection system and algorithm[J].Journal of Traffic and Transportation Engineering, 2001, 1(1):77-81.
[12]CHEN Weirong,GUAN Pei, ZOU Yuexian. Automatic incident detection technology based on SVM[J]. Journal of Southwest Jiaotong University, 2011, 46(1): 63-67.
[13]WANG Wugong, MA Rongguo. Weighed support vector machine for traffic incident detection[J]. Journal of Changan University (Natural Science Edition), 2013, 33(6): 84-87.
[14]Wu Y K, Tan H C. Short-term traffic flow forecasting with spatial-temporal correlation in a hybrid deep learning frame- work[ J/OL].hops;//arxiv. org/abs/1612. 01022,2016-12-3.
[15]Wang J, Gu Q,Wu J, et al. Traffic speed prediction and congestion source explanation : a deep learning method[C] //Proceedings-IEEE International Conference on Data Mining. 2017 ;499-508.
[16] Sun Chen, Tian Xiaosheng. Transformer fault diagnosis based on xgboost algorithm [J]. Journal of Jiamusi University (NATURAL SCIENCE EDITION), 2019,37 (03): 378-380
[17]Zhang Yu, Chen Jun, Wang Xiaofeng, Liu Fei.Application of Xgboost to Fault Diagnosis of Rolling Bearings [J]. Noise and vibration control, 2017,37 (04): 166-170 + 179
[18]Luo Xiaojun,Sun Yuxuan,Liu Haitao. Clustering boundary over-sampling classification
method for imbalanced data sets[J].Journal of Zhejiang University:Engineering Science, 2013,47(6):944I-950.
[19]Wang Yong, Zhou Huiyi, bang Hao, et al,Network traffic classification method basing on CNN [J]. Journal of communications. 2018, 47 (1): 14-23.