DOI: 10.1534/genetics.110.124685
High-Confidence Discovery of Genetic Network Regulators in Expression
Quantitative Trait Loci Data
Christine W. Duarte*
,1and Zhao-Bang Zeng
†,‡,§*Department of Biostatistics, Section on Statistical Genetics, University of Alabama, Birmingham, Alabama and†Bioinformatics Research Center,‡Department of Genetics and§Department of Statistics, North Carolina State University, Raleigh, North Carolina
Manuscript received October 27, 2010 Accepted for publication December 6, 2010
ABSTRACT
Expression QTL (eQTL) studies involve the collection of microarray gene expression data and genetic marker data from segregating individuals in a population to search for genetic determinants of differential gene expression. Previous studies have found large numbers oftrans-regulated genes (regulated by unlinked genetic loci) that link to a single locus or eQTL ‘‘hotspot,’’ and it would be desirable to find the mechanism of coregulation for these gene groups. However, many difficulties exist with current network reconstruction algorithms such as low power and high computational cost. A common observation for biological networks is that they have a scale-free or power-law architecture. In such an architecture, highly influential nodes exist that have many connections to other nodes. If we assume that this type of architecture applies to genetic networks, then we can simplify the problem of genetic network reconstruction by focusing on discovery of the key regulatory genes at the top of the network. We introduce the concept of ‘‘shielding’’ in which a specific gene expression variable (the shielder) renders a set of other gene expression variables (the shielded genes) independent of the eQTL. We iteratively build networks from the eQTL to the shielder down using tests of conditional independence. We have proposed a novel test for controlling the shielder false-positive rate at a predetermined level by requiring a threshold number of shielded genes per shielder. Using simulation, we have demonstrated that we can control the shielder false-positive rate as well as obtain high shielder and edge specificity. In addition, we have shown our method to be robust to violation of the latent variable assumption, an important feature in the practical application of our method. We have applied our method to a yeast expression QTL data set in which microarray and marker data were collected from the progeny of a backcross of two species of Saccharomyces cerevisiae (Brem et al. 2002). Seven genetic networks have been discovered, and
bioinformatic analysis of the discovered regulators and corresponding regulated genes has generated plausible hypotheses for mechanisms of regulation that can be tested in future experiments.
T
ECHNOLOGICAL advances in recent years have given biological researchers access to genomic, transcriptomic, proteomic, and other -omic data at an unprecedented scale. Such data sources describe genetic regulation on multiple levels, and mining this data offers hope of unraveling complex genetic networks. For in-stance, detailed observations about variation in gene ex-pression as a function of natural sequence variation or variation in experimental conditions can potentially be analyzed to learn regulatory relationships among genes. While genetic network prediction offers many bene-fits, there are many computational and statistical chal-lenges associated with network prediction from such large data sets. The ‘‘largeP, smallN’’ problem is com-pounded in network prediction because the number of variables increases fromPtoP(P1) since in principledirected edges can exist between any pair of variables. Not only are there computational difficulties associated with searching among the large space of possible networks, but also there are statistical challenges asso-ciated with being able to infer the correct network from the large space of networks with a limited sample size.
Even with such seemingly insurmountable challenges, various researchers have proposed methods for ge-netic network discovery in genomic data sets. The first application of network discovery techniques to genomic data was in Friedman et al.(2000) in which Bayesian networks were used to discover network structure in a yeast cell cycle microarray gene expression data set. The authors used the ‘‘sparse candidate’’ algorithm for network discovery, which limits the number of possible parents for each node and thus dramatically reduces the size of the network search space. Even with this sim-plification, a large number of high-scoring networks could be found, making it impossible to find a single ‘‘correct’’ network. The authors chose to report a set of high-confidence network features that were found in Supporting information is available online athttp://www.genetics.org/
cgi/content/full/genetics.110.124685/DC1.
1Corresponding author:RPHB 327, 1530 3rd Ave. S., Birmingham, AL 35294-0022. E-mail: [email protected]
the majority of high-scoring networks rather than re-port a single discovered network.
Other common sources of input data for the reverse engineering of genetic networks include time-series microarray data and data from perturbation experi-ments. A new source of input is data from ‘‘genetical genomics’’ or expression QTL experiments in which marker and microarray data are collected from the offspring of an experimental cross of two parental lines. In these experiments, QTL analysis techniques are used to find genetic loci that explain the variation in gene expression observed in the progeny. It has been ob-served that gene expression variables that link to a common genetic locus are often functionally related and/or coregulated and may represent modules in a gene regulatory network.
Expression QTL data sets have been used for genetic network discovery in several articles including Bingand Hoeschele(2005), Li et al.(2005), Keurentjeset al. (2007), and Netoet al. (2008). In most of these studies (all but Netoet al. 2008), the investigators have limited the possible parents for each variable to include only those genes physically located in the confidence region of a QTL, and heuristic methods are used to search among the reduced space of possible models. In Neto et al. (2008), existing Bayesian network algorithms are used to create an undirected skeleton network from the gene expression data, and information about multiple-QTL sharing is used to direct these networks by breaking ‘‘likelihood equivalence’’ among models with different edge directionalities. Schadt et al. (2005) demonstrated an application of expression QTL analy-sis that allows for prioritization of potential gene can-didates underlying certain diseases by performing a joint analysis of clinical and gene expression traits and their QTL linkage. The use of Bayesian networks in conjunction with expression QTL studies to predict potential genetic networks is also presented in Zhuet al. (2004).
While these methods offer a good first step to genetic network discovery from expression QTL data sets, many research questions remain, including importantly the confidence level with which networks or network features are discovered. Additional questions include whether simplifying assumptions made in network construction are justified such as whether causal gene expression variables are always found in the confidence interval of the discovered eQTL and whether full and efficient use of the data (i.e., the full variance–covariance matrix of markers and gene expression variables) is being made in all steps of the network reconstruction algorithm.
Here we take a different approach to address the statistical and computational problems associated with the large P, small N problem. We recognize that the search for the best network with such a large set of variables when allowing for all possible networks is
impractical. However, a well-accepted empirical result in the study of biological networks is that most networks follow a free or power-law architecture. In a scale-free network, the degree of the nodes obeys the so-called power law relationship,
PðkÞ kg; ð1Þ
wherekis the number of edges (or degree) andgis a parameter typically between 2 and 3. See Barabasiand Albert(1999) for a more detailed description of scale-free networks as well as some common examples. In this type of network, a few highly connected nodes are expected to be the most important regulators in the network. In reconstructing a network with this architec-ture, the most important goal is to discover the identity of such ‘‘supernodes’’ since these are the major regu-lators in the network.
Once these major regulators are discovered, a frame-work netframe-work can be constructed that consists of these primary regulators and the nodes being regulated by each. Such a framework network could be obtained more easily and with more confidence than the full detailed network, even with a small sample size. This is because scale-free networks naturally give high power to detect highly connected supernodes: while the power to detect any single edge is low, supernodes that have numerous edges can be discovered if even a fraction of their true edges are detected. Here we outline an algorithm for genetic network discovery in expression QTL data sets that takes advantage of the expected scale-free architecture of genetic networks.
Our approach improves upon current work in genetic network discovery in that we are able to discover major network regulators with high confidence. In fact, we can control the false-discovery rate of discovered regulator genes. The control of the false-discovery rate is not seen in most network reconstruction algorithms, and yet it is needed for users to properly interpret discovered networks. Of course genetic network discovery is a data-mining technique used primarily for hypothesis gener-ation, and discoveries made using our method still need to be validated with controlled experiments to test specific hypotheses.
METHODS
In this work we are concerned specifically with expression QTL (eQTL) data sets, but our method can be readily extended to any data set containing genotypic data and phenotypic data of any kind. We use Bayesian networks as a basis of our technique and thus briefly introduce the theory here (adapted from Spirteset al.2000).
Under a certain set of assumptions (seeappendix), the probability distribution for the vertices V can be decomposed as
PðVÞ ¼ Y
V2V
PðVjParentsðVÞÞ; ð2Þ
where Parents(V) represent all nodes with edges di-rected into the vertexV. The goal in Bayesian networks is to find the network that best fits the observed data, and many algorithms exist for learning the network structure given a set of observations on the network variables. We use as the basis of our method the PC algorithm (Spirteset al.2000) with modifications made specifically for the discovery of scale-free networks and for the analysis of QTL data. The PC algorithm is a conditional independence approach to network discov-ery that starts with a fully connected network and then iteratively ‘‘weeds out’’ edges by testing for conditional independence of connected nodes when conditioning on neighboring nodes with set cardinality of increasing order.
The conditional independence of two variables or nodesXandYconditioned on another set of variables or nodesCadjacent toX andY(including the empty set) is tested by first measuring the conditional correla-tion coefficient and then performing a Fisher’sZ trans-formation. The partial correlation coefficient ofXandY conditional on C is calculated using the following equation,
rXYjC¼
rXYrXCrCY ffiffiffiffiffiffiffiffiffiffiffiffiffiffiffiffi 1r2
XC
q ffiffiffiffiffiffiffiffiffiffiffiffiffiffiffiffi 1r2
CY
q ; ð3Þ
where C is any member of C. Then the additional members ofCare added to the conditioning subset in a stepwise manner using the following equation,
rXYjZ[R¼
rXYjZrXRjZrYRjZ ffiffiffiffiffiffiffiffiffiffiffiffiffiffiffiffiffiffiffi
1r2
XRjZ
q ffiffiffiffiffiffiffiffiffiffiffiffiffiffiffiffiffiffiffi 1r2
YRjZ
q ; ð4Þ
whereR¼C2C, and membersCare added untilZ¼C. The order of conditioning is arbitrary and does not change the calculation.rX ˆYjCis obtained by substituting sample estimates of the correlation parameters into Equations 3 and 4.rX ˆYjCis tested for significance using Fisher’sztransformation,
zðrX ˆYjCÞ ¼1
2
ffiffiffiffiffiffiffiffiffiffiffiffiffiffiffiffiffiffiffiffiffiffiffiffiffiffiffiffi N 3 jCj
p
ln j11rX ˆYjCj
j1rX ˆYjCj
!
; ð5Þ
where jCj is the number of nodes inC, andN is the sample size.
Before we describe our approach, we introduce a concept called ‘‘shielding’’ that is shown in Figure 1. Suppose there is a single QTL and there are two gene expression variables, 1 and 2, whose expression is
associated with the QTL. We refer to gene expression variables as genes from here on for brevity. Further-more, suppose that the edge between the QTL and gene 1 is found to be significant even when conditioning on gene 2; however, the edge between gene 2 and the QTL is found to benot significantwhen conditioning on gene 1. In this scenario, we can not only eliminate the edge between the QTL and gene 2, but also direct the remaining two edges. The edge between the QTL and gene 1 must be directed toward gene 1 since a DNA polymorphism may influence gene expression but not vice versa. In addition, the edge between gene 1 and gene 2 is directed toward gene 2, because this is the only direction consistent with the conditional independence relations found in the data (Spirteset al.2000). Here we say that gene 1 ‘‘shields’’ gene 2 from the QTL or, in other words, gene 2 is conditionally independent of the QTL given gene 1. More generally, a shielder is defined as a gene with a direct connection to a QTL, and a shielded gene is defined as a descendant of the shielder.
Specific method: Now we can describe our method, which is a modification to the PC algorithm. The first step in our approach is to perform QTL analysis on each gene in the microarray data set. Then genes that share a QTL are put into a group, and each of these QTL–gene groups is used in the network reconstruction algorithm to propose a method by which the QTL regulates the genes in the group. Next the ‘‘find shielders’’ algorithm is used to discover the network structure.
Find shielders algorithm:
1. Find skeleton network: Connect each pair of genes with an undirected edge if that pair of genes has a significant conditional correlation given all other genes and the QTL. Specifically, make the edge GiGjfor alli6¼jsuch thatjrGiGjjGk;Qj.0 for allk6¼
i,j.
2. Count edges for each gene: Record the number of edges forGiasni.
3. Find potential shielders among most highly con-nected genes: If ni. t, wheret is a predetermined threshold (we use 5), addGitoS.
4. Test potential shielders for direct connection to QTL: For allSi2S, testjrQSijSjj.0 for allj6¼i.
5. Order remaining shielders according to degree of connectedness: ReorderSsuch thatS1,S2, . . . ,SjSjhas
n1$n2$. . .$njSj.
Figure 1.—Illustration of shielding: Gene 1 is found to
6. Orient edges from QTL to shielder to connected genes: Loop fori¼1:jSj:
a. Label the subset ofGwith direct connections to SiasS9.
b. Create a directed edge fromSito each member of S9provided there is not already an edge directed the opposite way.
c. SetS¼S9and find a newS9for eachSinS. d. Recursively repeat the previous two steps until
all setsS9are empty or already directed. 7. Remove insignificant shielders: Count the number of
descendants of eachS2Sand test if it is above the simulation-determined threshold (calculated in next section). If not, remove all edges connecting S to each of its descendants.
Threshold calculation:Because of the expected scale-free nature of biological networks, we expect our al-gorithm to result in just a few highly connected nodes. Because Bayesian network inference of such a large network from noisy microarray data is expected to yield many false-positive edges, we propose a test to identify true shielders when taking into account a large number of false edges. Our hypothesis is formulated as follows.
Suppose our discovered network hasnnodesandnedges
and there is a putative shielderSthat shieldsnshieldgenes.
The null hypothesis is that the number of genes with connections toSis not unusual given a random distribu-tion of nedges among nnodes, and since many of these
discovered edges may be false, the declaration of S as ‘‘highly connected’’ may also be false. The alternative hypothesis is that thenshieldconnections to the shielder
are much larger than expected given a random assign-ment ofnedgesedges tonnodesnodes, and even if a large
portion of those edges are found to be false, the declaration ofSas being highly connected would still hold. Thus, to be considered significant, a shielder needs to shield more than a threshold number of genes in the network, where the threshold is calculated as follows:
1. Calculate the total number of discovered edges and connected nodes remaining after the execution of the first step in the method (first-order conditional independence testing of all pairs of genes) and call these quantitiesnedgesandnnodes, respectively.
2. For each shielder, calculate the number of shielded genes, where a shielded gene is defined as a de-scendant of a shielder, and call the number of shielded genes for this shieldernshield.
3. Calculate the probability of obtaining a single shielder withnshieldshielded genes given the null hypothesis
thatnedgesedges are distributed randomly among the
nnodesgenes in the network. We calculate this
proba-bility by creating an empirical null distribution by randomly assigning nedges balls to nnodes bins many
times (1000) and recording the top 1aquantile of the histogram.
4. For shielders whose number of shielded genes is less than the 100(1 a)% quantile of the histogram, remove connections to all shielded genes.
We require that at least five edges be discovered to calculate an empirical threshold. By focusing our attention on the discovery of highly connected shielder genes with direct connections to the QTL, we believe we are finding high-confidence network features. Here we are interested in constructing a ‘‘framework’’ network rather than the full detailed network; specifically we are constructing the ‘‘chain of command’’ or flow of infor-mation from the QTL to each of the regulated genes. The use of only first-order conditional independence tests is for computational and statistical power reasons; see Magweneand Kim(2004) for a similar use of first-order conditional independence testing. See Figure 2 for a toy example to illustrate the find shielders algorithm.
RESULTS
eQTL analysis of a yeast microarray data set: The yeast data set was analyzed using multiple-interval mapping (MIM) as described in Zou and Zeng (2009). Because our current network reconstruction method allows only for single-QTL models, we used the results of the first step of this method only, which is forward selection of QTL for each gene expression trait. Figure2.—Illustration of the find shielders algorithm. (A)
To group closely linked eQTL, we divided the yeast genome into bins to search for eQTL hotspots, which are bins containing eQTL for many genes (as in BREM et al.2002). We used a sliding-window approach with a bin size of 20 cM and a bin increment of 10 cM. Previous analysis (Zouand Zeng2009) shows that the average 1.5 LOD dropoff interval was 25 cM in this data set, so the bin size we use roughly corresponds to the expected 95% confidence interval for each eQTL. Figure 3 shows a plot of the number of genes with eQTL in each bin across the genome. Several eQTL hotspots are im-mediately apparent on chromosomes 2, 3, 5, 8, 12, 13, 14, and 15.
To test our genetic network discovery algorithm, we chose to analyze eQTL hotspots with $100 linked genes because QTL with the most linked genes repre-sent the most important hubs of transcriptional control. Some relevant statistics about each gene group (eQTL hotspot) are summarized in Table 1. The following attributes are described for each eQTL: the position, the average percentage of genetic variance explained by the eQTL (R2), the percentage of other genes linked to
each gene, and the average correlation among genes. The number of linked genes is seen to vary from100 to .600, the average R2 varies from 10% to 20%, the
average percentage of correlated genes (determined using a 0.05 cutoff on Fisher’sZscore) varies from 63% to 93%, and the average gene–gene correlation varies from 0.24 to 0.56. Thus the eQTL are seen to be of large effect, and the set of genes linked to each eQTL is seen to be highly correlated. We attempt to mimic the basic statistical properties of the gene groups defined by these eQTL hotspots in constructing our simulated networks. Simulations: Because we have developed a method for discovering scale-free networks, we test the method by simulating scale-free networks with the well-known Barabasi and Albert ‘‘rich get richer’’ generative model (Barabasiand Albert1999) in which new edges are added to specific nodes with probability proportional to the current number of edges in those nodes. To test the robustness of our method to the assumption of
scale-free networks, however, we also simulated random net-works in which a given number of edges are randomly assigned to a set of nodes. In addition, we also wished to test the robustness of our method to the latent variable assumption, which is the assumption that all variables that are a common cause of two or more variables in the true network are present in the data set. Since this assumption is rarely true in practice, it is important to test the robustness of our method to this assumption. Thus we simulated networks in which 25% or 50% of genes are randomly selected to not be included in the data set, and in addition we simulated networks in which all of the primary shielders (genes with direct connec-tion to the QTL) are removed from the data set.
We simulated networks with 1000 genes with number of edges equal to 250, 500, or 1000. The number of genes directly connected to the eQTL (‘‘shielders’’) was chosen to be 1, 2, or 3. The QTL–gene and gene–gene regression coefficients were chosen to give QTL R2
values and gene–gene correlation values similar to those observed in the yeast data set. Different ranges of values were examined, and ultimately the QTL–gene regres-sion coefficients were drawn from a uniform distribu-tion between 1.5 and 3, and the gene–gene regression coefficients were drawn from a uniform distribution between 0.5 and 1.5.
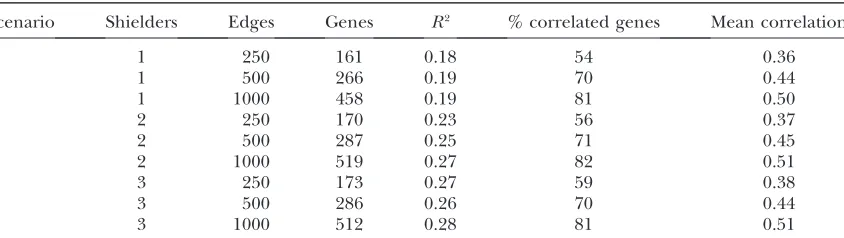
Note that although the number of network genes was held constant at 1000, the number of genes linked to the QTL was#1000. Since only genes with significant association to the eQTL will be observed in the eQTL data set, we use this number (number of linked genes) as the size of the network, and this number varied depending on the resulting connection of each gene to the QTL in each simulated network. One hundred networks were generated for each simulation scenario. The basic statistics for the simulated scale-free networks for each set of network parameters are shown in Table 2. The average number of genes in each network family varied from 161 to 519, the averageR2varied from 18%
to 28%, the average percentage of correlated genes ranged from 54% to 82%, and the average gene–gene correlation ranged from 0.36 to 0.51. This range of statistics roughly covered the range of statistics seen in the yeast data set.
As Table 3 shows, the shielder false-positive rate is well controlled below the set level of 5% for the random and scale-free networks, and in fact in many scenarios none of the 100 simulations resulted in the discovery of a false shielder. Even when allowing for violation of the latent variable assumption, the false-positive rate did not rise too much above the 5% level. With 25% of the variables missing, the 5% level is still maintained. With 50% of the variables missing, there is one scenario with a slightly .5% false-positive rate. Even with all primary shielders removed, a very severe violation of the latent variable assumption, the false-positive rate does not rise to .10%. Thus it can be seen that our method results in Figure3.—Number of eQTL per 10-cM bin across 16 yeast
highly specific, accurate discovery of network regulators in gene expression networks.
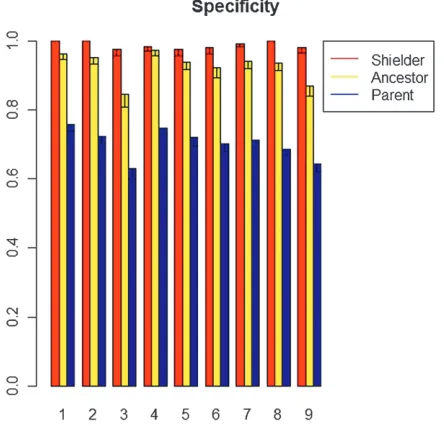
In Figure 4 we illustrate the specificity of our method by giving the shielder, ancestor, and edge specificity for simulated scale-free networks. The shielder specificity is the percentage of discovered shielders that are true, the ancestor specificity is the percentage of discovered ancestor relations (descendants of discovered shield-ers) that are true, and the edge specificity is the per-centage of discovered edges that are true. It is seen that our reconstruction is highly specific with extremely high shielder specificity and reasonably high ancestor and edge specificity as well.
Table 4 shows the power of our method to detect shielders in terms of the percentage of simulated net-works in which one or more true shielders were dis-covered and the number of true shielders disdis-covered per network. Moderate power is achieved for recovering at least one true shielder per network, although as the number of shielders increases it becomes difficult to recover them with a limited sample size. Figure 5 shows the power of our method in terms of the number of
shielder edges discovered per discovered shielder. Our method is able to consistently discover roughly half of the shielder edges per discovered shielder over all of the simulated scenarios.
Network reconstruction for yeast eQTL hotspots: Seven networks were reconstructed from the 11 eQTL hotspots analyzed using our algorithm (see Table 1). We discuss four of these (in Figures 6–9), and the remaining networks are found insupporting information,Figure S1,Figure S2, and Figure S3.In addition, all network genes and corresponding shielders are found inTable S1(graphical output is generated using Cytoscape,www. cytoscape.org).
On chromosome 3 at 79,091 bp is an eQTL hotspot for genes related to leucine biosynthesis; the discovered network is shown in Figure 6. There is a known loss-of-function mutation inLEU2 in one of the strains, and
LEU2 has been established as the causal cis eQTL (Yvert et al.2003).LEU2 is an enzyme in the leucine biosynthesis pathway and is a target of the transcription factorLEU3. Other genes in Figure 6 includingLEU1,
BAT1,OAC1, andBAP2are all established or potential
TABLE 1
Basic statistics for gene groups from several eQTL hotspots, including network ID, number genes in network, averageR2for gene–QTL association for network genes, average percentage of correlated network genes using
0.05 as a cutoff using Fisher’sZtest, and average gene–gene correlation
Network Chromosome bp Genes R2
% correlated genes
Mean correlation
1 2 368,060 143 0.11 87 0.46
2 2 537,314 511 0.16 82 0.42
3 3 79,091 246 0.17 83 0.44
4 5 395,442 211 0.12 76 0.39
5 7 52,613 88 0.11 96 0.56
6 8 98,513 146 0.14 70 0.30
7 12 674,651 230 0.20 65 0.28
8 13 46,084 91 0.14 64 0.28
9 14 449,639 613 0.19 66 0.30
10 15 180,961 522 0.16 80 0.38
11 15 572,410 108 0.10 86 0.43
TABLE 2
Basic statistics of simulated gene networks given as an average over 100 simulations, including number of shielders (genes with direct connection to the QTL), number of edges, number of genes in network, average
R2for gene–QTL association for network genes, average percentage of correlated network genes using 0.05 as a cutoff using Fisher’sZtest, and average gene–gene correlation
Scenario Shielders Edges Genes R2 % correlated genes Mean correlation
1 1 250 161 0.18 54 0.36
2 1 500 266 0.19 70 0.44
3 1 1000 458 0.19 81 0.50
4 2 250 170 0.23 56 0.37
5 2 500 287 0.25 71 0.45
6 2 1000 519 0.27 82 0.51
7 3 250 173 0.27 59 0.38
8 3 500 286 0.26 70 0.44
targets ofLEU3(see Table 1 in Kohlhaw2003).LEU3 has been shown to be activated by a-isopropylmalate, a product in the leucine biosynthesis pathway. With loss of function of LEU2, there would be a buildup of
a-isopropylmalate in the susceptible strain that would cause activation of theLEU3transcription factor, which could potentially generate production of more a --isopropylmalate in a feedback loop. The discovered shielder,LEU1, catalyzes the second step in the leucine biosynthesis pathway, the step directly beforeLEU2, the defective enzyme in the susceptible strain. ThusLEU1
could act as a shielder of the eQTL by modulating this feedback loop (as a target ofLEU3and an activator of
LEU3by catalyzing the production ofa-isopropylmalate). The relation of this eQTL hotspot to leucine biosynthesis
has also been noted in Yvert et al.[(2003); see their Table S2, group 4] and in Sunet al.(2007) in which the authors find indirect evidence for LEU3 activation through joint analysis of eQTL and transcription factor activity data.
For the eQTL on chromosome 7 at 674,651 bp (see Figure 7), two shielders were discovered, UBX6 and
ERG20. UBX6 is annotated as a ubiquitin regulatory
X (UBX) domain-containing protein that interacts with
CDC48p, and its transcription is repressed when cells are grown in media containing inositol and choline. The genes shielded by UBX6 are enriched for the GO biological process oxidation reduction (33.3% of shielded genesvs.5.7% in the reference Saccharomyces Genome Database (SGD), P # 7.43) and for the GO
molecular function heme binding (22.2% vs. 0.5% in reference,P#1.56). The other shielder,ERG20, is an
enzyme involved in isoprenoid and sterol biosynthesis.
TABLE 3
Shielder false-positive rate measured as number of simulations (of 100) in which one or more false shielders were discovered for simulated scale-free and random networks as well as for scale-free networks
under a variety of violations of the latent variable assumption
Scenario Scale-free Random Latent, 25% Latent, 50% Latent, no shielders
1 0 1 0 3 5
2 0 0 0 2 5
3 2 0 2 3 6
4 1 0 4 2 6
5 2 0 1 6 2
6 1 0 2 3 2
7 1 1 1 4 7
8 0 0 3 1 8
9 1 0 3 3 1
Latent, 25% indicates 25% of variables are randomly removed; Latent, 50% indicates 50% of variables are removed; and Latent, no shielders indicates all of the shielders are removed.
Figure 4.—Specificity of simulated networks for various
network parameters. Shielder, ancestor, and edge specificity are defined as the percentage of correctly detected shielders, descendants, and edges, respectively, with error bars repre-senting the standard error estimated from 100 simulations. The simulation parameters for scenarios 1–9 are given in Table 2.
TABLE 4
Power to discover shielders measured as the percentage of simulations in which one or more true shielders were discovered and the number of true shielders discovered
per network compared with the total number of true shielders per network
Scenario
Probability
$1 shielders found
Discovered true shielders
True shielders
1 59.0 (4.9) 0.52 (0.05) 1
2 58.0 (5.0) 0.47 (0.05) 1
3 55.0 (5.0) 0.33 (0.05) 1
4 69.0 (4.6) 0.68 (0.05) 2
5 62.0 (4.9) 0.60 (0.06) 2
6 52.0 (5.0) 0.46 (0.05) 2
7 69.0 (4.6) 0.63 (0.06) 3
8 71.0 (4.6) 0.62 (0.05) 3
9 58.0 (5.0) 0.46 (0.05) 3
Its shielded genes show a strong enrichment for biological processes involved in sterol biosynthesis (for instance, 42.3% of shielded genesvs.0.8% of reference genes are involved in the sterol metabolic process,P#3.415).
Yvertet al.(2003) also found enrichment for heme and fatty acid-related genes at this hotspot (group 8).
The eQTL on chromosome 14 at 449,639 bp was found to have two shielders:PNT1andPET56.PNT1is involved in targeting of proteins to the mitochondrial inner membrane and is a pentamidine resistance pro-tein. The genes shielded by bothPNT1andPET56 show strong enrichment for the biological processes mito-chondrial translation (20.7%vs.1.9% in reference,P#
1.710) and mitochondrion organization (29.3% vs.
4.9% in reference,P #4.010). It seems plausible that
the expression of a protein involved in targeting proteins to the mitochondrion could influence the expression of proteins involved in mitochrondrion or-ganization, and this hypothesis could be tested in follow-up experiments. This eQTL hotspot in Yvert et al. (2003) (group 11) is annotated as ‘‘mitochrondria’’ but the mechanism for regulation is listed as unknown; thus perhapsPNT1and/orPET56can help explain regula-tion at this eQTL hotspot.
Finally, on chromosome 15 at 180,961 bp there is an eQTL found to haveHSP31as the primary shielder. The genes shielded byHSP31are found to be enriched for the biological process response to temperature stimulus (15.4%vs. 0.7% in reference,P # 1.7e2). HSP31 is a
heat-shock protein that is annotated as a possible chaperone and cysteine protease and a member of the DJ-1/ThiJ/PfpI superfamily, which includes human DJ-1
involved in Parkinson’s disease. In addition, many of the network genes are targets ofMSN2andMSN4(44.4%), which are transcription factors activated in stress con-ditions, an enrichment that was also noted for this hotspot in Yvertet al.(2003) for group 12.
DISCUSSION
We have developed a robust method for the discovery of genetic network regulators in expression QTL data sets, although our method can be generally applied to any data set with genotypic and phenotypic data. The aim of our method is to identify the key regulators near the root of the network and a set of genes regulated by each of these shielder genes. By estimating a framework network rather than a full network, we are able to draw realistic inferences from the small sample size data sets that we use as input. Considering the limited sample size of our data sets (100) and the large number of network genes (.600 for some networks), our algorithm suc-ceeds in finding a large number of key network regulators with high confidence. We have demonstrated with simulation that we can control the shielder false-positive rate below the 5% level of the test when our model assumptions hold. We have even shown our method to be relatively robust to violation of model assumptions, with very little increase in the shielder false-positive rate even with severe violations of the latent variable assumption.
In application of our method to a yeast eQTL data set, seven networks have been discovered. Bioinformatic Figure5.—Shielder edge sensitivity measured as the
num-ber of true shielder edges detected, for detected shielders, compared with the total number of true shielder edges, with error bars representing the standard error estimated from 100 simulations. The simulation parameters for scenarios 1–9 are given in Table 2.
Figure 6.—Discovered network for network 3: eQTL on
analysis of these networks has generated plausible hypotheses for mechanisms of regulation that can be tested in follow-up studies. We have found agreement between our method and previous eQTL studies, although our algorithm was not able to discover net-works for all important eQTL hotspots in this data set (including those due to mutations inGPA1andAMN1
in Yvertet al.2003). While the specificity of our method to detect network regulators (shielders) is high as shown
through simulation, the power can be modest, and thus some networks may fall below our detection threshold. Finding ways to increase the power without sacrificing specificity is a major focus of future research.
Another important issue in network reconstruction is the presence of latent variables. We approached this issue through simulation of latent variables and testing the resulting shielder false-positive rate, but the prob-lem could be approached more directly through direct Figure7.—Discovered network for network 7:
eQTL on chromosome 12 at 674,651 bp.
Figure 8.—Discovered
modeling of the latent variables, using, for instance, structural equation modeling techniques (Liu et al. 2008); this is another topic that will be pursued in future research. Another interesting approach to incorporat-ing latent variables is given in Sunet al.(2007) in which specific transcription factor activity that is not directly assayed in eQTL data sets is indicated through joint modeling of eQTL and transcription factor activity data. More generally, approaches for joint modeling of cross-platform data sets will become increasingly important, and extension of our method to more than two levels of data and to different types of data such as proteomic, epigenomic, or metabolomic data will allow for more intergenomic data analysis for future genomics research.
We thank Rachel Brem and Leonid Kruglyak for sharing the genotype data that Rachel Brem has made available at her laboratory website, http://blogs.ls.berkeley.edu/bremlab/data/. The gene ex-pression data are available at http://www.ncbi.nlm.nih.gov/geo/. C.W.D. acknowledges the help of former Zeng laboratory members Wei Zou, Jessica Maia, and David Aylor; helpful input from her graduate committee members Russell Wolfinger, Jung-Ying Tzeng, and Ronald Sederoff; and funding of her graduate training at North
Carolina State University through a Vertical Integration of Research and Education in the Mathematical Sciences fellowship from the National Science Foundation and an internship at the SAS Institute.
LITERATURE CITED
Barabasi, A.-L., and R. Albert, 1999 Emergence of scaling in
ran-dom networks. Science286:509.
Bing, N., and I. Hoeschele, 2005 Genetical genomics analysis of a
yeast segregant population for transcription network inference. Genetics170:533–542.
Brem, R. B., G. Yvert, R. Clintonand L. Kruglyak, 2002 Genetic
dissection of transcriptional regulation in budding yeast. Science
296:752–755.
Friedman, N., M. Linial, I. Nachmanand D. Pe’er, 2000 Using
Bayesian networks to analyze expression data. J. Comput. Biol.
7:601–620.
Keurentjes, J. J., J. Fu, I. R. Terpstra, J. M. Garcia, G. van den
Ackerveken et al., 2007 Regulatory network construction in
Arabidopsis by using genome-wide gene expression quantitative trait loci. Proc. Natl. Acad. Sci. USA104:1708–1713.
Kohlhaw, G. B., 2003 Leucine biosynthesis in fungi: entering
me-tabolism through the back door. Microbiol. Mol. Biol. Rev.67:
1–15.
Li, H. Q., L. Lu, K. F. Manly, E. J. Chesler, L. Bao et al.,
2005 Inferring gene transcriptional modulatory relations: a genetical genomics approach. Hum. Mol. Genet.14:1119–1125. Liu, B., A.de laFuenteand I. Hoeschele, 2008 Gene network
in-ference via structural equation modeling in genetical genomics experiments. Genetics178:1763–1776.
Magwene, P. M., and J. H. Kim, 2004 Estimating genomic
coexpres-sion networks using first-order conditional independence. Genome Biol.5:R100.
Neto, E. C., C. T. Ferrara, A. D. Attie and B. S. Yandell,
2008 Inferring causal phenotype networks from segregating populations. Genetics179:1089–1100.
Schadt, E. E., J. Lamb, X. Yang, J. Zhu, S. Edwardset al., 2005 An
integrative genomics approach to infer causal associations between gene expression and disease. Nat. Genet.37:710–717.
Spirtes, P., C. Glymourand R. Scheines, 2000 Causation,
Predic-tion, and Search. MIT Press, Cambridge, MA.
Sun, W., T. Yuand K.-C. Li, 2007 Detection of eQTL modules
me-diated by activity levels of transcription factors. Bioinformatics
23:2290–2297.
Yvert, G., R. B. Brem, J. Whittle, J. M. Akey, E. Foss et al.,
2003 Trans-acting regulatory variation in Saccharomyces cerevi-siae and the role of transcription factors. Nat. Genet.35:57–64. Zhu, J., P. Y. Lum, J. Lamb, D. GuhaThakurta, S. W. Edwardset al.,
2004 An integrative genomics approach to the reconstruction of gene networks in segregating populations. Cytogenet. Ge-nome Res.105:363–374.
Zou, W., and Z.-B. Zeng, 2009 Multiple interval mapping for gene
expression QTL analysis. Genetica137:125–134.
Communicating editor:I. Hoeschele
Figure9.—Discovered network for network 10: eQTL on
chromosome 15 at 180,961 bp.
APPENDIX
As described in Spirteset al.(2000), the assumptions required for Bayesian network learning include the causal Markov condition, causal minimality assumption, the faithfulness assumption, and the causal sufficiency as-sumption. The causal Markov condition states that in the probability distribution P over V generated by causal graphG, each variable or vertex is independent of its nondescendants given its parents (see Equation 2).
GENETICS
Supporting Information
http://www.genetics.org/cgi/content/full/genetics.110.124685/DC1
High-Confidence Discovery of Genetic Network Regulators in Expression
Quantitative Trait Loci Data
Christine W. Duarte and Zhao-Bang Zeng
Copyright
Ó
2011 by the Genetics Society of America
C. W. Duarte and Z-B. Zeng 2 SI
C. W. Duarte and Z-B. Zeng 3 SI
C. W. Duarte and Z-B. Zeng 4 SI
C. W. Duarte and Z-B. Zeng 5 SI
TABLE S1
All network genes and corresponding shielders