An Enhanced Data Distribution with Protection of
Agent Colluding Attacks
Ms. P.Brindha
1Prof. P.S.Balamurugan
2Ms. S.Kalai selvi
31(PG Scholar (CSE), Karpagam University, Coimbatore, Tamilnadu, India) 2(Research Scholar, Anna University, Coimbatore, Tamilnadu, India)
3(Assistant Professor (Applied Sciences), Velalar College of Engineering and Technology, Erode, Tamilnadu, India)
Abstract----In a data distribution scenario the sensitive data given
to agents can be leaked in some cases and can be found in unauthorized places. We consider the addition of fake objects to the distributed set which do not correspond to real entities but appear realistic to the agents. The distributor must assess the likelihood that the leaked data came from one or more agents, as opposed to having been independently gathered by other means. We also present data allocation strategies and algorithms for distributing objects to agents, in a way that improves our chances of identifying a leaker. Our main idea is to prevent the agents from comparing their data with others to identify fake objects. A Semantic Inference Model (SIM) is used here to find out the probability of identifying dependency among the data distributed to various agents. Using this technique semantic inference graph (SIG) is drawn denoting the links among data sets.
Keywords -agent colluding, data inference, database security,
guilty agent probability
I.
I
NTRODUCTIONTraditionally, leakage detection is handled by watermarking, e.g., a unique code is embedded in each distributed copy. If that copy is later discovered in the hands of an unauthorized party, the leaker can be identified. Watermarks can be very useful in some cases, but again, involve some modification of the original data. Furthermore, watermarks can sometimes be destroyed if the data recipient is malicious. So we consider the option of adding “fake” objects to the distributed set. Such objects act as a type of watermark for the entire set, without modifying any individual members. If it turns out that an agent was given one or more fake objects that were leaked, then the distributor can be more confident that agent was guilty. The approach used here to identify the probability of agent colluding attacks is Semantic inference model (SIM). A semantic Inference Graph (SIG) is drawn that links all the related attributes, which can be derived by identifying attribute dependency from data dependency, database schema, and semantic related knowledge. Based on the SIM, the violation
detection system keeps track of a user’s query history. When a new query is posed, all the channels where sensitive information can be inferred will be identified. If the probability of inferring sensitive information exceeds a pre-specified threshold, then the current query request will be denied. In section 2 we start by our problem setup and notations whereas section 4 and 5 discuss briefly about the analysis of agent guilt model and the various data allocation strategies respectively. Our technique to calculate the probability of agent colluding attacks is explained in section 6. Access control mechanisms are commonly used to protect users from the divulgence of sensitive information in data sources. However, such techniques are insufficient because malicious users may access a series of innocuous data, and from the received answers, they can employ such information to retrieve data.
II.
P
ROBLEMS
ETU
PA
NDN
OTATIONSII.1. Agent and data requests
The data to be distributed are denoted as objects t1, t2,..,tn and the agents to whom the data is handed over are denoted as R1, R2,…,Rn. The allocation of objects is performed based on two choices. Agents themselves can request data that satisfy some condition or the distributor can allocate data randomly to agents if they do not insist with conditions. They are denoted as explicit and sample data requests respectively. Agents are also chosen by analyzing various techniques.
II.2. Data objects
exact numbers.
III.
D
ATAA
LLOCATIONS
TRATEGIESOur main focus is on the data allocation problem: how can the distributor “intelligently” give data to agents in order to improve the chances of detecting a guilty agent? As illustrated in Fig. 1, there are four instances of this problem we address, depending on the type of data requests made by agents and whether “fake objects” are allowed. The objects are designed to look like real objects, and are distributed to agents together with T objects, in order to increase the chances of detecting agents that leak data. We represent our four problem instances with the names EF, EF, SF, and SF, where E stands for explicit requests, S for sample requests, F for the use of fake objects, and F for the case where fake objects are not allowed. Note that, for simplicity, we are assuming that in the E problem instances, all agents make explicit requests, while in the S instances, all agents make sample requests.
III.1. Data request with explicit condition
III.1.1. Data Request with e-random
Here we combine the allocation of the explicit data request with the agent selection of e-random. Initially we find agents that are eligible to receiving fake objects in O (n) time. Then, the algorithm creates one fake object in every iteration and allocates it to random agent.
III.1.2. Data Request with e-optimal
Still to improve the algorithm for allocation explicit data request we are combining this algorithm with the agent selection for e-optimal method. This algorithm based on e-optimal makes a greedy choice by selecting the agent that will yield the greatest improvement in the sum-objective.
III.2. Data request with sample III.2.1. Data Request with s-random
Algorithm s-random allocates objects to agents in a round-robin fashion. After the initialization of vectors d and a, the main loop is executed while there are still data objects (remaining > 0) to be allocated to agents. In each iteration of this loop, the algorithm uses function SELECT OBJECT () to find a random object to allocate to agent Ui. This loop iterates over all agents who have not received the number of data objects they have requested.
III.2.2. Data Request with s-overlap
In the previous section the distributor can minimize both objectives by allocating distinct sets to all three agents. Such an optimal allocation is possible, since agents request in total fewer objects than the distributor has. This is overcome by
III.2.3. Data Request with s-max
This algorithm we present here is termed as object selection for s-max. If we apply s-max to the example above, after the first five main loop iterations in algorithm of allocating data request, the Ri sets are:
R1 = {t1, t2}; R2 = {t2}; R3 = {t3}; and R4 = {t4}
In the next iteration, function SELECT OBJECT () must decide which object to allocate to agent U2. We see that only objects t3 and t4 are good candidates, since allocating t1 to U2 will yield a full overlap of R1 and R2.
IV.
R
ELATEDW
ORKThe guilt detection approach we present is related to the data provenance problem [3]: tracing the lineage of S objects implies essentially the detection of the guilty agents. Tutorial [4] provides a good overview on the research conducted in this field. Distribution of data is well expressed in [5] with various techniques. Data handled electronically [33] serves good for our survey of data distribution.Our problem formulation with objects and sets is more general and simplifies lineage tracing, since we do not consider any data transformation from Ri sets to S.As far as the data allocation strategies are concerned, our work is mostly relevant to watermarking that is used as a means of establishing original ownership of distributed objects. Our approach and watermarking are similar in the sense of providing agents with some kind of receiver identifying information.
V.
S
EMANTICI
NFERENCEM
ODELTo represent the possible colluding attacks from any agents to the different data allocation strategies, here we use the semantic inference model. SIM represents dependent and semantic relationships among attributes of all the entities in the information system. The related attributes (nodes) are connected by semantic inference graph and the inference introduced by semantic links is computed using Computational Probability Table for nodes connected by semantic links.
V.1. Semantic inference graph
Fig2. Semantic Inference model. Entities are interconnected by schema reltions (diamond) and semantic relations (hexagon). The related attributes (nodes) are connected by their data dependancy, schema and semantic links.
V.1.1. Dependency link
When a SIM is instantiated, the dependency within- entity is transformed into dependency-within-instance in the SIG. Similarly, the dependency-between-related-entities in the SIM is transformed into a dependency between two attributes in the related instances. This type of dependency is preserved only if two instances are related by the instantiated schema link. That is, if attribute B in instance e2 depends on attribute A in instance e1, and instances e1 and e2 are related by R.
V.1.2. Schema link
The schema links between entities in the SIM represent “key, foreign-key” pairs. At instance level, if the value of the primary key of an instance e1 is equal to the value of the corresponding foreign key in the other instance e2 which can be represented as R(e1, e2), then connecting these two attributes will represent the schema link at the instance level. Otherwise, these two attributes are not connected.
V.1.3. Semantic link
At the instance level, assigning the value of the source node to “unknown” disconnects the semantic link between the attributes of two instances. On the other hand, if two instances have a specific semantic relation, then the inference probability of the target node will be computed based on its CPT and the value of the source node.
VI.
D
ATABASED
ESIGNFollowing example explain how inference affects data leakage.
Table1. Database1
NAME SALARY CITY
Babu 45 K Coimbatore
Anna 50 K Coimbatore
Jackson 60 K Chennai
Name: string Salary: integer City: string
CITY SALARY
Coimbatore 45K
Coimbatore 50K
Chennai 60K
In this TABLE, the attribute City does not functionally determine attribute Salary, as both Anna and Babu live in Coimbatore but they earn different salaries. As a result, schema based inference detection systems do not report any inference threat in this database. However, if a user knows that Jackson is the only employee who lives in Chennai, the user can infer the salary of Jackson by querying the database to find the salary of the employee who lives in Chennai in the second table. This example illustrates that simply examining the database schema to detect inference is not sufficient, and taking the data in the database into consideration can lead to the detection of more inferences. We accessing them when fake objects created to any agent, probability will be calculated and on each fake object that probability goes on increasing. If probability is below threshold then fake object is allocated to that agent but if probability exceeds specified threshold, then that agent is not getting fake objects. This is the case for single agent. In the same way for multi agent environment, when different agent tries to collaborate to increase probability of accessing information, then probability of the agent will goes on increasing whose information other agents are accessing. Here basically we have tried to implement inference controlling mechanism for creating fake object for all agents and their probability will be calculated. Consider two dependent objects A and B. The degree of dependency from B to A can be represented by the conditional probabilities,
pi|j =Pr (B=bi|A=aj)
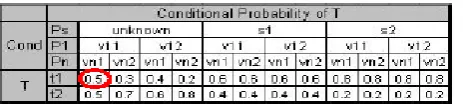
Fig 3.b. The CPT of target node T summarizes the conditional probabilities of t given values of Ps and P1…Pn. For eg. Pr(T-t1/Ps=unknown, p1=v11, pn=vn1)-0.5.
For secure data allocation a model is developed for evaluating inference based on the past fake object allocation sequences. Semantic Inference Model (SIM) consists of data dependency, relational database schema, and domain-specific semantic knowledge. So Semantic Inference Model (SIM) representing them as probabilistic inference channels to access any data from the system. Probability is calculated as conditional probability, given as Pi|j = Pr (B=bi|A=aj). It represents the occurrence of A and b and Co occurrences of A and B. Also it represents the dependency from B to A. Initially probability and data probability is set to 0.0. When data is allocated to first agent, probability is calculated as number of fake objects is allocated to specific agent within number of data is divided by total number of times agent has been allocated data within number of fake objects. This probability will be stored in log. Next time when same agent is allocated for objects, probability will be checked from log. If it is below threshold objects can be allocated to the same agent, otherwise the other type of fake object is created and allocated to that agent.
Table3. Probability calculation (single agent)
Agent Access
Data from Agent
Probability Total
Count
Count
X 0.0 0 0
A 0.1 0 0
A 0.2000 1 1
A 0.4000 2 2
A 0.8000 3 3
X A 0.0 0 0
A 0.1 0 0
B 0.2000 1 1
B 0.3000 2 0
Agent: string
Access data from agent: integer Probability: integer
these two variables are set to 0. First time probability is calculated as 0.1. Difference between above two examples is that, in first case agent is accessing data from same table and in second case agent is accessing data from two different tables. Depending on that count will be calculated differently. When Agent A is accessing data of Agent D, probability of A will be increased and data probability of Agent D will be increased. Same goes on continuing, if probability or data probability which one is reaching to threshold earlier, allocation is denied or new allocation done.
TABLE4 explains the probabilistic calculation for multiuser environment. Probability calculation is same like single agent. Difference is, here data probability calculation is for agent whose data other agent are accessing.
Table4. Probability calculation (Multiple agents)
Agent Accessing data from other agent
Data probability
Data count1
Data count2
D 0.0 0 0
A D 0.1 0 0
B D 0.2000 0 1
C D 0.3000 0 2
B D 0.6333 1 3
A D 0.8333 1 4
Data probability: continuous Data count1: integer Data count2: integer
Data Probability = (datacount1 / datacount2) + Previous (Data Probability)
Datacount1 = Keeping record of fake objects allocated Datacount2 = Total number of count incrementing depending on each access.
VII.
S
IMULATIONS
ETUPA
NDR
ESULTS
Fig 4.a. Database of records for distributing to the agents
This is repeated until the inference probability reaches or gets below the threshold value. The figure 4.a. displays the database that containing the collection of data records. These data are distributed to the agents based on their request either explicit or sample. The agent and object selection are done with different techniques. Finally, SIM is implemented to find the probability for each agent.
Fig 4.b.SIM probability calculation
Fig 4.b displays the Semantic Inference model implementation. Here the agent selected in this iteration is 2. The computational probability of the agent 2 is found to be 9.1667e-004. This is beyond the threshold value 0.5. So another record of fake objects is added as shown. Similarly every time allocation needs to be made, probability is calculated for the
VIII.
P
ERFORMANCEE
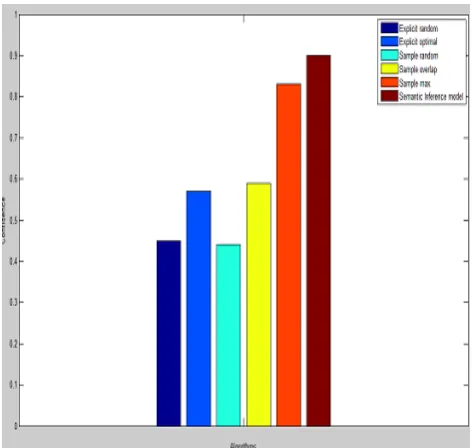
VALUATIONThe performance of our proposed model is compared with the existing system. . In this performance evaluation we are also finding how effective the approximation is. We also present the evaluation for sample requests and explicit data requests. The experimental result shows that our approach of using the semantic inference graph performs better than the existing approaches.
Fig 5. Performance Evaluation for proposed model
proposing our enhanced approach for detecting the guilty agents. In this technique we use the semantic inference model that represents the probability of possible colluding attacks from any agents to the different data allocation strategies. SIM represents dependent and semantic relationships among attributes of all the entities in the information system. In future the extension of our allocation strategies can handle agent requests in an online fashion (the presented strategies assume that there is a fixed set of agents with requests known in advance) can be implemented.
X.
A
CKNOWLEDGEMENTThe authors of this paper would thank the reviewers for their valuable comments and suggestions, which help us to improve the quality of this paper.
R
EFERENCES[1] R. Agrawal and J. Kiernan, “Watermarking Relational Databases,” Proc. 28th Int’l Conf. Very Large Data Bases (VLDB ’02), VLDB Endowment, pp. 155-166, 2006. [2] P. Buneman, S. Khanna, and W.C. Tan, “Why and Where: A
Characterization of Data Provenance,” Proc. Eighth Int’l Conf. Database Theory (ICDT ’01), J.V. den Bussche and V. Vianu, eds., pp. 316-330, Jan. 2008.
[3] P.Buneman and W.-C. Tan, “Provenance in Databases,” Proc. ACM SIGMOD, pp. 1171-1173, 2007.
[4] J.J.K.O. Ruanaidh, W.J. Dowling, and F.M. Boland, “Watermarking Digital Images for Copyright Protection,” IEE Proc. Vision, Signal and Image Processing, vol. 143, no. 4, pp. 250-256, 1996.
[5] B. Mungamuru and H. Garcia-Molina, “Privacy, Preservation and Performance: The 3 P’s of distributed Data Management,” technical report, Stanford Univ., 2008.
[6] F. Guo, J. Wang, Z. Zhang, X. Ye, and D. Li, “An Improved Algorithm to Watermark Numeric Relational Data,” Information Security Applications, pp. 138-149, Springer, 2006.
[7] F. Hartung and B. Girod, “Watermarking of Uncompressed and Compressed Video,” Signal Processing, vol. 66, no. 3, pp. 283-301, 1998.
[8] S. Jajodia, P. Samarati, M.L. Sapino, and V.S. Subrahmanian, “Flexible Support for Multiple Access Control Policies,” ACM Trans. Database Systems, vol. 26, no. 2, pp. 214-260, 2001.
[9] Y. Li, V. Swarup, and S. Jajodia, “Fingerprinting Relational Databases: Schemes and Specialties,” IEEE Trans. Dependable and Secure Computing, vol. 2, no. 1, pp. 34-45, Jan.-Mar. 2005.
[10] P. Papdimitriou and H. Garcia-Molina, “Data Leakage Detection,” technical report, Stanford Univ., 2008.
[11] P.M. Pardalos and S.A. Vavasis, “Quadratic Programming with One Negative Eigenvalue Is NP-Hard,” J. Global Optimization, vol. 1, no. 1, pp. 15-22, 1991.
32nd Int’l Conf.Very Large Data Bases (VLDB ’06), VLDB Endowment, pp. 151-162, 2006.
[15] P. Papadimitriou and H. Garcia-Molina, “Data Leakage Detection, “technical report, Stanford Univ., 2008.
[16] P.M. Pardalos and S.A. Vavasis, “Quadratic Programming with One Negative Eigen value Is NP-Hard,” J. Global Optimization, vol. 1, no. 1, pp. 15-22, 1991.
[17] W. Bender,D. Gruhl, and N.Morimoto Techniques for data hiding In Proc of the SPIE 2420 (Storage and Retrieval for Image and Video Databases III), pages 164–173, 1995. [18] S. Benjamin, B. Schwartz, and R. Cole Accuracy of ACARS
wind and temperature observations determined by collocation. Weather and Forecasting, 14:1032–1038, 1999.
[19] L. Boney, A. H. Tewfik, and K. N. Hamdy Digital watermarks for audio signals. In International Conference on Multimedia Computing and Systems, Hiroshima, Japan, June 1996. [20] C. S. Collberg and C. Thomborson.Watermarking, Tamper-
Proofing, and Obfuscation—Tools for Software Protection. Technical Report 2000-03, University of Arizona, Feb 2000. [21] I. J. Cox and M. L.Miller. A review of watermarking and the
importance of perceptual modeling. In Proc. of Electronic Imaging, February 1997.
[22] S. Craver, N.Memon, B.-L. Yeo and M. M. Yeung Resolving rightful ownerships with invisible watermarking techniques: Limitations, attacks, and implications. IEEE Journal of Selected Areas in Communications, 16(4):573–586, 1998. [23] S. Czerwinski. Digital music distribution and audio
watermarking.
[24] J.-L. Dugelay and S. Roche. A survey of current watermarking techniques. In S. Katzenbeisser and F. A. Petitcolas, editors, Information Hiding Techniques for Steganography
[25] and Digital Watermarking, chapter 6, pages 121–148. Artech House, 2000.
[26] F. Hartung and B. Girod. Watermarking of uncompressed and compressed video. Signal Processing, 66(3):283–301, 1998. [27] N. F. Johnson, Z. Duric, and S. Jajodia. Information Hiding:
Steganography and Watermarking – Attacks and Countermeasures. Kluwer Academic Publishers, 2000. [28] Joseph J. K. ´O Ruanaidh, W. J. Dowling, and F. M. Boland
Watermarking digital images for copyright protection. IEEE Proceedings on Vision, Signal and Image Processing, 143(4):250–256, 1996.
[29] S. Katzenbeisser and F. A. Petitcolas, editors. Information Hiding Techniques for Steganography and Digital Watermarking. Artech House, 2000.
[30] A. Kerckhoffs. La cryptographiemilitaire. Journal des SciencesMilitaires, 9:5–38, January 1883.
[31] E. Lander. Array of hope. Nature Genetics, 21:3–4, 1999. [32] M. Maes. Twin peaks: The histogram attack on fixed depth
image watermarks. In Proc. of the 2nd International Workshop on Information Hiding, pages 290–305. Springer- Verlag Lecture Notes in Computer Science 1525, 1998.
[33] N. Maxemchuk. Electronic document distribution. Technical Journal, AT&T Labs, September 1994.
[34] B. Schneier. Applied Cryptography. John Wiley, second edition, 1996.