Traffic Management Study
Vani A1, Sachin N S2, Yogesha S S3, Priyanka R4, Taskeen Taj H S5Asst. Professor, Department of Civil Engineering, Rajeev Institute of Technology, Hassan, Karnataka, India. 1
Student, Department of Civil Engineering, Rajeev Institute of Technology, Hassan, Karnataka, India2
Student, Department of Civil Engineering, Rajeev Institute of Technology, Hassan, Karnataka, India3
Student, Department of Civil Engineering, Rajeev Institute of Technology, Hassan, Karnataka, India4
Student, Department of Civil Engineering, Rajeev Institute of Technology, Hassan, Karnataka, India. 5
ABSTRACT: Traffic management study is a very crucial and important part of our system. We are facing problems in traffic congestions. Due to growing population density of vehicle is increasing day by day. In the present scenario traffic congestion is one of the main challenges for engineers, planners and policy makers in urban areas. The main focus of this study is aimed to collect the traffic volume data and analysis of traffic volume data. After collecting traffic volume data find the existing level of service (LOS). By using LOS ranges understand the traffic Problems, and provide the suitable measures to control the traffic congestion. such as widening the road, proper foot paths for pedestrians and also assigning the traffic signals in intersections to control the traffic flow, assigning proper place for parking and also assigning the traffic police in intersections for control the traffic congestion, changing lane width or by providing more public transport .
KEYWORDS: Level of service, peak hour, traffic flow.
I. INTRODUCTION
Traffic management with rapid urbanization cities face problems of congestion. Congestion occurs when demand for road space exceeds supply. Hence, not only to save resources but also to use available resources wisely it is necessary assess the existing traffic management and suggest measures to improve the same. In major urban areas traffic congestion is the major problem, so we need to check the traffic volume in the city and to provide suitable remedial measures. Traffic volume is defined as the number of vehicles crossing a section of road per unit time at any selected period. Traffic volume studies are conducted to collect data on the number of vehicles and/or pedestrians that pass a point on a highway facility during a specified time period. The objective of classified traffic volume count survey is to estimate traffic intensity. The classified volume counts surveys at three strategic locations have been carried out. The traffic is counted in number of vehicles by vehicle category-wise in each direction.
II. LITERATURE REVIEW
KARTHICK ET AL (2012) proposed a system to analyse the live video camera recordings to handle the traffic automatically by allotting green time to the traffic by calculating the number of vehicles which gives the traffic density which acted as a input for the algorithm which was in place for allocating optimal time for the vehicles to pass the intersection.
in addition to the sensors provided on the intersection to allocate the timings to clear off the intersection. This system was compared with ficed traffic signals and found to be more efficient
HELLINGA, B ET AL., (2008) Through this paper, authors stated that the traffic signal timing plans are typically developed on the basis of turning movement traffic and pedestrian volume counts aggregated to 15-minute intervals and obtained over a 4 or 8-hour period on a single day. These data are used to identify the peak hour and to compute the peak hour turning movement traffic volumes. They may also be used to compute the peak hour factor (PHF). Result is to control the traffic congestion in intersection by using signals.
III. OBJECTIVES
To Collect the Traffic Volume Data and analyse
To calculate the existing Level of Service (LOS).
To Determine the Traffic Problems and Provide Suitable Remedial Measures.
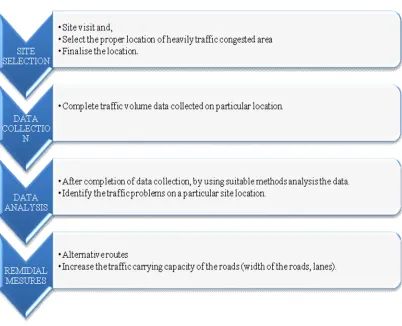
IV. METHODOLOGY
V. DATA COLLECTION AND ANALYSIS
ROAD INVENTORY SURVEY
TRAFFIC VOLUME DATA COLLECTION by manual methods: One of the fundamental measure of traffic on a road system is “The volume of traffic using the road in a given time interval” which is also termed as flow and it is expressed in vehicles per hour or vehicles per day. Usually, the traffic is composed of a number of types of vehicle each type having an influence the performance of the road in its own way.
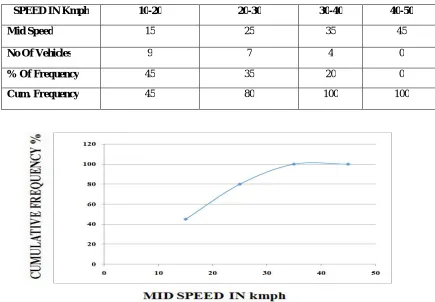
SPOT SPEED STUDY: For speed analysis in each circle by measuring 50m length on the road, at the starting point stop clock is turned on and when the vehicle reaches the 50m length at that time stopping the stop clock. This results in knowing the time taken by each vehicle to pass 50m length. By using this data the speed for approaching lane is obtained. From this available data we can plot S-curve to find out the speed of each vehicle at the intersections. The selected stretch is of 15m and 20 numbers of vehicles are selected by using random sampling technique.
TABLE 1: SPEED DATA COLLECTION
SPEED IN Kmph 10-20 20-30 30-40 40-50 Mid Speed 15 25 35 45
No Of Vehicles 9 7 4 0
% Of Frequency 45 35 20 0
Cum. Frequency 45 80 100 100
CALCULATION OF THEORITICAL CAPACITY
Theoretical capacity (C) =
Here 1000 represents capacity derived for 1 km length
V= design speed of the vehicle (85th %)
S= the spacing between c/c of the vehicle is calculated using the relation
= + L
Where represents the gap distance=0.278*V*t
L=5m t=2.5sec
TRAFFIC VOLUME DATA COLLECTION: The data should be collected at 3 study location in 5 days of the weak and analysis is done for the worst situation.
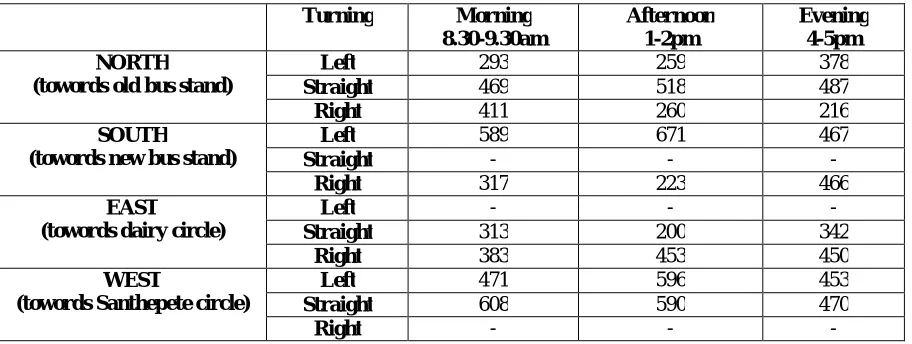
TABLE 2: TUESDAY PEAK HOURS AT N R CIRCLE Turning Morning
8.30-9.30am
Afternoon 1-2pm
Evening 4-5pm NORTH
(towords old bus stand)
Left 293 259 378
Straight 469 518 487
Right 411 260 216
SOUTH
(towords new bus stand)
Left 589 671 467
Straight - - -
Right 317 223 466
EAST (towords dairy circle)
Left - - -
Straight 313 200 342
Right 383 453 450
WEST
(towords Santhepete circle)
Left 471 596 453
Straight 608 590 470
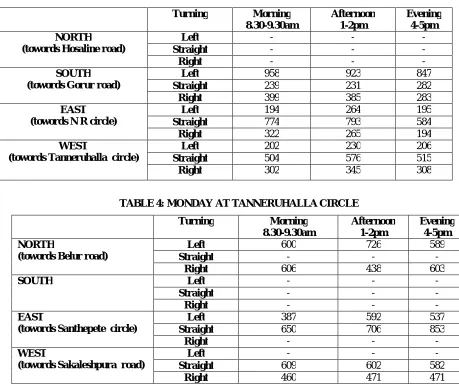
TABLE 3: TUESDAY AT SANTHEPETE CIRCLE Turning Morning
8.30-9.30am Afternoon 1-2pm Evening 4-5pm NORTH
(towords Hosaline road)
Left - - -
Straight - - -
Right - - -
SOUTH (towords Gorur road)
Left 958 923 847
Straight 239 231 282
Right 399 385 283
EAST (towords N R circle)
Left 194 264 195
Straight 774 793 584
Right 322 265 194
WEST
(towords Tanneruhalla circle)
Left 202 230 206
Straight 504 576 515
Right 302 345 308
TABLE 4: MONDAY AT TANNERUHALLA CIRCLE Turning Morning
8.30-9.30am Afternoon 1-2pm Evening 4-5pm NORTH
(towords Belur road)
Left 600 726 589
Straight - - -
Right 606 438 603
SOUTH Left - - -
Straight - - -
Right - - -
EAST
(towords Santhepete circle)
Left 387 592 537
Straight 650 706 853
Right - - -
WEST
(towords Sakaleshpura road)
Left - - -
Straight 609 602 582
Right 460 471 471
PEAK HOURS TRAFFIC VOLUME DATA ON TUESDAY AT N R CIRCLE
Fig 3Showing the directional distribution peak flow at N R circle and the details of approaching and existing volume at N R circle
Fig 4showing the directional distribution peak flow at Santhepete circle and the details of approaching and existing volume at Santhepete circle
LEVEL OF SERVICE:
By using capacity and traffic volume data find out the LOS ranges.
TABLE 5: LEVEL OF SERVICE (LOS) FOR TUESDAY
DISCRIPTION NORTH SOUTH EAST WEST N-S S-N S-N N-S E-W W-E W-E E-W Morning 8.30-9.30am - B C B B A B B
Afternoon 1-2pm -- B C B C A A B
Evening 4-5pm - B C B B A B B
TABLE 6: LEVEL OF SERVICE (LOS) RANGES FOR TUESDAY
DISCRIPTION NORTH SOUTH EAST WEST N-S S-N S-N N-S E-W W-E W-E E-W Morning 8.30-9.30am - A A C C C B B
Afternoon 1-2pm - B A C C C B B
Evening 4-5pm - A A C C B B B
TABLE 7: LEVEL OF SERVICE (LOS) RANGES FOR MONDAY
DISCRIPTION NORTH SOUTH EAST WEST N-S S-N S-N N-S E-W W-E W-E E-W Morning 8.30-9.30am B B - - B B B B
Afternoon 1-2pm B B - - B C C B
Evening 4-5pm B B - - B C C B
VI. PROBLEMS AND MITIGATIONS
Encroachment of footpath by shopkeepers and owners
Onstreet parking
Violation of traffic rules
Bus stops in the intersection zone
Absence of traffic signals to regulate the traffic movement Absence of traffic police to regulate the traffic flow
Parking or auto stand on the foothpaths
MITIGATIONS MEASURES
Footpath clearance so that pedestrian walk on the footpaths efficiently Strict enforcement measures have to be taken to follow to traffic rules
Provision on ofstreet parking
Provision of bus stops away from the intersection zone
Installation of traffic signals
Design of designated location for parking
VII. CONCLUSION
The level of service for the existing condition reflects very poor operating condition. Important issue in the existing condition are related to traffic congestion and pedestrians safety. Traffic congestion due high vehicular volume, saturated signals and conflicting movement between pedestrians and vehicles. To improve the existing condition and to provide better service to both vehicles and pedestrian several mitigations measures were suggested. The suggested measures are include:
Redesign of signals
Design of designated location for parking
Shifting of auto stand to some other location so that footpaths are utilised properly Assign the traffic police to regulate the traffic flow
Provision of bus stops away from the intersection zone
PROPOSED PROJECT
Adopting short term mitigations like redesign of signals, Assign the traffic police to regulate the traffic flow, Provision of busstops away from the intersection zone, Design of designated location for parking.
ENFORCEMENT AND CONTROLL
Unregulated pedestrian crossing to be discouraged
Stopping of vehicles after the stop line to be controlled effectively as it reduces the manoeuvere width for vehicles coming from adjacent directions.
REFERENCES
1. Nowakowski, C., Green, P., & Kojima, M. (2000). A human Factors Approach to the Design of Traffic-Information Web Sites. In “ITS America 10th Annual Meeting and Exposition: Revolutionary Thinking, Real Results”.
2. Hellinga, B., &Abdy, Z. (2008). Signalized intersection analysis and design: implications of day-to-day variability in peak-hour volumes on delay. Journal of Transportation Engineering, 134(7), 307-318.
3. king. Shilpa et al (2009) worked on a new technique “Intelligent traffic light controller” which was made by making use of GSM services as it included providing the information regarding traffic flow.
4. Radhakrishnan, P., & Mathew, T. V. (2011). Passenger car units and saturation flow models for highly heterogeneous traffic at urban signalised intersections, Transport metrical, 7(2), 141-162.
5. Karthick et al (2012) proposed a system to analyse the live video camera recordings to handle the traffic.