INVESTIGATION
Stabilizing Selection, Purifying Selection, and
Mutational Bias in Finite Populations
Brian Charlesworth1 Institute of Evolutionary Biology, School of Biological Sciences, University of Edinburgh, Edinburgh EH9 3JT, United Kingdom
ABSTRACTGenomic traits such as codon usage and the lengths of noncoding sequences may be subject to stabilizing selection rather than purifying selection. Mutations affecting these traits are often biased in one direction. To investigate the potential role of stabilizing selection on genomic traits, the effects of mutational bias on the equilibrium value of a trait under stabilizing selection in afinite population were investigated, using two different mutational models. Numerical results were generated using a matrix method for calculating the probability distribution of variant frequencies at sites affecting the trait, as well as by Monte Carlo simulations. Analytical approximations were also derived, which provided useful insights into the numerical results. A novel conclusion is that the scaled intensity of selection acting on individual variants is nearly independent of the effective population size over a wide range of parameter space and is strongly determined by the logarithm of the mutational bias parameter. This is true even when there is a very small departure of the mean from the optimum, as is usually the case. This implies that studies of the frequency spectra of DNA sequence variants may be unable to distinguish between stabilizing and purifying selection. A similar investigation of purifying selection against deleterious mutations was also carried out. Contrary to previous suggestions, the scaled intensity of purifying selection with synergisticfitness effects is sensitive to population size, which is inconsistent with the general lack of sensitivity of codon usage to effective population size.
T
HERE is an increasing interest in the evolutionary factors that shape the properties of genomes. Weak purifying selection, together with mutation and genetic drift, has often been used as the basis for evolutionary models of genomic traits such as codon usage (Li 1987; Bulmer 1991; McVean and Charlesworth 1999), intron presence and size (Lynch 2002), and the mutation rate (Lynch 2011; Sung et al.2012). This has led to the proposal that species with a low effective population size (Ne), in which selection is relatively
ineffective in relation to genetic drift and mutation (Wright 1931; Kimura 1983), are more likely than species with a highNeto evolve selectively disadvantageous properties,
such as lower codon usage bias, larger genome size, and a higher mutation rate (Lynch 2002, 2007, 2011; Sunget al.
2012). But there is noa priorireason to exclude the possibility that at least some genomic traits are subject to stabilizing
selection rather than purifying selection, so that individuals with extreme values of the trait are at a selective disadvantage compared with those with intermediate values (Kimura 1981; Johnson 1999; Parsch 2003; Wang and Yu 2011).
Evidence that quantitative traits can be subject to stabilizing selection started to accumulate over a century ago (Bumpus 1899; Weldon 1901; Di Cesnola 1907). Subsequently, Fisher (1930b, pp. 105–111) showed that mutation could maintain variability in a trait under stabilizing selection. This pioneer-ing work stimulated many later theoretical studies, reviewed by Bürger (2000). Most applications to biological problems have concerned externally measurable phenotypes, which are known to experience relatively strong selection (Haldane 1954; Kingsolver et al.2001), so that deterministic models have been commonly used in this context. Stabilizing selec-tion on genomic traits is, however, likely to be very weak, and so it is important to examine the effects of genetic drift as well as mutation, if we are to understand their behavior under stabilizing selection.
Several models of stabilizing selection on quantitative traits in finite populations have shown that the probability distribution of the trait mean is held close to the optimal value for the trait, unless the population size is far lower
Copyright © 2013 by the Genetics Society of America doi: 10.1534/genetics.113.151555
Manuscript received March 22, 2013; accepted for publication May 18, 2013 Supporting information is available online athttp://www.genetics.org/lookup/suppl/ doi:10.1534/genetics.113.151555/-/DC1.
than is usual for a natural population (Lande 1976; Campbell 1984; Barton 1989; Bürger and Lande 1994; Bürger 2000, pp. 268–282). This is because the dispersion of the mean around the optimum is controlled by the product ofNeand
the net intensity of selection on the trait (Lande 1976). This is likely to be far larger than the product ofNeand the selection
coefficientsfor a mutation at a given site in the genome—it is Nesthat controls the fixation probabilities of mutations and
the distribution of variant frequencies within a population (Wright 1931; Kimura 1983). It is thus possible for selection to be in effective control of the mean of a quantitative trait, while mutation and drift have significant effects on the fates of individual variants affecting the trait (Kimura 1981, 1983; Campbell 1984; Barton 1989).
These models tell us that a trait mean is likely to stay close to the optimum, except for small artificial populations or species on the verge of extinction. However, the models mostly assume that mutational effects on the trait are unbiased, so that the trait mean is unchanged by mutation pressure alone. This is unlikely to be true of the genomic traits mentioned above; there is, for example, evidence for a mutational bias in favor of small deletions over small in-sertions (Petrovet al.1996; Petrov and Hartl 1998; Comeron and Kreitman 2000; Ptak and Petrov 2002; Parsch 2003; Leushkin et al. 2013) and for unpreferred over preferred codons (Sharpet al.2005; Hershberg and Petrov 2008; Zeng and Charlesworth 2009; Zeng 2010).
A theoretical investigation of stabilizing selection in an infinite population has shown that the trait mean may be maintained close to the optimal value in the face of mutational bias (Waxman and Peck 2003). In contrast, it is known from the theory of mutation, drift, and selection on codon usage that mutational bias can cause the equilibrium level of codon usage bias to depart substantially from its max-imum value, if the population size is sufficiently small (Kimura 1981; Li 1987; Bulmer 1991; McVean and Charlesworth 1999). Similarly, Zhang and Hill (2008) used computer sim-ulations of the combined effects of mutational bias, genetic drift, and stabilizing selection on a quantitative trait to show that substantial deviations of the trait mean from the opti-mum can be produced when Ne is sufficiently small in
re-lation to the intensity of selection.
No systematic theoretical investigation of the interaction between stabilizing selection, mutational bias, and drift has previously been carried out. One purpose of this article is to fill this gap, by developing analytical approximations for the parameters of interest, using a method originally developed by Kimura (1981), which is related to that used in models of selection on codon usage (Li 1987; Bulmer 1991; McVean and Charlesworth 1999). The analytical results were checked by numerical modeling, using stochastic simulations as well as a matrix method similar to that employed in recent investi-gations of other modes of selection (Eyre-Walker and Keightley 2009; Zeng and Charlesworth 2009).
These methods can also be used to study the interaction between mutation pressure and weak purifying selection
against deleterious mutations, allowing for the possibility of epistasis among the fitness effects of deleterious mutations at different sites. This has potential relevance to the evolu-tion of sex and recombinaevolu-tion (Kimura and Maruyama 1966; Feldmanet al.1980; Kondrashov 1982, 1984, 1988; Charlesworth 1990), butfinite population effects have largely been neglected except for Kondrashov (1995). It has also been proposed that synonymous sites subject to selection on codon usage may be subject to synergisticfitness effects, thereby explain-ing the apparent lack of any strong relation between the effective population size of a species and its level of codon usage bias (Akashi 1995, 1996; Kondrashov et al. 2006). The reasoning is that the intensity of selection against ferred codons increases as the proportion of sites with unpre-ferred codons increases, eventually stabilizing the level of codon usage bias.
The main novel conclusion is that the scaled measure of the intensity of selection for individual sites under stabiliz-ing selection (defined here asg= 4Nes) is approximately
independent of Ne over a wide range of parameters,
pro-vided that there is sufficient mutational bias to perturb the population mean from the optimal value by a small amount, thereby creating an overall pressure of selection in the op-posite direction to the effect of mutational bias. This is be-cause a larger departure of the mean from the optimum due to a lower Ne causes an increase in the magnitude of the
selection coefficients, which can almost precisely counteract the effect of the change ofNeong.
These results mean that studies utilizing data such as the frequency spectra of DNA sequence variants may find it virtually impossible to distinguish stabilizing from purifying selection. Furthermore, there is no reason to expect a notice-able positive relation between the trait mean and Ne for
most biologically realistic values of Ne, since the deviation
of the trait mean from the optimum is usually extremely small, in contrast to the results of models of purifying selec-tion that have been used to model various aspects of genome evolution,e.g., Lynch (2002, 2007, 2011). In contrast, when there is synergistic selection against deleterious mutations,g
is a strongly increasing function ofNe; in addition, the mean
number of deleterious mutations per individual declines as
Neincreases, contradicting the idea that synergistic selection
can counteract a reduction in codon usage bias caused by lowerNe.
Models of Stabilizing Selection
Basic assumptions
a variant of type A1decreasing the trait valuezand a variant
of type A2that increases it. The scale of measurement is such
that individuals homozygous for type A1alleles at every site
have a value of –ma, and individuals homozygous for type A2alleles at every site have a value ofma. In the context of
genome evolution, for example, the trait could be the length of a collection of introns or intergenic sequences, with each variant representing an insertion or deletion of a set of bases.
It is convenient to assume a quadratic deviations model, such that thefitness of individuals with phenotypic valuezis
wðzÞ ¼12Sðz2zoÞ2; (1)
where zois the optimal value of the trait, and Sis the
in-tensity of selection (Fisher 1930b, p. 105).
For the case of very weak selection analyzed here, this is an excellent approximation to the commonly used nor-optimal selection model, where the natural logarithm of fitness is a quadratic function of the deviation from the optimum,e.g., Haldane (1954) and Lande (1976). The gen-eral conclusions should thus apply to this case.
Under the assumption that each site evolves indepen-dently within a population (i.e., there is no linkage disequi-librium), the change due to selection in the frequencyqiof
the A2allele at theith site in the system, neglecting
higher-order terms inSa2, is given by
Dqisqið12qiÞSa2ð2dþ2qi21Þ: (2)
This equation or its equivalent has been used repeatedly in the literature (e.g., Wright 1935; Barton 1986; Bürger 2000, p. 217). The parameter d measures the deviation of the population mean from the optimum, relative to the effect of a single variant, such that
d¼ðz02zÞ
a : (3)
The term in 2d in the equation represents the effect of di-rectional selection due to the deviation of the mean from the optimum, while the term in 2qi–1 represents the effect of
stabilizing selection, which tends to push the allele fre-quency toward the nearest extreme when the mean coin-cides with the optimum.
We also have the useful relation
z¼ma 2q21; (4)
whereqis the mean ofqover all sites (Bürger 2000, p. 217). Following Zhang and Hill (2008), an additional “ pleio-tropic”directional selection coefficient,sd, could be added to
2d + 2qi – 1 in Equation 2. All of the analyses described
below can be carried out with this extension of the model, with 2Sa2dbeing replaced by 2Sa2d+s
din the calculations.
If sd.0, the expected equilibrium value ofd, as given by
Equations A.3 and 12b, is reduced, but the value of the
scaled selection coefficient, as given by Equations 9 and 12a, is unchanged. This extension is not considered further.
Mutational models
Two extreme possibilities for representing the effects of mutation are considered here. First, mutations in both directions may occur at each site, with a frequency u of mutations from A1to A2and a frequencykuin the opposite
direction, wherekrepresents the extent of mutational bias. Mutation rates are thus dependent on the allelic states of sites, as is appropriate for nucleotide substitutions, such as those at sites affecting a quantitative trait. The mutational contribution to the change in frequency of type A2alleles is then
Dqim¼u2ð12kÞuqi (5)
If both mutation and selection terms are small, this can be added to Equation 2 to obtain an expression for the net allele frequency change at the ith site, Dqi = Dqis + Dqim. If the mutation rate at each site is sufficiently low,
the mutational terms need not be applied to segregating sites, yielding a model that is similar to the modifications of the infinite sites model described by Kimura (1981), McVean and Charlesworth (1999), and Charlesworth and Charlesworth (2010, pp. 268–279). This allows simple an-alytical approximations to be obtained (see below).
Alternatively, the state of a site may not restrict the direction of a future mutation. This probably applies to indels, where the presence of an insertion or deletion does not preclude a further change of the same kind. Any site can then mutate to an insertion with probabilityuand to a de-letion with probabilityku, regardless of any previous muta-tional events at that site. Since in reality successive additions or deletions of sets of bases are unlikely to involve precisely the same nucleotide site, in this model it is probably best to regard m as referring to the number of representatives of a defined class of sequences that can be affected by the indels in question, such as short introns inDrosophila. This case is referred to as the“state-independent model,”in con-trast to the alternative“state-dependent model.”It is similar to the ladder model of mutation used for electrophoretic and microsatellite loci (Ohta and Kimura 1973; Slatkin 1995), since the state of a particular location in the genome can evolve indefinitely in either direction by successive inser-tions or deleinser-tions.
Analysis of the state-dependent model: Further assumptions
variant frequencies generated by drift, mutation, and selec-tion. This implies that the mean value (q) of the frequencies of A2variants across all sites for a given population is close
to the expected value (q*) of the frequency at a random site, taken over the probability distribution of frequencies under drift, mutation, and selection. This assumption can be used to develop both numerical and analytical results. Its accu-racy is evaluated in theSupporting Information,File S1.
In addition, linkage equilibrium is assumed; simulations have shown that this provides a good approximation to exact multilocus models of stabilizing selection, provided that selection is weak in relation to recombination, and the population size is sufficiently large (Bürger 2000). For sim-plicity, a Wright–Fisher population of size N is assumed; more generally,Ncan be replaced by the effective popula-tion size,Ne(Wright 1931; Charlesworth and Charlesworth
2010, Chap. 5).
Approximate analytical results for the state-dependent model
When there is sufficient mutational bias to perturb the population mean away from the optimum, the term in 2din Equation 2 dominates over 2qi – 1 (Kimura 1981). This
means that selection on individual allele frequencies is ef-fectively directional, so that Equation 2 can be replaced by an equation of the form
Dqisqð12qÞ; (6a)
where
s¼2Sa2d: (6b)
A difficulty is that d depends on the population mean, and hence on q. However, this problem can be solved by assuming that the mutation rate is sufficiently low that an infinite-sites model can be used (i.e., we have 4Nu,,1). In this case, the approximate expected value ofq,q*, at muta-tion–selection–drift equilibrium is determined by the proba-bilities of sites beingfixed for A1and A2, defined asf(0) and f(1), respectively (Kimura 1981; Bulmer 1991).
The ratio (1–q*)/q* is thenf(0)/f(1); this is also close to the ratio (1 – q)/q for a given population (File S1). At equilibrium, the rate of flow of probability from sites with
q = 1 to sites withq= 0 must be equal to theflow in the opposite direction; theseflows are proportional tokuQ1f(1)
anduQ2f(0), respectively, whereQ1andQ2are the
probabil-ities of fixation of new A1 and A2 mutations, respectively
(Kimura 1981; Bulmer 1991; Charlesworth and Charlesworth 2010, p. 272). We then have
12q*
q*
kQ1 Q2:
(7a)
With afixed selection coefficients, the standard formula for fixation probability implies that Q1/Q2 exp(–g), where
g = 4Ns is the scaled selection coefficient (Fisher 1930a;
Charlesworth and Charlesworth, Chap. 6, p. 262).
Iffluctuations indaround its expectation over the entire probability distribution of q, denoted byd*, are sufficiently
small in relation to d*, d can be equated to d*, and s in Equations 6 can be treated as fixed and equal to 2Sa2d*.
The conditions under which this is valid are examined inFile S1. From Equation 6b, this assumption implies that g = 8NSa2d*. Substituting into Equation 7a, we have
12q*
q* k expð2gÞ: (7b)
This is equivalent to the Li–Bulmer equation used in the theory of selection on codon usage (Li 1987; Bulmer 1991). Furthermore, using Equations 3 and 4, and writing b=
zo/ma, we have
12q*
q*
½1þ ðd*=mÞ2b
½1þb2ðd*=mÞ: (8)
Useful approximations forgandd* can then be obtained, as shown in the Appendix. In particular, when 4NSma2..1,
Equations 6 and A.3b imply that
glnðkÞ þ2b: (9)
This analysis brings out the remarkable fact thatgat muta-tion–selection–drift equilibrium is approximately indepen-dent of the population size for a given set of mutation and selection parameters, at least over some of the range of possible parameter values. Ifbis small, so that the optimum is in the mid-range of possible values, g ln(k). Further-more, the argument leading to Equations A.7 of the Appen-dixshows that Equations A3 ford* can also be used for the case when there is a mixture of stabilizing and directional selection, but g= 8NSa2d* can no longer be interpreted as
the product of 4N and a fixed selection coefficient and is therefore not sufficient to determine the fixation probabili-ties of A1and A2mutations.
Equations A.3b and A.7b imply that, asNSa2increases,d*
becomes indefinitely small, consistent with previous results for very different models of mutation, which found that mutational bias has only a small effect on the population mean in a large population (Waxman and Peck 2003; Zhang and Hill 2008). Alternatively, approximate expressions for
d* andgunder the above conditions can be derived using the model of the joint effects of drift and selection on a quan-titative trait developed by Lande (1976); they give qualita-tively similar results to those obtained here, although quantitatively there is a disagreement, reflecting the differ-ent assumptions made in the two cases (see File S1). As described inFile S1, this approach also can be used to show that the expected value of the trait mean is expected to approach the optimum as NSa2 increases, even when the
Equation 9 also suggests, somewhat counterintuitively, that the values ofd* andgare nonzero ifbis nonzero, even if there is no mutational bias at the level of individual nucleotide sites (i.e., whenk= 1). This arises because a nonzerobimplies that the mean frequency of A2 at equilibrium under selection
departs from one-half; in a finite population, the frequencies of sitesfixed for A1and A2are then unequal, so that there will
be a higher net frequency of mutations from the allelic type favored by selection, effectively creating a mutational bias.
Knowingd* and henceg, we can use standard results from diffusion theory to obtain the overall probability distribution ofq
when Equations 6 hold. With reversible mutation and a Wright– Fisher population of sizeN, the probability density ofqis
fðqÞ ¼C expð2gqÞq4Nu21ð12qÞ4Nku21; (10) where C is a constant ensuring that the integral of f(q) between 0 and 1 is equal to 1 (Wright 1931).
The distribution with the infinite sites assumption is represented by the limiting value of Equation 10 as 4Nutends to zero, which is useful for calculating the theoretical value of the site frequency spectrum of variants affecting the trait in a sample from the population (McVean and Charlesworth 1999). This is described in more detail below. In addition, approximate expressions for the expected genetic variance inz(Vg*) can then be derived, as shown in theAppendix.
Numerical results for the state-dependent model
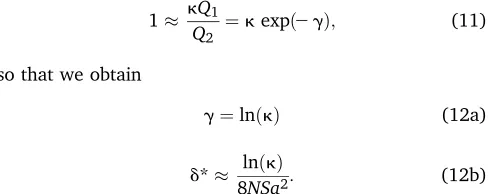
Some representative numerical results for equilibrium pop-ulations, generated as described in theAppendix, are shown in Table 1, together with approximate values ofd,g, andVg,
generated by both the first-order approximations described above (the App. 1 columns), and the more exact method described in the Appendix (the App. 2 columns), which allows for both stabilizing and directional selection effects on allele frequencies. In all cases shown, the net intensity of selection on the trait,S, was 0.01, representing weak selec-tion in relaselec-tion to the populaselec-tion sizes used here: the max-imal value ofNSwas 4 (forN= 400). If we were to scale up to a population size of 100,000 with thisNSvalue,Swould be only 4·1025, corresponding to extremely weak selection
com-pared with that normally expected for externally measurable traits (Haldane 1954; Turelli 1984; Kingsolveret al.2001). As shown above, only the productNSa2is relevant to the values of dandg, butVg* is proportional toma2(seeAppendix).
As expected from the approximate analytical results, despite very weak selection on the trait, the equilibrium value ofd* is always fairly small, even for the smallest pop-ulation size modeled here (N = 50; NS = 0.5). Both the matrix method values of d* and the mean values obtained from the stochastic simulations agree quite closely with the simple approximations in the parameter range shown in Table 1; as predicted by Equation A.3b, d* is roughly in-versely proportional to N; and the eightfold ratio between the smallest and largest Nvalues is reflected in a roughly
7.4-fold ratio of d* values. In contrast, the equilibrium g
values show only modest increases as N increases. While the simple approximation for gworks best for the smaller
Nvalues, where the correspondingly largerd* values mean that directional selection is the dominant force in Equation 2, the maximum differences from the observed values are still only of the order of 10% of the observed value even for
N = 400. The expression for g given by Equation 9 gives results very close to the App. 1 values in Table 1. Large standard deviations ofdandgare observed in the stochastic simulation results, which agree quite closely with the values predicted by Equation S1.1 inFile S1. Comparisons of nu-merical results for m= 1000 and 4000 show little differ-ences for the values of these parameters, as expected theoretically (data not shown).
The variance of the trait,Vg, provides a further test of the
utility of the approximations. These work quite well over the entire parameter range in Table 1, as does Equation 8 of Barton (1989) for the case of pure stabilizing selection. This generally good agreement, regardless of the specific assumptions, probably reflects the fact that selection is very weak in all these cases, so that the variants are close to neutrality. The expected variance in the neutral case is then the product of ma2and the expected neutral nucleotide
di-versityp; the latter is equal to 8Nuk/(1 +k) (Charlesworth and Charlesworth 2010, p. 274). The values forVg* in Table
1 are quite close to 8Nukma2/(1 + k); for example, with N = 100, k = 2, and b = 0, the neutral value is 0.053, compared with the observed value of 0.057. The standard deviations ofVgare generally much smaller in relation to the
expected values than those for the other variables, as is expected for the neutral approximation.
Approximate analytical results for the state-independent model
It is simpler to obtain approximate analytical results for this model than for the state-dependent model. When 2dis the dominant term in Equation 2, we can once again treat the problem as one of directional selection, with a scaled selec-tion coefficientg= 8NSa2din favor of A
2vs.A1variants. The
condition for statistical equilibrium is that the expected number of new A1 mutations arising each generation that
becomefixed, 2NkuQ1, is equal to the expected number of
new A2 mutations that becomefixed, 2NuQ2. Equations 7
are thus replaced by
1 kQ1
Q2 ¼
k expð2gÞ; (11)
so that we obtain
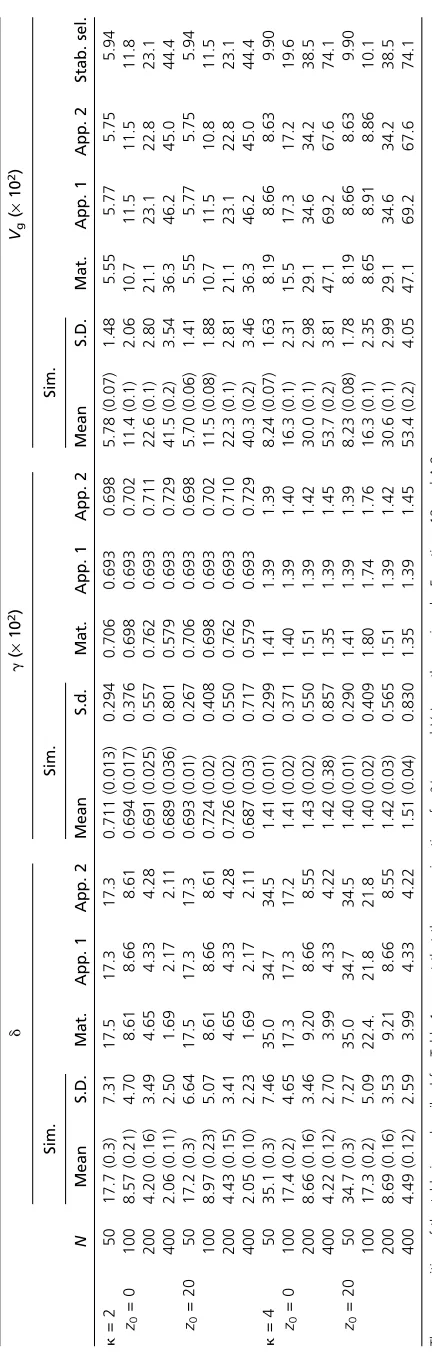
g¼lnðkÞ (12a)
d* lnðkÞ
8NSa2: (12b)
there is a mixture of stabilizing and directional selection, althoughgcan no longer be interpreted as the product of 4N
and afixed selection coefficient.
Numerical results for the state-independent model
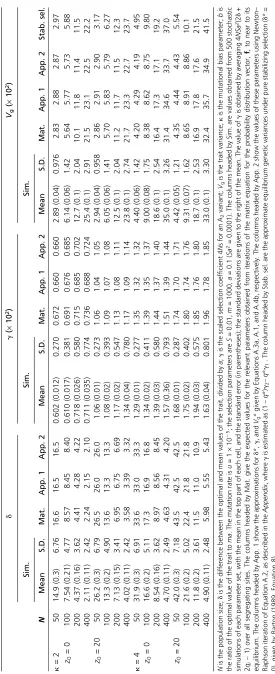
Some numerical results for this case, using the matrix and stochastic simulations methods described in the Appendix, are shown in Table 2, for parameter values that are similar to those in Table 1. The overall picture is similar to that for the state-dependent case, except that thegvalues are close to ln(k) (App. 1). The approximate results for d* and g
provide a better fit to the simulation results than do the matrix method results forN= 100 and 400. The more exact values forg, based on Newton–Raphson numerical solutions
of the equation for equilibrium (seeAppendix)fit somewhat better, except forN= 400. All the methods confirm thatd* is smaller with larger N, and the ratios of d* values for differentNvalues are close to the corresponding ratios ofN. The predictions forVg* are accurate forN= 50 andN=
100, but the first two approximations tend to overestimate
Vg* for the largerNvalues, especially for the higher level of
mutational bias, reflecting the increasing importance of the stabilizing selection component, which these approxima-tions ignore. The prediction based on Barton’s (1989) Equa-tion 8 performs even worse for these largerNvalues when
k= 4, presumably because it does not take the directional selection component into account. In this case, the state in-dependence implies that the net mutation rate is (1 +k)u, so that the neutral value ofVg* is 4Numa2(1 +k). Thisfits
the values in Table 1 quite well for N= 50 and 100, but tends to overestimateVg* for the higher values ofN,
reflect-ing the increasreflect-ing effectiveness of selection in eliminatreflect-ing deleterious variants.
Site frequency spectra
Estimates of the strength of selection on individual variants affecting a trait can be obtained from DNA sequence polymorphism data, by comparing the distribution over sites of the frequencies of individual variants (the site frequency spectrum) with the predictions of models of selection, mutation, and drift of the type described above. This has been particularly useful for estimating selection on codon usage in organisms such as bacteria and Drosophila, where alternative synonymous codons for a given amino acid can be clearly defined asa prioricandidates for being preferred or disfavored by directional selection; afixed value ofgcan then be estimated (Hartlet al.1994; Akashi 1999; Comeron and Guthrie 2005; Zeng and Charlesworth 2009; Sharp
et al. 2010). In this case, the results described in the pre-vious section suggest that essentially similar results will be obtained over a wide range of parameter space of mutation and selection parameters if the trait in question is subject to stabilizing rather than directional selection, as was origi-nally proposed by Kimura (1981, 1983, pp. 143–148).
Site frequency spectra have also been used for estimating selection on indel mutations, especially inDrosophilanoncoding
sequences, with mixed results (Comeron and Kreitman 2000; Schaeffer 2002; Ometto et al. 2005; Presgraves 2006; Leushkin et al. 2013). This raises the question of whether the model of state-independent mutations with stabilizing selection could be used for this purpose, since this mutational model is probably the simplest one that is appropriate for indels. A detailed investigation of how to estimate the param-eters of this model from polymorphism data will be the sub-ject of another article. Here, I simply point out that, under the state-independent model, a mutational bias toward deletions is consistent with a stable statistical equilibrium for sequence length only if there is stabilizing selection; this can be seen from the fact that even a small difference between the prod-ucts of the respective mutation rates andfixation probabilities between insertions and deletions will lead to indefinite evo-lution in the direction of the class with the higher product. Furthermore, if the population is at a statistical equilibrium under this model, an excess of polymorphisms that are inferred to be deletion mutations by comparison with an out-group, relative to polymorphisms inferred to be insertion mutations, necessarily implies a mutational bias toward dele-tions. Such an excess is, for example, commonly observed in data from natural populations of Drosophila (Comeron and Kreitman 2000; Schaeffer 2002; Omettoet al.2005; Presgraves 2006; Leushkinet al.2013).
Mutational bias toward deletions should thus create a directional selection pressure in favor of insertions over deletions, so that we can use the “pooled”frequency spec-trum of indels, in which the longer variant at a given loca-tion in a noncoding sequence is treated as the variant favored by selection (A2 in the above model), to estimate g, ignoring the stabilizing selection component of selection in Equation 2 as afirst approximation. In addition, under the infinite-sites assumption, the mean frequency of the A2-type
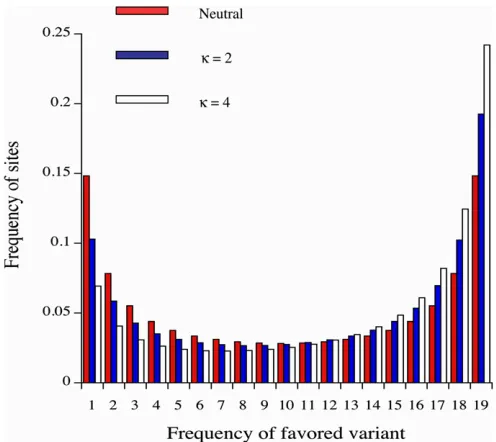
variants in a sample will exceed 0.5, if they are favored by selection, providing a nonparametric test for selection (e.g., McVean and Charlesworth 1999). Figure 1 shows the fre-quency spectra generated by the matrix calculations for two of the parameter sets shown in Table 2, for the case of a sample of 20 alleles. The departure from neutrality in the direction of a higher abundance of high-frequency A2
-type variants is clearly visible, with a greater departure from symmetry around a frequency of 0.5 with the higher level of mutational bias.
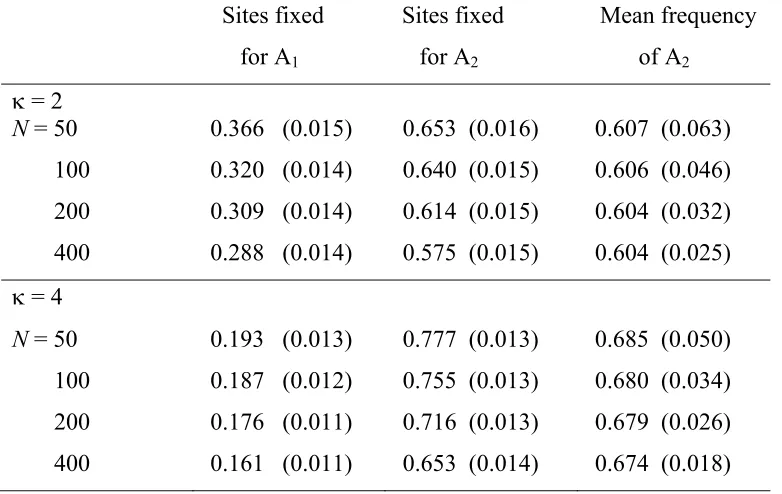
to provide significant evidence of selection; for example, in the case in Figure 1 with k= 2, the mean frequency of A2
among segregating sites is 0.606, and its standard deviation among 500 replicates is 0.046 (for more details, seeFile S1). Such failure is less likely with a larger population size and higher mutational bias, since the ratio of the mean fre-quency of A2to its standard deviation becomes larger. This
effect raises some interesting questions concerning the esti-mation ofg, which will be considered in a subsequent article.
Purifying Selection
Assumptions of the model
A similar approach can be used to study the interaction between mutation pressure and weak purifying selection in afinite population, when selection, mutation, and drift each significantly influence allele frequencies. Let the A1and A2
variants at a site represent the disfavored and favored alter-natives, respectively. If there is semidominance with respect to mutational effects on fitness, we can assume that the fitness of an individual is determined by the number of A1
variants,n=n11+ 0.5n12, wheren11is the number of sites
homozygous for A1variants andn12is the number of sites
that are heterozygous. If mating is random and qi is the
frequency of A2 at the ith site, the mean of n, n, is equal
to the sum of 2(1 – qi) over all sites. Equivalently, n =
2m(1–q), whereqis the mean ofqover allmsites. To include the possibility of epistatic interactions among the fitness effects of mutations, it is convenient to use the quadratic form
lnðwnÞ ¼ 2an2
1 2bn
2; (13)
whereaandbare constants (Kondrashov 1982; Charlesworth 1990).
Whenb= 0,fitnesses are multiplicative, and epistasis is absent on the logarithmic scale.“Synergistic epistasis”is represented by a positive value ofb; “diminishing returns” epistasis is represented by a negative value ofb. Since syn-ergistic epistasis is of the most interest in relation to the topics discussed here, numerical results are presented for this case and for multiplicative fitnesses. The latter case is essentially equivalent to the standard models of selection on codon usage (Li 1987; Bulmer 1991; McVean and Charlesworth 1999).
Approximate analytic results are derived in theAppendix
for the expected values at statistical equilibrium of the mean number of mutations per individual, the scaled selection coefficient on a mutation, and the genetic variance.
Numerical results for purifying selection
The numerical methods for this case are very similar to those used for stabilizing selection, except that now the selection coefficients in the equivalent of Equation 6a is calculated from Equation A.11b, wheren* is the product of 2mand the
mean value of (1–q) across the probability distribution of allele frequencies,f. Some results for this model are shown in Table 3, with 500 sites under selection, corresponding to the number of third coding positions in a typical human or
Drosophilagene. The upper set of results is forb= 0, cor-responding to multiplicative fitnesses (no epistasis); the middle set is for weak synergistic selection, with a value of
b chosen so that the net selection coefficients is approxi-mately the same as for b = 0; and the bottom set is for purely synergistic selection (a= 0).
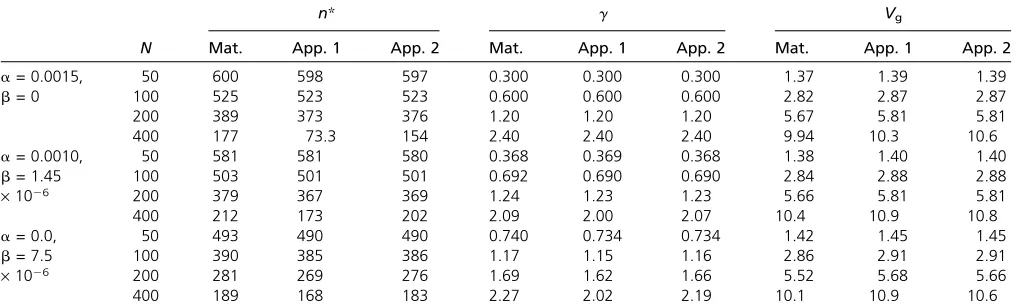
In all cases, the numerical results generated by the matrix results are quite well predicted by the two types of approximation (stochastic simulation results are not shown, due to their agreement with the other results); this is, of course, not surprising for the multiplicative case, in whichg
isfixed and equal to 4Na. As expected from the approxima-tions given above, g increases with N for the same set of selection and mutation parameters, although the ratio ofg
values for successive pairs ofNvalues is somewhat less than two with epistatic selection and becomes smaller with in-creasing N, suggesting that an asymptotic value may even-tually be approached. From the analysis of the derivative with respect toNof the approximation forggiven by Equa-tion A.14b, it would be expected that this will happen only when the expected frequency of the favored allele A2,q* =
1–n*/(2m), is close to one (this corresponds to the frequency of optimal codons for a model of selection on codon usage).
This was tested by running matrix iterations with a = 0 (giving the maximum effect of synergism) andb= 7.5·1025,
10 times the value in Table 3, bottom. By using mutation
rates that are also 10 times the values in Table 3, the system behaves as thoughNis 10 times the Table 3 values, as far as the mean and variance of n, and the value of g, are con-cerned. ForNvalues equivalent to 200, 400, 800, and 1600, the equilibrium values of q* are 0.843, 0.902, 0.937, and 0.940; the corresponding values of g are 2.35, 2.93, 3.76, and 5.51. Thus, as N increases, q* approaches 1, and g
continues to increase, at an accelerating rate. This acceler-ation is expected from Equacceler-ation A.13; if we putq* = 1–yin this equation, whenyis very small, we havegln(k) +y–
ln(y), which increases very fast asy approaches zero. This reinforces the conclusion based on the approximations of Equations A.14 that synergism does not prevent a large in-crease in the scaled strength of selection as Nincreases.
Using a similar argument to that employed for the state-dependent model of stabilizing selection, the expected variance in the number of mutations in the neutral case in this case is 8Nmuk/(1 +k). Comparison with the values for
Vgin Table 3 shows that this formula tends to slightly
under-predict the variance;e.g., for the case with b= 0 andN= 100, the neutral value is 2.67, compared with the observed value of 2.82. This probably reflects the fact that selection leads to a higher frequency of sitesfixed for A2than under
neutrality, and these have a higher rate of mutation than A1
sites.
Discussion
Biological implications of the results
A major conclusion from this work is that, in a finite population, weak stabilizing selection with mutational bias can cause a sufficient deviation of the population mean from the optimum to induce a net pressure of directional selection on the trait (see Tables 1 and 2). This agrees with the results of Zhang and Hill (2008), obtained from simulations of a reflected gamma distribution of mutational effects on a quantitative trait. While the magnitude of this deviation declines with the population size, it is generally extremely small compared with the total possible range of trait values (2ma). For example, in Table 2 withk= 4 andN= 50, the deviation of the expected mean from the optimum (ad*) is
0.1·35 = 3.5, whereas the range is 200.
Another way of looking at the size of the deviation from the optimum is to consider a genomic trait that may be under stabilizing selection, such as the total length of a set of noncoding sequences like short introns inDrosophila, for which a conservative value is 50,000 bp (Misraet al.2002).
If small insertions or deletions are associated with a typical
a value of 5 bp, consistent with what is seen inDrosophila
polymorphism data (Leushkin et al. 2013), a d* of 35 (as above) would imply that the expected mean value of the trait departs from the optimum by 5·35 bp = 175 bp (this uses the fact that the value ofd* for afixed value ofSa2is
invariant with respect to manda, for sufficiently largem). Using Equation S1.1,File S1,dhas a standard deviation due
Figure 1 Site frequency spectra in a sample of 20 alleles with a predom-inance of directional selection, from matrix iterations. The histograms show the spectra for the cases of neutrality (red bars) and stabilizing selection with state-independent mutations and two different levels of mutational bias (blue and white bars) withN= 400,S= 0.01,m= 1000,
to drift of 5·7.1 = 35 bp. The maximum probable depar-ture of the mean from the optimum is thus175 + 2·35 = 245 bp. Clearly, a deviation of this magnitude would be undetectable relative to a trait value of 5 ·104. It would
then be difficult to detect any relation between mean trait values andNin comparisons across species with differentN
values, as is done in efforts to test evolutionary hypotheses concerning genomic traits (Lynch 2007).
Nevertheless, such departures can cause a significant pressure of directional selection on individual variants, provided thatdexceeds one-half. This is because they then dominate the expression for allele frequency change relative to the contribution from the stabilizing selection term that would exist if the mean and optimum coincided. This effect allows the use of established theoretical results on the in-teraction between purifying selection, mutation, and drift, yielding useful approximate expressions for the expected values of the population mean and its departure from the optimum, the scaled directional selection parameter for an individual variant (g= 4Ns), and the genetic variance in the trait, Vg. The results can also be used to investigate the
important issue of the genetic load generated by pervasive weak selection on sites distributed throughout the genome (Kondrashov 1995), as is discussed in Charlesworth (2013). Perhaps the most striking conclusion is thatgcan remain remarkably constant over a wide range of parameter space (see Tables 1 and 2), even though the difference between the population mean and the optimum declines sharply with the population size. In the case of the state-independent mutation model, which is likely to be relevant to mutations such as insertions and deletions, the approximate predicted equilibrium value of g is given by ln(k); this prediction matches the values generated by the matrix iterations and stochastic simulations over a wide range of parameter space (Table 2). The same is true of the slightly more complex expectation for the state-dependent model, which is more appropriate for quantitative phenotypic traits or for codon usage (Table 1). This lack of sensitivity ofgtoNreflects the
fact that the directional selection component is generated by the deviation of the population mean from the optimal trait value, driven by mutational bias and drift. This deviation is expected to increase with smaller N(see Equations 9 and 12b and Tables 1 and 2), causing an increase in the intensity of stabilizing selection that approximately compensates for the reduction in Nin the productNsover a wide range of parameter space. A similar result was obtained by Cherry (1998), for a model of amino-acid sequence evolution under directional selection, but that uses an equilibrium condition similar to that in Equation 11. The validity of this is, how-ever, not clear for a system where a state-dependent muta-tional model is required.
This behavior contrasts sharply with what happens with mutation and purifying selection with a constants, whereNs
is proportional toN, as in the standard Li–Bulmer model of
selection on codon usage (Table 3, top). It also contrasts with what is found with the synergistic selection model (Equations A.14 and Table 3), where the magnitude of g
increases with Nover a wide range of parameters. Indeed,
q* in Equation A.13 is forced toward one as g increases. These results imply that synergistic selection is unlikely to account for the general lack of a relationship between the codon usage for a species and its inferred species effective population size, as has been previously proposed (Akashi 1995, 1996; Kondrashovet al.2006).
The results also have the important implication that weak stabilizing selection may be extremely difficult to distinguish from purifying selection, because the directional component of selection introduced by drift and mutational bias can be dominant, even when these forces have only very minor effects in pushing the population mean away from the optimum. The main difference from purifying selection lies in the insensitivity ofgtoNfor equilibrium populations. For mutations affecting genomic traits such as codon usage, GC content, or the lengths of nonfunctional noncoding DNA sequences such as short introns,kis likely to be in the range 2–4 in organisms such asDrosophila(Petrov and Hartl 1998;
Table 3 Parameter values with purifying selection
n* g Vg
N Mat. App. 1 App. 2 Mat. App. 1 App. 2 Mat. App. 1 App. 2
a= 0.0015, 50 600 598 597 0.300 0.300 0.300 1.37 1.39 1.39
b= 0 100 525 523 523 0.600 0.600 0.600 2.82 2.87 2.87
200 389 373 376 1.20 1.20 1.20 5.67 5.81 5.81
400 177 73.3 154 2.40 2.40 2.40 9.94 10.3 10.6
a= 0.0010, 50 581 581 580 0.368 0.369 0.368 1.38 1.40 1.40
b= 1.45 100 503 501 501 0.692 0.690 0.690 2.84 2.88 2.88
·1026 200 379 367 369 1.24 1.23 1.23 5.66 5.81 5.81
400 212 173 202 2.09 2.00 2.07 10.4 10.9 10.8
a= 0.0, 50 493 490 490 0.740 0.734 0.734 1.42 1.45 1.45
b= 7.5 100 390 385 386 1.17 1.15 1.16 2.86 2.91 2.91
·1026 200 281 269 276 1.69 1.62 1.66 5.52 5.68 5.66
400 189 168 183 2.27 2.02 2.19 10.1 10.9 10.6
Comeron and Kreitman 2000; Haag-Liautard et al. 2007; Keightley et al. 2009; Zeng 2010). Sinceg is strongly de-termined by ln(k) in the range of parameter space consid-ered here, this sets bounds on the magnitude of g that should be detected from surveys of DNA sequence variation within species, if these traits are indeed subject to stabilizing selection. The data becoming available from genome-wide resequencing studies will allow tests of these predictions, and statistical methods for fitting models of the kind de-scribed here to such data are in the process of development. Since it is usually unclear a priori whether stabilizing selection or purifying selection is operating on genomic traits, these results raise the question of whether there may be alternative explanations for the correlations with
Ne of such properties as genome size and mutation rate,
which have been used as evidence in favor of the hypothesis that the reduced efficiency of selection with relatively Ne
values may drive larger genome sizes and mutation rates (Lynch 2002, 2007, 2011; Sunget al.2012). As an example of such an alternative, many studies of species differences suggest that faster development time disfavors larger ge-nome size (Cavalier-Smith 1985; Pagel and Johnstone 1992). Development rate is correlated with smaller body size, which in turn is correlated with larger Ne (Lynch
2007), so that an apparent relation between Ne and the
genome size of a species can be generated indirectly. It is therefore interesting to note that A. thalianahas a reduced genome size relative to its outcrossing relative,A. lyrata(Hu
et al. 2011). This difference in genome size is consistent with the hypothesis that the evolution of rapid development in relation to the colonizing lifestyle ofA. thalianahas caused a shift toward a lower optimal value for the size of noncoding sequences. It is in the opposite direction to that predicted by Lynch’s models from the difference inNe between the two
species, sinceA. thalianahas the smallerNe(Qiuet al.2011).
The results also suggest that a role for stabilizing selection in causing codon usage bias, originally proposed by Kimura (1981, 1983, pp. 183–193), should be reexamined. Kimura assumed that translational efficiency is optimized by match-ing the frequencies of use of specific codons to the abundance of corresponding tRNAs, without providing a specific mecha-nism to justify this assumption. A similar idea has recently been proposed by Qian et al. (2012), who suggested that tRNA availability during translation may be rate limiting. Un-der these conditions, they show that Kimura’s conjecture is justified, using an argument that is equivalent to the ideal free distribution for foraging strategy used in behavioral ecol-ogy (Fretwell and Lucas 1970), and discuss experimental evidence that supports this model. Agasheet al.(2013) report results of experimental manipulation of codon frequencies on fitness in a bacterium that also suggest stabilizing selection, but with a different mechanistic basis.
Such a model does not, however, provide an obvious explanation for the well-documented relation between the level of expression of a gene and its codon usage bias (Hershberg and Petrov 2008). Several other biochemical
mechanisms may influence selection on codon usage (Plotkin and Kudla 2011), and their relative importance is unclear. One possibility for explaining the expression–codon usage bias relation on the basis of a stabilizing selection model is that the GC content of a message may increase its folding energy, so that GC-rich messages are tightly folded and hence obstruct translation initiation (Plotkin and Kudla 2011). Harrison and Charlesworth (2011) suggested that this process may account for the fact that, in budding yeast, highly expressed genes in GC-rich regions of the genome tend to have lower optimal codon usage than genes with equivalent levels of expression elsewhere in the genome. This effect could provide a mechanism for stabilizing selec-tion on codon usage in taxa such asDrosophila, where GC-ending codons appear to preferred by selection in opposition to mutational bias favoring AT over GC basepairs. The selec-tive forces favoring GC codons, such as greater translational efficiency, would probably be stronger for more highly expressed genes, overcoming the negative effects of GC con-tent on the folding of the message, and hence moving the optimal GC content upward.
Limitations and extensions of the models
The models described here are clearly very limited in many respects, and more general models need to be examined to determine the generality of the major conclusions. In particular, the assumption of the same mutational effects at all sites is unrealistic, as is the assumption of equal effects of variants in each direction. Similarly, the effects of relaxing assumption of a completely symmetrical selection, quadratic selection function, and the effects of close linkage among the sites under selection (e.g., Charlesworth et al. 2010) need to be examined. These investigations will almost cer-tainly require computer simulations, due to the mathemat-ical complexities involved.
Acknowledgments
I thank Nick Barton, Reinhard Bürger, Deborah Charlesworth, Isabel Gordo, Joachim Hermisson, Alexey Kondrashov, Russell Lande, Michael Lynch, David Waxman, Xu-Sheng Zhang, and an anonymous reviewer for their comments on this article. I am especially grateful to Nick Barton for pressing me to justify the approach leading to Equations 7 and 11 and for suggesting the method leading to Equations A7; I am also grateful to Reinhard Bürger and Xu-Sheng Zhang for correct-ing many confuscorrect-ing small errors. This work was supported by research grant BB/H006028/1 from the Biotechnol-ogy and Biological Sciences Research Council of United Kingdom.
Literature Cited
Akashi, H., 1995 Inferring weak selection from patterns of poly-morphism and divergence at “silent” sites in Drosophila DNA. Genetics 139: 1067–1076.
Akashi, H., 1996 Molecular evolution betweenDrosophila mela-nogaster andD. simulans: reduced codon bias, faster rates of amino-acid substitution, and larger proteins inD. melanogaster. Genetics 144: 1297–1307.
Akashi, H., 1999 Inferring the fitness effects of DNA polymor-phisms and divergence data: statistical power to detect direc-tional selection under stationarity and free recombination. Genetics 151: 221–238.
Barton, N. H., 1986 The maintenance of polygenic variation through a balance between mutation and stabilizing selection. Genet. Res. 47: 209–216.
Barton, N. H., 1989 The divergence of a polygenic system subject to stabilizing selection and drift. Genet. Res. 54: 59–77. Bulmer, M. G., 1991 The selection-mutation-drift theory of
synon-omous codon usage. Genetics 129: 897–907.
Bumpus, H. C., 1899 The elimination of the unfit as illustrated by the introduced sparrow,Passer domesticus. Biol. Lectures Woods Hole Marine Biol. Station 6: 209–226.
Bürger, R., 2000 The Mathematical Theory of Selection, Recombi-nation and Mutation, Wiley, Chichester, UK.
Bürger, R., and R. Lande, 1994 On the distribution of the mean and variance of a quantitative trait under mutation-selection-drift balance. Genetics 138: 901–912.
Campbell, R. B., 1984 The manifestation of phenotypic evolution at constituent loci. I. Stabilizing selection. Evolution 38: 1033– 1038.
Cavalier-Smith, T., 1985 Eukaryote gene numbers, non-coding DNA and genome size, pp. 69–103 inThe Evolution of Genome Size, edited by T. Cavalier-Smith. Wiley, Chichester, UK. Charlesworth, B., 1990 Mutation-selection balance and the
evo-lutionary advantage of sex and recombination. Genet. Res. 55: 199–221.
Charlesworth, B., 2013 Why we are not dead 100 times over. Evolution. (in press).
Charlesworth, B., and D. Charlesworth, 2010 Elements of Evolu-tionary Genetics. Roberts, Greenwood Village, CO.
Charlesworth, B., A. J. Betancourt, V. B. Kaiser, and I. Gordo, 2010 Genetic recombination and molecular evolution. Cold Spring Harb. Symp. Quant. Biol. 74: 177–186.
Cherry, J. L., 1998 Should we expect substitution rate to depend on population size? Genetics 150: 911–919.
Comeron, J. M., and M. Kreitman, 2000 The correlation between intron length and recombination in Drosophila: equilibrium be-tween mutational and selective forces. Genetics 156: 1175– 1190.
Comeron, J. M., and T. B. Guthrie, 2005 Intragenic Hill–Robertson interference influences selection on synonymous mutations in
Drosophila. Mol. Biol. Evol. 22: 2519–2530.
Cutter, A. D., and B. Charlesworth, 2006 Selection intensity on preferred codons correlates with overall codon usage bias in
Caenorhabitis remanei. Curr. Biol. 16: 2053–2057.
Di Cesnola, A. P., 1907 Afirst study of natural selection inHelix arbustorum(Helicogena). Biometrika 5: 387–399.
Dolgin, E. S., and B. Charlesworth, 2006 The fate of transposable elements in asexual populations. Genetics 174: 817–827. Ewens, W. J., 2004 Mathematical Population Genetics. 1.
Theoret-ical Introduction. Springer, New York.
Eyre-Walker, A., and P. D. Keightley, 2009 Estimating the rate of adaptive mutations in the presence of slightly deleterious muta-tions and population size change. Mol. Biol. Evol. 26: 2097– 2108.
Feldman, M. W., F. B. Christiansen, and L. D. Brooks, 1980 Evolution of recombination in a constant environment. Proc. Natl. Acad. Sci. USA 77: 4824–4827.
Fisher, R. A., 1930a The distribution of gene ratios for rare muta-tions. Proc. R. Soc. Edinb. 50: 205–220.
Fisher, R. A., 1930b The Genetical Theory of Natural Selection. Oxford University Press, Oxford, UK.
Fretwell, S. D., and H. J. Lucas, 1970 On territorial behavior and other factors influencing habitat distribution in birds. Acta Bio-theor. 19: 16–36.
Galtier, N., E. Bazin, and N. Bierne, 2006 GC-biased segregation of non-coding polymorphisms in Drosophila. Genetics 172: 221– 228.
Haag-Liautard, C., M. Dorris, X. Maside, S. Macaskill, D. L. Halligan
et al., 2007 Direct estimation of per nucleotide and genomic deleterious mutation rates in Drosophila. Nature 445: 82–85. Haldane, J. B. S., 1954 The measurement of natural selection.
Caryologia 6 (Suppl.): 480–487.
Harrison, R. J., and B. Charlesworth, 2011 Biased gene conver-sion affects patterns of codon usage and amino acid usage in the
Saccharomyces sensu strictogroup of yeasts. Mol. Biol. Evol. 28: 117–129.
Hartl, D. L., E. N. Moriyama, and S. A. Sawyer, 1994 Selection intensity for codon bias. Genetics 138: 227–234.
Hershberg, R., and D. A. Petrov, 2008 Selection on codon bias. Annu. Rev. Genet. 42: 287–299.
Hu, T. T., P. Pattyn, E. G. Bakker, J. Cao, J.-F. Cheng et al., 2011 TheArabidopsis lyrata genome sequence and the basis of rapid genome size change. Nat. Genet. 43: 476–483. Johnson, T., 1999 Beneficial mutations, hitchhiking and the
evo-lution of mutation rates in sexual populations. Genetics 151: 1621–1631.
Keightley, P. D., and A. Eyre-Walker, 2007 Joint inference of the distribution offitness effects of deleterious mutations and pop-ulation demography based on nucleotide polymorphism fre-quencies. Genetics 177: 2251–2261.
Keightley, P. D., M. Trivedi, M. Thomson, F. Oliver, S. Kumaret al., 2009 Analysis of the genome sequences of three Drosophila melanogaster spontaneous mutation accumulation lines. Ge-nome Res. 19: 1195–1201.
Kimura, M., 1981 Possibility of extensive neutral evolution under stabilizing selection with special reference to non-random usage of synonymous codons. Proc. Natl. Acad. Sci. USA 78: 454–458. Kimura, M., 1983 The Neutral Theory of Molecular Evolution.
Cam-bridge University Press, CamCam-bridge, UK.
Kimura, M., and T. Maruyama, 1966 The mutational load with epistatic gene interactions infitness. Genetics 54: 1303–1312. Kingsolver, J. G., H. E. Hoekstra, J. M. Hoekstra, D. Berrigan, S. N.
Vignieri et al., 2001 The strength of phenotypic selection in natural populations. Am. Nat. 157: 245–261.
Kondrashov, A. S., 1982 Selection against harmful mutations in large sexual and asexual populations. Genet. Res. 44: 325–332. Kondrashov, A. S., 1984 Deleterious mutations as an evolutionary factor. 1. The advantage of recombination. Genet. Res. 44: 199– 217.
Kondrashov, A. S., 1988 Deleterious mutations and the evolution of sexual reproduction. Nature 336: 435–440.
Kondrashov, A. S., 1995 Contamination of the genome by very slightly deleterious mutations: Why have we not died 100 times over? J. Theor. Biol. 175: 583–594.
Kondrashov, F. A., A. Y. Ogurtsov, and A. S. Kondrashov, 2006 Selection in favor of nucleotides G and C diversifies evolution rates and levels of polymorphism at mammalian synonymous sites. J. Theor. Biol. 240: 616–626.
Lande, R., 1976 Natural selection and random genetic drift in phenotypic evolution. Evolution 30: 314–334.
Li, W.-H., 1987 Models of nearly neutral mutations with particu-lar implications for non-random usage of synonymous codons. J. Mol. Evol. 24: 337–345.
Lynch, M., 2002 Intron evolution as a population-genetic process. Proc. Natl. Acad. Sci. USA 99: 6118–6123.
Lynch, M., 2007 The Origins of Genome Architecture. Sinauer, Sun-derland, MA.
Lynch, M., 2011 The lower bound to the evolution of mutation rates. Genome Biol. Evol. 3: 1107–1118.
McVean, G. A. T., and B. Charlesworth, 1999 A population ge-netic model for the evolution of synonymous codon usage: pat-terns and predictions. Genet. Res. 74: 145–158.
Misra, S., M. A. Crosby, C. J. Mungall, B. B. Matthews, K. S. Campbell
et al., 2002 Annotation of theDrosophila melanogaster eu-chromatic genome: a systematic review. Gen. Biol. 3: Re-search0083.
Ohta, T., and M. Kimura, 1973 A model of mutation appropriate to estimate the number of electrophoretically detectable alleles in afinite population. Genet. Res. 22: 201–204.
Ometto, L., W. Stephan, and D. De Lorenzo, 2005 Insertion/de-letion and nucleotide polymorphism reveal constraints in Dro-sophila melanogaster introns and intergenic regions. Genetics 169: 1521–1527.
Pagel, M., and R. A. Johnstone, 1992 Variation across species in the size of the nuclear genome supports the junk-DNA explana-tion for the C-value paradox. Proc. Biol. Sci. 249: 119–124. Parsch, J., 2003 Selective constraints on intron evolution in
Dro-sophila. Genetics 165: 1843–1851.
Petrov, D. A., and D. L. Hartl, 1998 High rate of DNA loss in the
Drosophila melanogaster and Drosophila virilisspecies groups. Mol. Biol. Evol. 15: 1562–1567.
Petrov, D. A., E. R. Lozovskaya, and D. L. Hartl, 1996 High rate of DNA loss inDrosophila. Nature 384: 346–349.
Plotkin, J. B., and G. Kudla, 2011 Synonymous but not the same: the causes and consequencs of codon bias. Nat. Rev. Genet. 12: 33–42.
Presgraves, D., 2006 Intron length evolution inDrosophila. Mol. Biol. Evol. 23: 2203–2213.
Press, W. H., S. A. Teukolsky, W. T. Vetterling, and B. P. Flannery, 1992 Numerical Recipes in Fortran: The Art of Scientific Com-puting. Cambridge University Press, Cambridge, UK.
Ptak, S. E., and D. A. Petrov, 2002 How intron splicing affects the deletion and insertion profile inDrosophila melanogaster. Genet-ics 162: 1233–1244.
Qian, W., J.-R. Yang, N. M. Pearson, C. Maclean, and J. Zhang, 2012 Balanced codon usage optimizes translational efficiency. PLoS Genet. 8: e1002603.
Qiu, S., K. Zeng, T. Slotte, S. I. Wright, and D. Charlesworth, 2011 Reduced efficacy of natural selection on codon usage bias in selfing Arabidopsis and Capsella species. Genome Biol. Evol. 3: 868–880.
Schaeffer, S. W., 2002 Molecular population genetics of sequence length diversity in the Adh region ofDrosophila pseudoobscura. Genet. Res. 80: 163–175.
Sharp, P. M., E. Bailes, R. J. Grocock, J. F. Peden, and R. E. Sockett, 2005 Variation in the strength of selected codon usage bias among bacteria. Nucleic Acids Res. 33: 1141–1153.
Sharp, P. M., L. R. Emery, and K. Zeng, 2010 Forces that influence the evolution of codon bias. Phil. Trans. R. Soc. B. 365: 1203–1212. Slatkin, M., 1995 A measure of population subdivision based on
microsatellite allele frequencies. Genetics 139: 457–462. Sung, W., M. S. Ackerman, S. F. Miller, T. G. Doag, and M. Lynch,
2012 Drift-barrier hypothesis and mutation-rate evolution. Proc. Natl. Acad. Sci. USA 109: 18488–18492.
Turelli, M., 1984 Heritable variation via mutation-selection bal-ance: Lerch’s zeta meets the abdominal bristle. Theor. Popul. Biol. 25: 138–193.
Wang, D. P., and J. Yu, 2011 Both size and GC-content of mimimal introns are selected in human populations. PLoS ONE 6: e17945. Waxman, D., and J. R. Peck, 2003 The anomalous effects of
bi-ased mutation. Genetics 164: 1615–1626.
Weldon, W. F. R., 1901 Afirst study of natural selection in Clau-silia laminata(Montagu). Biometrika 1: 109–124.
Wright, S., 1931 Evolution in Mendelian populations. Genetics 16: 97–159.
Wright, S., 1935 Evolution in populations in approximate equilib-rium. J. Genet. 30: 257–266.
Zeng, K., 2010 A simple multiallele model and its application to identifying preferred–unpreferred codons using polymorphism data. Mol. Biol. Evol. 27: 1327–1337.
Zeng, K., and B. Charlesworth, 2009 Estimating selection inten-sity on synonymous codon usage in a non-equilibrium popula-tion. Genetics 183: 651–662.
Zhang, X.-S., and W. G. Hill, 2008 The anomalous effects of biased mutation: mean-optimum deviation and apparent directional se-lection under stabilizing sese-lection. Genetics 179: 1135–1141.
Communicating editor: J. Wakeley
Appendix
Approximate solution for state-dependent mutation when directional selection dominates
It is reasonable to assume thatd*/mis close to zero, unless
Nsis very small. Using Equation 6b, writing e=d*/mand taking logarithms of the expressions in Equations 7b and 8, this implies that
lnð1þe2bÞ2lnð1þb2eÞ1g2lnðkÞ ¼0 (A.1)
For a given value ofb, bothd*andgcan be determined from Equation A.1, e.g. by Newton–Raphson iteration. A good
approximation to g can be found simply by putting e = 0 in this expression, giving
glnðkÞ þlnð1þbÞ2lnð12bÞ: (A.2)
First-order approximations to the logarithmic terms on the left-hand side of Equation A.2 yield
d* lnðkÞ þ2b
2ð1þ4NSma2Þ: (A.3a)
For many biologically realistic situations, 4NSma2..1; in
this case, Equation A.3a reduces to
d* lnðkÞ þ2b
8NSa2 : (A.3b)
The expected genetic variance inz,Vg*, is equal toma2p,
expression forpgiven by McVean and Charlesworth (1999, Equation 15), the genetic variance contributed by a single site is
ku Se
½12expð2gÞ
½1þkexpð2gÞ; (A.4a)
wheregande=d*/mare given by Equations 6b and A.3a. Summing over all sites, and using Equation A.3a, this gives
Vg*
8Nkuma2 ½lnðkÞ þ2b
ð12expð2gÞÞ
½1þkexpð2gÞ: (A.4b)
Vg* in Equation A.4b increases without limit asNincreases,
which is clearly incorrect. This reflects the fact that d* approaches zero asNincreases, so that the approximations used above break down. The approximation described in the next section avoids this problem.
Approximate solution for state-dependent mutations, with both stabilizing and directional
selection components
An approximate solution can be obtained in the following way for the case when d is so small that the stabilizing selection component of Equation 2 becomes significant. Pro-vided thatNSa2..1, so that the frequency of A
2is close to
zero or one with high probability, Equation 2 implies that the change inqidue to selection isqi(1–qi)Sa2(1+ 2d) for
sites where new mutations to A1have been introduced, and
–qi(1–qi)Sa2(1–2d) for sites where new mutations to A2
have been introduced. We can therefore obtain approxima-tions to the fixation probabilities Q1and Q2of new
muta-tions corresponding to these cases, by using the standard formula for fixation probability under directional selection (e.g., Charlesworth and Charlesworth 2010, p. 261). These are given by two scaled selection coefficientsg1–4N Sa2
(2d* + 1) (for rare A1mutations) andg24NSa2(2d*–1)
(for rare A2 mutations). These expressions are not exact,
since they ignore the dependence on allele frequency of the term (2d+ 2qi–1) in Equation 2, but numerical studies
indicate that they provide a fairly good approximation when selection is weak, as assumed here (data not shown). Equa-tion 7b is then replaced by
12q*
q*
kg1½12expð2g2Þ g2½12expð2g1Þ:
The same argument that led to Equation A.2 yields the following expression, which allows determination ofd*, and henceg1andg2, by Newton–Raphson iteration
lnð1þe2bÞ2lnð1þb2eÞ þln
g2 g1
þln
½12expð2g1
½12expð2g2Þ
2lnðkÞ ¼0:
(A.5)
Given a value ofd*, the twogvalues can be obtained from the above expressions for g1and g2. The equilibrium
vari-ance can then be calculated by combining the varivari-ances contributed by sites mutating to A1and A2, respectively, in
the proportionsq* and 1– q*, using the corresponding di-versities given by Equation B6.7.3 of Charlesworth and Charlesworth (2010, p. 278). This yields the expression
V*
g
mkuð1þb2eÞ½g121þexpð2g1Þ
Sð2meþ1Þ½12expð2g1Þ
þmuð1þe2bÞ½g221þexpð2g2Þ
Sð2me21Þ½12expð2g2Þ : (A.6a)
When the population size is sufficiently large that 2d* 1, the system approaches that of pure stabilizing selection, with bothg1andg2becoming equal tog=–4NSa2. Under
these conditions, ecan be set to 0, and Equation A.6a sim-plifies to
Vg*
mu½kð1þbÞ þ ð12bÞ½12g2expð2gÞ
S½12expð2gÞ : (A.6b)
The limit of this as Napproaches infinity is similar to the
standard expression for the variance under stabilizing selec-tion and mutaselec-tion in a infinite populaselec-tion (e.g., Charles-worth and CharlesCharles-worth 2010, p. 190).
Alternatively, an expression for the ratio Q1/Q2 in the
general case considered here can be found without making the above approximation, as suggested to me by Nick Bar-ton. Thefixation probability for a new A2mutation in a
sys-tem that obeys selection gradient dynamics, as is true in the present case (Barton 1989), is proportional to the integral between 0 and 1/(2N) of
cðqÞ ¼exp22NlnwðqÞ ¼wðqÞ22N;
wherewðqÞis the meanfitness of the population as a func-tion of the allele frequency at the locus in quesfunc-tion, holding all other allele frequencies constant (e.g., Charlesworth and Charlesworth 2010, p. 299, Equation 6A.6b). Since 1/(2N) is close to zero, it follows that the integral for a new A2
mutation is proportional to wð0Þ–2N. Similarly, the integral
for a new A1mutation is proportional to wð1Þ–2N. From
the full equation for fixation probability (Charlesworth and Charlesworth 2010, p. 299), the expressions for A1
and A2 share common constants of proportionality, so
that we have
lnQ1
Q2¼
2Nlnwð0Þ2lnwð1Þ: (A.7a)
In the present case, application of Equation 1 to a population with a specified mean and variance of z shows that, for a single locus with small effect a, we have ln wð1Þ – ln
lnQ1
Q2 28NSa 2d:
(A.7b)
This is identical in form to the expression for the special case with constant selection coefficient used to obtain Equation 7b, which assumed d* , 1/2. This means that the argument used for this case to obtain an expression for d* can be generalized, so that Equations A.3 can be used even for cases when d* , 1/2. However, in these cases, it is no longer the case that the fixation probabili-ties of A1and A2can be found from a singlegparameter,
nor can the distribution of variant frequencies be found from Equation 10.
Numerical methods for analyzing the state-dependent model
Under a Wright–Fisher model of drift, it is possible to rep-resent the transition from one generation to the next by a matrix of the type described by Zeng and Charlesworth (2009), of size (2N+ 1)·(2N+ 1), whereNis the pop-ulation size. The only substantial difference from their model is the form of the expression for Dqis in Equation 2.
The state of the population at the start of a generation is represented by a column vectorfof dimension 2N+ 1, such that the element fj represents the probability of frequency q(j) =j/(2N), wherej= 0, 1, 2, ..., 2N. Theq(j) values are then modified by selection, according to Equation 2, where the expected value ofz is obtained from Equation 4 by av-eraging [2q(j)–1]a over all values ofq(j). With reversible mutation, they are further modified for segregating sites according to Equation 4; the value of q at sites fixed for A1is changed from 0 tou, and the value ofqat sitesfixed
for A1is changed from 0 to 1–ku(Zeng and Charlesworth
2009).
This procedure assumes that the value ofd for a single population out of the ensemble of populations generated by the probability distribution of allele frequencies can be replaced by the expected value of d over this ensemble,
d*. A justification of this assumption as afirst-order
approx-imation with respect to the strength of selection on an in-dividual variant is given inFile S1.
Using binomial sampling from the allele frequencies after selection and mutation, we can write down a transition matrix A, whose element aijdescribes the probability that
a site with frequency j/(2N) at the start of the generation produces an allele frequencyi/(2N) in the next generation. This is used to premultiplyfto get a new vector,f´(for details, see Zeng and Charlesworth 2009). Successive iterations are conducted until the system approaches equilibrium.
It is only feasible to use a vector with a dimension of a few hundred to generate numerical results in a reasonable amount of time. To represent a biologically realistic pop-ulation size, it is necessary to appeal to the fact that, when all deterministic evolutionary forces are sufficiently weak that second-order terms in their magnitude are negligible,
implying that diffusion equation approximations are justi-fied, it is the products of 2Nand these magnitudes that de-termine the rate of change offwhen time is rescaled to units of 2N generations (Ewens 2004, p. 137). Thus, provided that values ofNS,Nu, etc., that are comparable with those for a natural population are used, we can make accurate inferences about the outcome of evolution from the much smaller populations that can be easily modeled. This princi-ple has been used successfully in several previous studies,
e.g., Li (1987), Dolgin and Charlesworth (2006), Keightley and Eyre-Walker (2007), Eyre-Walker and Keightley 2009), and Zeng and Charlesworth (2009); tests of several exam-ples using both the matrix method and the stochastic simu-lations described below show that it also works well here (data not shown).
The distribution of the numbers of A2vs. A1variants in
a sample ofkalleles, taken from a population with vectorf of probabilities of allele frequencies, can be obtained by applying binomial sampling conditioned on a population fre-quencyqof A2, weighting by the corresponding element off,
and summing over all possible q values, as described by Zeng and Charlesworth (2009). This gives the pooled site frequency spectrum for the sample, which can be used to test for selection (Cutter and Charlesworth 2006; Galtier
et al. 2006; Zeng and Charlesworth 2009; Sharp et al.
2010).
Stochastic simulations of a set of mfreely recombining sites were carried out using a similar model. In this case, however, a single population was followed to provide a rep-licate run. Each generation, deterministic changes in allele frequencies at each site were calculated according to Equa-tions 2 and 5. The effect of drift was modeled using a bi-nomial random number generator (Press et al. 1992), to generate a new allele frequency at each site from a binomial deviate with sample size 2N, and the postselection and mutation allele frequency as the parameter. Care was taken to ensure that populations were run for sufficient time to approach statistical equilibrium. For the smaller population sizes, this could take 4000 generations. The means, stan-dard deviations, and stanstan-dard errors of the statistics de-scribed in the main text were calculated, as well as the fractions of sites fixed for A1 and A2 in a sample of 20
alleles, and the frequency of A2in the sample, to determine
the extent to which the properties of the sample frequency spectrum varied between replicates. In addition, the fre-quency spectrum across pooled replicate runs was com-puted, for comparison with the matrix and analytical results.
Approximate solution for state-independent mutations, with both stabilizing and directional
selection components