| INVESTIGATION
Analysis of Large-Scale Mutagenesis Data To Assess
the Impact of Single Amino Acid Substitutions
Vanessa E. Gray,* Ronald J. Hause,* and Douglas M. Fowler*,†,1
*Department of Genome Sciences and†Department of Bioengineering, University of Washington, Seattle, Washington 98195
ORCID IDs: 0000-0001-8007-4891 (V.E.G.); 0000-0001-7614-1713 (D.M.F.)
ABSTRACTMutagenesis is a widely used method for identifying protein positions that are important for function or ligand binding. Advances in high-throughput DNA sequencing and mutagenesis techniques have enabled measurement of the effects of nearly all possible amino acid substitutions in many proteins. The resulting large-scale mutagenesis data sets offer a unique opportunity to draw general conclusions about the effects of different amino acid substitutions. Thus, we analyzed 34,373 mutations in 14 proteins whose effects were measured using large-scale mutagenesis approaches. Methionine was the most tolerated substitution, while proline was the least tolerated. We found that several substitutions, including histidine and asparagine, best recapitulated the effects of other substitutions, even when the identity of the wild-type amino acid was considered. The effects of histidine and asparagine substitutions also correlated best with the effects of other substitutions in different structural contexts. Furthermore, highly disruptive substitutions like aspartic and glutamic acid had the most discriminatory power for detecting ligand interface positions. Our work highlights the utility of large-scale mutagenesis data, and our conclusions can help guide future single substitution mutational scans.
KEYWORDSdeep mutational scanning; molecular biology; mutations; scanning mutagenesis
M
AKING and studying mutants is a fundamental way to learn about proteins, revealing functionally important positions, validating specific hypotheses about catalytic mech-anism, and yielding insights into protein folding and stability. Single amino acid scanning mutagenesis, in which every position in a protein is sequentially mutated to one particular amino acid, was a key advance. By searching sequence space systematically, scanning mutagenesis enabled the unbiased identification of positions and amino acid side chains important for protein function. Thefirst application of scanning mutagen-esis used alanine substitutions to identify positions in human growth hormone important for receptor binding (Cunningham and Wells 1989). Alanine was chosen because it represents a deletion of the side chain at theb-carbon. In addition to alanine, many other amino acids, including arginine (Naneviczet al. 1995), cysteine (Kanaya et al. 1990), glycine (Valbuenaet al.2003), methionine (Woodset al.1996), phenylalanine
(Borngräberet al.1999), proline (Vandemeulebrouckeet al. 2008), and tryptophan (Zhanget al.2007), have been used for scanning mutagenesis, often with a specific hypothesis in mind (e.g., that bulky amino acids are important). Nev-ertheless, some have suggested that alanine substitutions are maximally representative of the effects of other substi-tutions, or that they are especially useful for identifying functionally important positions (Bromberg and Rost 2008). Which amino acid best represents the effect of other sub-stitutions? Which substitutions are ideal forfinding function-ally important positions, such as those that participate in binding interfaces? Answering these questions is important because single amino acid scanning mutagenesis continues to be used to understand and engineer proteins. Despite the large investment in scanning mutagenesis, little work has been done to systematically compare the effects of different sub-stitutions. Some scanning mutagenesis studies compare two different types of scans (e.g., alanine and cysteine), but gen-erallyfind that the information revealed by each substitu-tion is distinct (Borngräber et al. 1999; Xiao et al.2009). Computational predictions for all substitutions at 1073 po-sitions across 48 proteins in the Alanine Scanning Energetics Database suggested that alanine substitutions correlated
Copyright © 2017 by the Genetics Society of America doi:https://doi.org/10.1534/genetics.117.300064
Manuscript received May 20, 2017; accepted for publication July 24, 2017; published Early Online July 26, 2017.
Available freely online through the author-supported open access option.
Supplemental material is available online atwww.genetics.org/lookup/suppl/doi:10. 1534/genetics.117.300064/-/DC1.
1Corresponding author: Department of Genome Sciences, University of Washington,
best with the mean effect of every mutation at each position (Bromberg and Rost 2008). However, concrete answers to these questions require comparing the empirical effects of dif-ferent substitutions in many proteins. Thus, we analyzed large-scale experimental mutagenesis data sets comprising 34,373 mutations in 14 proteins. We found that proline is the most disruptive substitution, and methionine is the most tolerated. Global and position-centric analyses revealed that histidine and asparagine substitutions best represent the effects of other substitutions, even when wild-type amino acid identity or struc-tural context is taken into account. We evaluated the utility of each amino acid substitution for determining whether a po-sition is in a ligand-binding interface, and found that highly disruptive substitutions like aspartic acid, glutamic acid, as-paragine, and glutamine performed best. Thus, our results suggest that histidine and asparagine are the most represen-tative substitutions, while aspartic acid and glutamic acid are the best choices forfinding ligand-binding interfaces.
Materials and Methods
Data curation and rescaling
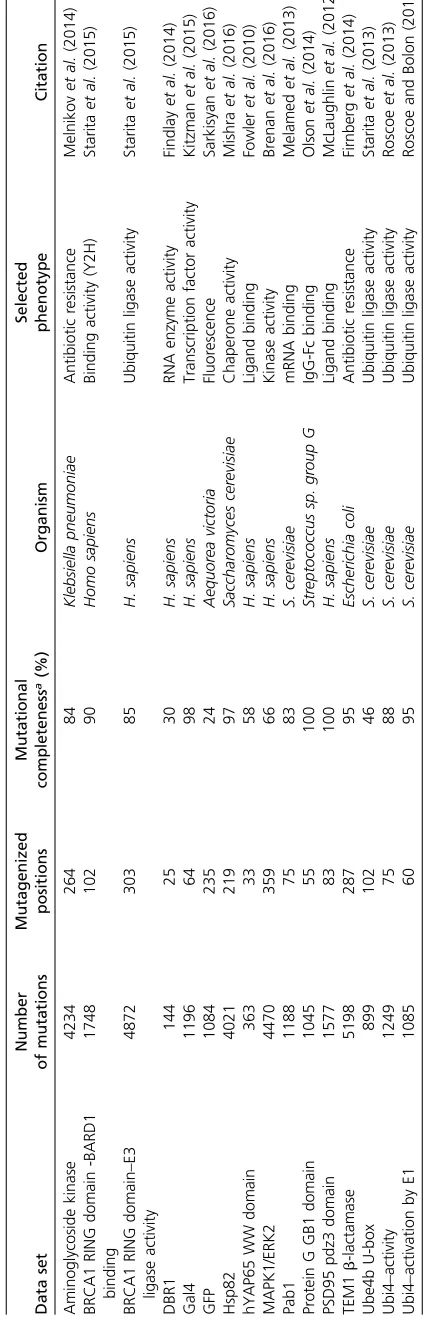
We curated a subset of the published deep mutational scan-ning data sets. We excluded deep mutational scans of non-natural proteins, because the mutational properties of non-natural and non-natural proteins could differ. The result was a set of 16 deep mutational scans of 14 proteins (Table 1). BRCA1 and UBI4 each have two large-scale mutagenesis data sets corre-sponding independent experiments in which different func-tions were assayed (e.g., ligand binding or catalytic activity). We treated these data sets separately, and did not perform any averaging of mutational effects between the data sets. Additionally, we removed any variants with more than one amino acid substitution from all the data sets.
Most of the data sets reported mutational effect scores as the log-transformed ratio of mutant frequency before and after selection, divided by wild-type frequency before and after selection. For data sets that used a different scoring scheme, we recalculated mutational effect scores as the log-transformed ratio of mutant frequency before and after selec-tion, divided by wild-type frequency before and after selection. Given that the assays used to detect mutational effect differ, we rescaled the reported mutational effect scores for each data set. First, we subtracted the median effect of synonymous muta-tions from each reported effect score, and then divided by the negative of the bottom 1% of reported effect scores. Finally, we added 1. In cases where synonymous mutational effect scores were unavailable, we omitted the synonymous score median subtraction step. Our rescaling scheme is expressed as
Si;scaled¼
Si;reported2Smedian synonymous 2Smedian bottom 1% þ1
whereSis the mutational effect score. Our normalization scheme resulted in scaled mutational effect scores where the most disruptive mutations have effect scores0 and wild-type-like Table
mutations have scores1. Unless otherwise stated, we used all of the rescaled mutational effect data for each analysis. In each analysis, we used median as a summary statistic rather than mean because the frequency distributions of muta-tional effect are bimodal rather than Gaussian (Supplemen-tal Material, Figure S1 inFile S1).
Variant annotation
DSSP was used to annotate the secondary structure and abso-lute solvent accessibility of each wild type amino acid in our data set (http://swift.cmbi.ru.nl/gv/dssp/DSSP_3.html). To esti-mate the relative solvent accessibility of amino acids, we di-vided absolute solvent accessibility as determined using DSSP by the total surface area of each amino acid. Amino acids with relative solvent accessibilities.0.2 were labeled as“surface,” whereas amino acids with relative solvent accessibilities,0.2 were labeled as“buried”(Chen and Zhou 2005).
Identification of interface positions
Four proteins in our data set had high-resolution PDB struc-tures with peptide or nucleotide ligands, Gal4 (3COQ), BRCA1 RING domain (1JM7), PSD95 pdz3 domain (1BE9), and hYAP65 WW domain (1JMQ). We determined interface positions from the literature (Marmorstein and Carey 1992; Doyleet al.1996; Fowleret al.2010; Staritaet al.2015). The interface positions in hYAP65 WW domain were 188, 190, 197, and 199. The interface positions in BRCA1 RING domain were 11, 14, 18, 93, and 96. PSD95 pdz3 domain positions were 318, 322-327, 329, 339, 372, and 379. Gal4 interface positions were 9, 15, 17, 18, 20, 21, 43, 46, and 51.
Construction of receiver-operator characteristic (ROC) curves
We constructed empirical ROC curves to illustrate the power of each substitution to discriminate between interface and noninterface positions, determined as described above. First, we defined a discrimination threshold, such that positions with a mutational effect score below the threshold were classified“interface,”and positions with a mutational ef-fect score above the threshold were classified as“ noninter-face.”For each substitution, we varied this discrimination threshold from the maximum mutational effect score to the minimum mutational effect score in 200 steps, calcu-lating the true positive interface detection rate (TPR) and false positive interface detection rate (FPR) at each step. The TPR was calculated by dividing the number of inter-face positions with scores below the mutational effect threshold by the total number of interface positions. The FPR was calculated by dividing the number of noninterface positions with scores below the mutational effect thresh-old by the total number of noninterface positions. ROC curves were constructed by plotting the TPR and FPR for each of the 200 mutational effect thresholds. The area un-der each ROC curve was determined in R using the auc() function in the pROC package (https://cran.r-project.org/ web/packages/pROC/pROC.pdf).
Data availability
The data sets used in this study came from a variety of published works (see Table 1). The curated data sets and code for generatingfigures can be found athttps://github. com/FowlerLab/.
Results
Deep mutational scanning is a method that enables measure-ment of large numbers of mutational effect in a protein simul-taneously (Fowleret al.2010; Fowler and Fields 2014). Deep mutational scanning can be used to quantify the effects of all mutations at each position in a protein, and is therefore a con-ceptual extension of single amino acid scanning mutagenesis. The application of deep mutational scanning has resulted in an explosion of protein mutagenesis data (Fowler and Fields 2014). These large-scale mutagenesis data sets create the op-portunity to assess relationships between the effects of different amino acid substitutions comprehensively.
To validate the large-scale mutagenesis data, we examined expected patterns of mutational effect. For example, muta-tions to proline should generally disrupt protein function, as proline restricts the conformation of the polypeptide back-bone and eliminates the amide hydrogen necessary for hydrogen bonding. Indeed, proline substitutions were over-whelmingly more disruptive than other substitutions to pro-tein function (Figure 1D and Figure S1B inFile S1). In fact, proline was the most disruptive substitution in 11 of 14 teins, and second most disruptive in the remaining three pro-teins (Figure 1E). Additionally, as expected from the Dayhoff (Dayhoff 1978), Blosum (Henikoff and Henikoff 1992), and Grantham (Grantham 1974) substitution matrices, tryptophan tended to be deleterious. Methionine was the best-tolerated substitution, and therefore may be useful for identifying the most immutable protein positions. Interestingly, mutations to
alanine, which is commonly employed in scanning muta-genesis, were better tolerated than many other substitu-tions. Other substitutions were also well tolerated, with seven different amino acids appearing as the most tolerated across the 14 proteins (Figure 1, D and E). Tolerance to substitutions depends on structural context, so the variabil-ity in the best-tolerated substitution might be due to diver-sity in the structural composition of each protein in our data set. Thus, the large-scale mutagenesis data sets we collected generally recapitulated our expectations about the effects of mutations, despite coming from 14 distinct proteins that were each assayed independently.
Next, we determined which amino acid substitution best represented the effects of all other substitutions. To avoid bias arising from missing data, we restricted this analysis to the 882 positions in the 14 proteins with measured effects for all
19 possible substitutions. We calculated the median muta-tional effect at each of these 882 positions. Overall, the median effects across these positions were mildly disruptive, with a mean of 0.82 (stop0, wild type 1). We found that the effects of phenylalanine, glycine, histidine, isoleucine, leu-cine, asparagine, glutamine, and tyrosine substitutions were all indistinguishable from the median effects (Figure 2A and Table S1). However, proline, aspartic acid and tryptophan substitutions were much more disruptive than the median substitution. Alanine, cysteine, methionine, serine, threo-nine, and valine were considerably less disruptive than the median substitution. These well-tolerated amino acid substi-tutions might be useful for detecting the most mutationally sensitive positions in a protein, but they are not especially representative of the effects of other substitutions.
We also examined the dispersion of each amino acid’s mutational effect about the median at all 882 positions, rea-soning that representative substitutions would have minimal dispersion. Of substitutions whose effects were indistinguish-able from the median effect, histidine and asparagine have the smallest dispersion (SD = 0.15 and 0.14, respectively; Figure 2B), while tyrosine (0.18), glutamine (0.16), phenyl-alanine (0.19), glycine (0.17), leucine (0.17), and isoleucine (0.19) all had larger dispersions. Thus, of all possible substi-tutions, histidine and asparagine tended to have effects clos-est to the median effect at the 882 positions we examined.
Next, we investigated the influence of the wild-type amino acid on the effect of each substitution at all 882 positions. Wild-type amino acid frequencies differed, so the number of mutations for each wild-type amino acid also varied. For example, we observed 1786 mutations at 94 positions where leucine was the wild-type amino acid and 114 mutations at six tryptophan positions. We found that tryptophan positions were the most sensitive to mutation (median effect = 0.48 at Trp positions), while glutamine positions were the least sensitive (median effect = 0.99 at Gln positions). For each substitution and wild-type amino acid pair, we subtracted the median effect of all substitutions at positions with the wild-type amino acid (Figure S2A inFile S1) from the me-dian effect of the substitution at those positions. A difference greater than zero denoted a substitution that was more tol-erated than the median substitution for that wild-type amino acid, while a difference less than zero denoted a more dis-ruptive substitution.
Hierarchical clustering of wild-type amino acids based on these differences revealed two major classes (Figure S2B in
File S1). The first class included large hydrophobic amino
acids, which were more sensitive to substitutions, while the second class included charged and polar amino acids, which were less sensitive to substitutions (Figure S2A inFile S1). We found that some substitutions, including histidine and asparagine, had effects close to the median substitution for most wild-type amino acids (Figure S2C inFile S1). However, histidine substitutions were less disruptive than the median substitution when the wild-type amino acid was tryptophan or tyrosine, and more disruptive than the median substitution
when the wild-type amino acid was methionine or cysteine. Meanwhile, asparagine substitutions were less disruptive when the wild-type amino acid was histidine, and more dis-ruptive when the wild-type was methionine. Other substitu-tions had more variable effects across different wild type amino acids. Thus, histidine and asparagine best represent the median mutational effect across most wild-type amino acids.
Because of the comprehensive nature of the large-scale mutagenesis data sets, we could ask how well the mutational effect scores of each substitution correlated with the scores of every other substitution at each position. Thus, we calculated Pearson correlation coefficients for the mutational effect scores of each substitution pair across all positions (Figure 2C and Figure S3 in File S1). The effects of histidine and asparagine substitutions correlated best with the effects of all other substitutions, while the effect of proline substitu-tions correlated worst. To visualize the relasubstitu-tionships between each pair of substitutions, we constructed a force-directed graph (Figure 2D). As expected, substitutions cluster by phys-icochemical type in the graph, meaning that similar substitu-tions have similar effects. Proline is not represented because its effects are poorly correlated with other substitutions. His-tidine and asparagine are connected to many other amino acids, owing to the high correlation of the effects of these substitutions with many other substitutions.
We next asked whether the secondary structural context of a position altered the effect of each substitution. We excluded DBR1 and GB1 from this analysis because they did not have structures of sufficiently close homologs. We used DSSP to identify 1007 positions in the remaining proteins that were in ana-helix, ab-sheet or a turn (Kabsch and Sander 1983). Overall, substitutions in turns were less disruptive than substitutions in a-helices or b-sheets (Figure 3A). How-ever, the relative effects of each substitution in the three structural contexts were mostly consistent, especially be-tweena-helices andb-sheets (Figure 3B and Figure S4A in File S1). Surprisingly, the tolerance for each amino acid substitution in the different secondary structural contexts was not strongly correlated with the frequency of that amino acid’s occurrence in known structures (Costantini
et al.2006). For example, alanine occurs more frequently
in a-helices, relative to b-sheets. However, in our large-scale mutagenesis data sets, alanine substitutions were mildly disruptive in both structural contexts. These obser-vations suggest that secondary structure does not dominate mutational tolerance, at least for the proteins we examined. We next investigated which substitutions were the most representative regardless of structural context. We found that histidine substitutions have close to the median effect in
of histidine, asparagine, and glutamine substitutions corre-lated best with the effects of other substitutions (Figure S4, B and C inFile S1). Thus, the effects of histidine, asparagine, and glutamine are relatively consistent in the different structural contexts we examined, highlighting the represen-tativeness of these substitutions.
An important use of single amino acid scanning is to identify positions in protein-ligand interfaces. In order to determine which substitution is ideal for that purpose, we analyzed the effects of substitutions in four proteins with ligand-bound structures: the hYAP65 WW domain, the PSD95 pdz3 domain, the BRCA1 RING domain, and GAL4. Among these four proteins there were 4884 mutations at 282 positions. We used relative solvent exposure to classify each position as either buried or on the surface. We also determined interface posi-tions based on published structures and functional studies
(seeMaterials and Methods). We found that substitutions at
interface positions were substantially more disruptive than substitutions at buried, noninterface, or surface noninterface positions (Figure 4A). This result was expected, given that all four deep mutational scans were conducted using selec-tions that depended on ligand binding. Alanine, along with phenylalanine, isoleucine, and methionine, are the least dis-ruptive amino acid substitutions at interface positions, sug-gesting that they may not be ideal for interface detection.
We reasoned that the ideal substitution for detecting protein–ligand interfaces would exhibit a large difference in mutational effect between interface and noninterface po-sitions. To formalize this idea, we used a mutational effect threshold. If a substitution at a particular position had a mutational effect below the threshold, we classified that position as “interface.”Conversely, if the mutational effect
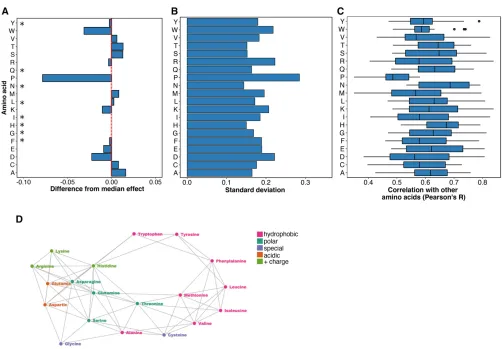
Figure 2 Histidine and asparagine substitutions best represent the effect of other substitutions. (A) For each of the 882 positions where the mutational effects of all 19 substitutions were measured, the difference from the median effect was calculated for each substitution at each position. The median of these differences across all positions for each substitution is shown, with the red line indicating a median difference of zero. A paired, two-sided Wilcoxon
rank sum test was used to determine whether each substitution’s difference from the median effect across all positions was equal to zero (*indicates
substitutions with a Bonferroni-correctedP-value.0.01;Table S1). (B) The SD of each substitution’s differences from the median effect at the 882 positions
where the mutational effects of all 19 substitutions were measured is shown. (C) For each substitution, Pearson correlation coefficients were calculated for
the mutational effects of that substitution with every other substitution at each position. The distribution of correlation coefficients for each substitution is
shown. (D) These pairwise mutational effect score correlations are also illustrated using a force directed graph. Each node represents an amino acid and
each edge force value is the Pearson correlation coefficient for the mutational effect scores of the two amino acid substitutions connected by the edge. To
reduce the density of edges, only the top 40% of Pearson correlation coefficients were included. This cutoff removed proline from the graph. Amino acids
was above the threshold that position was classified as“ non-interface.” For each substitution, we varied the mutational effect threshold from the maximum mutational effect score to the minimum effect in 200 steps. At each step, we compared the true interface positions to those determined using the mu-tational effect threshold procedure. We then constructed ROC
curves. The area under each ROC curve revealed the ability of that substitution to discriminate between true interface and noninterface positions. We found that isoleucine, lysine, and alanine had the worst discriminatory power (Figure 4B and Figure S5 inFile S1). Substitutions that were highly dis-ruptive at interfaces, like asparagine, glutamine, aspartic acid,
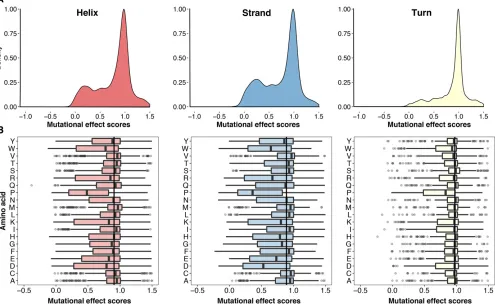
Figure 3 Secondary structural context of mutational effects. (A) Density plots describing the distribution of mutational effect scores for each substitution are
shown for three different structural contexts as determined using DSSP:a-helices (left panel,N = 8669),b-sheets (middle panel,N= 4796), and turns (right
panel,N= 3329). (B) The mutational effect score distributions for each substitution ina-helices (left panel),b-sheets (middle panel), and turns (right panel) are
shown. The vertical line in each panel represents the median effect score for all substitutions in that secondary structure type.
Figure 4 Asparagine, glutamine, aspartic acid, and glutamic acid are best for identifying positions in protein–ligand interfaces. (A) The distribution of mutational effect scores for every substitution in four proteins with ligand-bound structures [hYAP65 WW domain, PSD95 pdz3 domain, BRCA1 RING domain (BARD1 binding) and Gal4] is shown at ligand interface positions as reported in the literature, and for noninterface buried positions or
noninterface surface positions. (B) A mutational effect threshold was defined such that positions with a mutational effect below the threshold were
classified as“interface,”whereas positions with a mutational effect above the threshold were classified as“noninterface.”ROC curves for each amino
and glutamic acid, had the best discriminatory power. Next, we calculated the fraction of true interface positions detected by each amino acid substitution at a 5% false positive rate. Here, we found that asparagine and glutamine substitutions revealed over 60% of the true interface positions; aspartic acid and glutamic acid substitutions also performed well (Figure S6 in
File S1). However, alanine substitutions detected,20% of the
true interface positions at a 5% false positive rate. Thus, aspara-gine, glutamine, aspartic acid, or glutamic acid substitutions are all good choices for detecting protein–ligand interfaces.
Discussion
Single amino acid scanning mutagenesis is a widely used method for identifying protein positions that are important for function or ligand binding. Alanine is often employed, and was selected on rational grounds as it constitutes a deletion of the side chain at the
b-carbon. By analyzing tens of thousands of mutations in 14 pro-teins, we have determined that alanine is not necessarily the most revealing substitution. For example, histidine and aspara-gine substitutions have an effect close to the median, and these substitutions correlate best with the effects of all other substitu-tions. Thus, they best represent the effects of mutations gener-ally. Asparagine, glutamine, aspartic acid, and glutamic acid substitutions are highly disruptive at ligand interfaces, and are consequently the most useful substitutions for detecting ligand interface positions.
However, our conclusions are based on only 14 proteins. While these proteins are diverse in structure and function, they may not fully reflect the mutational propensities of other proteins. For example, tryptophan scanning mutagenesis is often applied to transmembrane domains (Sharpet al.1995; Depriest et al. 2011; Rasmussenet al. 2015), which were absent from the proteins we analyzed. Thus, our conclusions are most applicable to soluble proteins. Furthermore, we do not address specialized applications of single amino acid scanning mutagenesis. For example, cysteine scanning mu-tagenesis has been used to introduce disulfide bridges (Kanaya
et al.1990) and glycine scanning mutagenesis has been used
to increase conformationalflexibility (Weinglasset al.2001). Our conclusions do not apply to these situations. Finally, the deep mutational scanning data we analyzed arises from genetic selections for protein function. Biochemical assays might reveal different patterns. However, we note that a few of the large-scale mutagenesis data sets we used were benchmarked against and found to be consistent with bio-chemical assay results (McLaughlin et al. 2012; Olson
et al.2014).
Deep mutational scanning can reveal the functional con-sequences of all possible single amino acid substitutions in a protein. However, these experiments can be expensive or unwieldy. Therefore, scanning mutagenesis with one or a few amino acids will remain useful for determining functionally important positions, probing protein–ligand interactions, and answering other specific questions. Our results can be used to guide future single amino acid scanning mutagenesis
experiments, enabling selection of the amino acid best suited for the goals of the experiment.
Acknowledgments
We thank Lea Starita for helpful discussions and advice. This work was supported by the National Institute of General Medical Sciences (1R01GM109110 to D.M.F.). V.E.G. is a National Science Foundation Graduate Research Fellow (DGE-1256082) and R.J.H. is a Damon Runyon Cancer Research Foundation Fellow (DRG-2224-15).
Author contributions: D.M.F. conceived of the project. V.E.G. and R.J.H. curated and rescaled the data sets. V.E.G. and D.M.F. analyzed the data and wrote the paper.
Literature Cited
Borngräber, S., M. Browner, S. Gillmor, C. Gerth, M. Antonet al.,
1999 Shape and specificity in mammalian 15-lipoxygenase
ac-tive site. The functional interplay of sequence determinants for
the reaction specificity. J. Biol. Chem. 274: 37345–37350.
Brenan, L., A. Andreev, O. Cohen, S. Pantel, A. Kamburovet al.,
2016 Phenotypic characterization of a comprehensive set of
MAPK1/ERK2 missense mutants. Cell Rep. 17: 1171–1183.
Bromberg, Y., and B. Rost, 2008 Comprehensive in silico
muta-genesis highlights functionally important residues in proteins.
Bioinformatics 24: 207–212.
Chen, H., and H.-X. Zhou, 2005 Prediction of solvent accessibility
and sites of deleterious mutations from protein sequence.
Nu-cleic Acids Res. 33: 3193–3199.
Costantini, S., G. Colonna, and A. M. Facchiano, 2006 Amino
acid propensities for secondary structures are influenced by
the protein structural class. Biochem. Biophys. Res. Commun.
342: 441–451.
Cunningham, B. C., and J. A. Wells, 1989 High-resolution epitope
mapping of hGH-receptor interactions by alanine-scanning
mu-tagenesis. Science 244: 1081–1085.
Dayhoff, M. O., 1978 Atlas of Protein Sequence and Structure.
Na-tional Biomedical Research Foundation, Washington, DC.
Depriest, A., P. Phelan, and I. Martha Skerrett, 2011 Tryptophan
scanning mutagenesis of thefirst transmembrane domain of the
innexin Shaking-B(Lethal). Biophys. J. 101: 2408–2416.
Doyle, D. A., A. Lee, J. Lewis, E. Kim, M. Shenget al., 1996 Crystal
structures of a complexed and peptide-free membrane protein–
binding domain: molecular basis of peptide recognition by PDZ.
Cell 85: 1067–1076.
Findlay, G. M., E. A. Boyle, R. J. Hause, J. C. Klein, and J. Shendure,
2014 Saturation editing of genomic regions by multiplex
ho-mology-directed repair. Nature 513: 120–123.
Firnberg, E., J. W. Labonte, J. J. Gray, and M. Ostermeier, 2014 A
comprehensive, high-resolution map of a gene’s fitness
land-scape. Mol. Biol. Evol. 31: 1581–1592.
Fowler, D. M., and S. Fields, 2014 Deep mutational scanning: a
new style of protein science. Nat. Methods 11: 801–807.
Fowler, D. M., C. L. Araya, S. J. Fleishman, E. H. Kellogg, J. J.
Stephany et al., 2010 High-resolution mapping of protein
sequence-function relationships. Nat. Methods 7: 741–746.
Grantham, R., 1974 Amino acid difference formula to help
ex-plain protein evolution. Science 185: 862–864.
Henikoff, S., and J. G. Henikoff, 1992 Amino acid substitution
matrices from protein blocks. Proc. Natl. Acad. Sci. USA 89:
Kabsch, W., and C. Sander, 1983 Dictionary of protein secondary structure: pattern recognition of hydrogen-bonded and
geomet-rical features. Biopolymers 22: 2577–2637.
Kanaya, E., S. Kanaya, and M. Kikuchi, 1990 Introduction of a
non-native disulfide bridge to human lysozyme by cysteine scanning
mutagenesis. Biochem. Biophys. Res. Commun. 173: 1194–1199.
Kitzman, J. O., L. M. Starita, R. S. Lo, S. Fields, and J. Shendure,
2015 Massively parallel single-amino-acid mutagenesis. Nat.
Methods 12: 203–206.
Magrane, M. UniProt Consortium, 2011 UniProt Knowledgebase:
a hub of integrated protein data. Database 2011: bar009.
Marmorstein, R., and M. Carey, 1992 DNA recognition by GAL4:
structure of a protein-DNA complex. Nature 356: 408–414.
McLaughlin, Jr., R. N., F. J. Poelwijk, A. Raman, W. S. Gosal, and R.
Ranganathan, 2012 The spatial architecture of protein
func-tion and adaptafunc-tion. Nature 491: 138–142.
Melamed, D., D. L. Young, C. E. Gamble, C. R. Miller, and S.
Fields, 2013 Deep mutational scanning of an RRM domain
of theSaccharomyces cerevisiaepoly(A)-binding protein. RNA
19: 1537–1551.
Melnikov, A., P. Rogov, L. Wang, A. Gnirke, and T. S. Mikkelsen,
2014 Comprehensive mutational scanning of a kinasein vivo
reveals substrate-dependent fitness landscapes. Nucleic Acids
Res. 42: 1–8.
Mishra, P., J. M. Flynn, T. N. Starr, and D. N. A. Bolon, 2016 Systematic
mutant analyses elucidate general and client-specific aspects of
Hsp90 function. Cell Rep. 15: 588–598.
Nanevicz, T., M. Ishii, L. Wang, M. Chen, J. Chen et al.,
1995 Mechanisms of thrombin receptor agonist specificity.
Chimeric receptors and complementary mutations identify an
agonist recognition site. J. Biol. Chem. 270: 21619–21625.
Olson, C. A., N. C. Wu, and R. Sun, 2014 A comprehensive
bio-physical description of pairwise epistasis throughout an entire
protein domain. Curr. Biol. 24: 2643–2651.
Rasmussen, T., A. Rasmussen, S. Singh, H. Galbiati, M. D. Edwards et al., 2015 Properties of the mechanosensitive channel MscS pore revealed by tryptophan scanning mutagenesis.
Biochemis-try 54: 4519–4530.
Roscoe, B. P., and D. N. A. Bolon, 2014 Systematic exploration of
ubiquitin sequence, E1 activation efficiency, and experimental
fitness in yeast. J. Mol. Biol. 426: 2854–2870.
Roscoe, B. P., K. M. Thayer, K. B. Zeldovich, D. Fushman, and D.
N. A. Bolon, 2013 Analyses of the effects of all ubiquitin point
mutants on yeast growth rate. J. Mol. Biol. 425: 1363–1377.
Sarkisyan, K. S., D. A. Bolotin, M. V. Meer, D. R. Usmanova, A. S.
Mishinet al., 2016 Localfitness landscape of the greenfl
uo-rescent protein. Nature 533: 397–401.
Sharp, L. L., J. Zhou, and D. F. Blair, 1995 Tryptophan-scanning
mutagenesis of MotB, an integral membrane protein essential for
flagellar rotation inEscherichia coli. Biochemistry 34: 9166–9171.
Starita, L. M., J. N. Pruneda, R. S. Lo, D. M. Fowler, H. J. Kimet al.,
2013 Activity-enhancing mutations in an E3 ubiquitin ligase
identified by high-throughput mutagenesis. Proc. Natl. Acad.
Sci. USA 110: 1263–1272.
Starita, L. M., D. L. Young, M. Islam, J. O. Kitzman, J. Gullingsrud et al., 2015 Massively parallel functional analysis of BRCA1
RING domain variants. Genetics 200: 413–422.
Valbuena, J. J., R. Vera, J. García, A. Puentes, H. Curtidor et al.,
2003 Plasmodium falciparum normocyte binding protein
(PfNBP-1) peptides bind specifically to human erythrocytes.
Peptides 24: 1007–1014.
Vandemeulebroucke, A., S. De Vos, E. Van Holsbeke, J. Steyaert,
and W. Versées, 2008 Aflexible loop as a functional element
in the catalytic mechanism of nucleoside hydrolase from
Trypa-nosoma vivax. J. Biol. Chem. 283: 22272–22282.
Weinglass, A. B., I. N. Smirnova, and H. R. Kaback, 2001 Engineering
conformational flexibility in the lactose permease of
Escheri-chia coli: use of glycine-scanning mutagenesis to rescue mutant
Glu325/Asp. Biochemistry 40: 769–776.
Woods, A. C., J. G. Guillemette, J. C. Parrish, M. Smith, and C. J.
Wallace, 1996 Synergy in protein engineering. Mutagenic
ma-nipulation of protein structure to simplify semisynthesis. J. Biol.
Chem. 271: 32008–32015.
Xiao, Y., S. R. Wigneshweraraj, R. Weinzierl, Y.-P. Wang, and M.
Buck, 2009 Construction and functional analyses of a
compre-hensive sigma54 site-directed mutant library using
alanine-cysteine mutagenesis. Nucleic Acids Res. 37: 4482–4497.
Zhang, L., L. Wang, Y.-T. Kao, W. Qiu, Y. Yanget al., 2007 Mapping
hydration dynamics around a protein surface. Proc. Natl. Acad. Sci.
USA 104: 18461–18466.