Open Access
Vol 11 No 6Research
Variation in the PaO
2
/FiO
2
ratio with FiO
2
: mathematical and
experimental description, and clinical relevance
Dan S Karbing
1, Søren Kjærgaard
2, Bram W Smith
1, Kurt Espersen
3, Charlotte Allerød
1,2,
Steen Andreassen
1and Stephen E Rees
11Center for Model-based Medical Decision Support, Department of Health Science and Technology, Aalborg University, Fredrik Bajers Vej 7, E4-215,
DK-9220 Aalborg East, Denmark
2Anaesthesia and Intensive Care, Region North Jutland, Aalborg Hospital, Aarhus University, DK-9000 Aalborg, Denmark 3Department of Intensive Care, Rigshospitalet, University of Copenhagen, DK-2100 Copenhagen East, Denmark
Corresponding author: Dan S Karbing, [email protected]
Received: 2 Aug 2007 Revisions requested: 8 Sep 2007 Revisions received: 2 Oct 2007 Accepted: 7 Nov 2007 Published: 7 Nov 2007
Critical Care 2007, 11:R118 (doi:10.1186/cc6174)
This article is online at: http://ccforum.com/content/11/6/R118 © 2007 Karbing et al., licensee BioMed Central Ltd.
This is an Open Access article distributed under the terms of the Creative Commons Attribution License (http://creativecommons.org/licenses/by/ 2.0), which permits unrestricted use, distribution, and reproduction in any medium, provided the original work is properly cited.
Abstract
Introduction Previous studies have shown through theoretical analyses that the ratio of the partial pressure of oxygen in arterial blood (PaO2) to the inspired oxygen fraction (FiO2) varies with
the FiO2 level. The aim of the present study was to evaluate the relevance of this variation both theoretically and experimentally using mathematical model simulations, comparing these ratio simulations with PaO2/FiO2 ratios measured in a range of
different patients.
Methods The study was designed as a retrospective study using data from 36 mechanically ventilated patients and 57 spontaneously breathing patients studied on one or more occasions. Patients were classified into four disease groups (normal, mild hypoxemia, acute lung injury and acute respiratory distress syndrome) according to their PaO2/FiO2 ratio. On each
occasion the patients were studied using four to eight different FiO2 values, achieving arterial oxygen saturations in the range
85–100%. At each FiO2 level, measurements were taken of
ventilation, of arterial acid–base and of oxygenation status. Two mathematical models were fitted to the data: a one-parameter 'effective shunt' model, and a two-parameter shunt and
ventilation/perfusion model. These models and patient data were used to investigate the variation in the PaO2/FiO2 ratio with
FiO2, and to quantify how many patients changed disease
classification due to variation in the PaO2/FiO2 ratio. An F test was used to assess the statistical difference between the two models' fit to the data. A confusion matrix was used to quantify the number of patients changing disease classification.
Results The two-parameter model gave a statistically better fit to patient data (P < 0.005). When using this model to simulate variation in the PaO2/FiO2 ratio, disease classification changed
in 30% of the patients when changing the FiO2 level.
Conclusion The PaO2/FiO2 ratio depends on both the FiO2
level and the arterial oxygen saturation level. As a minimum, the FiO2 level at which the PaO2/FiO2 ratio is measured should be defined when quantifying the effects of therapeutic interventions or when specifying diagnostic criteria for acute lung injury and acute respiratory distress syndrome. Alternatively, oxygenation problems could be described using parameters describing shunt and ventilation/perfusion mismatch.
Introduction
The ratio of the partial pressure of oxygen in arterial blood (PaO2) to the inspired oxygen fraction (FiO2) has been used to quantify the degree of abnormalities in pulmonary gas exchange. The ratio has been used in numerous experimental studies to quantify pulmonary gas exchange before and after
therapeutic intervention (for example [1-3]). The PaO2/FiO2 ratio has also been used in the clinical setting to classify patients' pulmonary gas exchange status, including the defini-tions of acute lung injury (ALI) (27 kPa ≤ PaO2/FiO2 < 40 kPa) and of adult respiratory distress syndrome (ARDS) (PaO2/
FiO2 < 27 kPa) [4,5].
ALI = acute lung injury; ARDS = acute respiratory distress syndrome; ΔPO2 = drop in oxygen pressure from the ventilated alveoli to the mixed blood leaving the lung capillaries oxygen; fA2 = fraction of ventilation to a compartment receiving 90% of nonshunted perfusion; FiO2 = inspired oxygen
Critical Care Vol 11 No 6 Karbing et al.
Despite its widespread use, the validity of the PaO2/FiO2 ratio
as a tool for assessing pulmonary gas exchange has been questioned. Using mathematical models describing gas exchange, previous authors have simulated values of the PaO2/FiO2 ratio and have shown them to vary with the FiO2 level [6-8]. These theoretical analyses could lead us to believe that the PaO2/FiO2 ratio is a poor indicator of a patient's pul-monary gas exchange status in the clinic. This hypothesis is only true, however, if the simulations performed are indeed able to describe measured variations in the PaO2/FiO2 ratio, and if these variations happen within interesting ranges of FiO2. The latter of these conditions is crucial in determining whether this ratio is a useful scientific and clinical parameter.
The ability of a particular simulation to accurately describe var-iation in the PaO2/FiO2 ratio depends upon the complexity of
the mathematical models used. Gowda and Klocke [7] used the complex mathematical model included in the multiple inert gas elimination technique [9] to simulate changes in the PaO2/
FiO2 ratio on varying FiO2 levels. This complex model has the advantage of describing pulmonary gas exchange accurately; however, its complexity means that the model is not useful for describing an individual patient in the intensive care unit. Aboab and colleagues used a simple mathematical model where an 'effective' pulmonary shunt was used to describe all ventilation/perfusion (V/Q) abnormalities in the lung [6]. This model has the advantage that values of 'effective shunt' can be estimated from clinical data. Values of 'effective shunt', how-ever, are well known to vary with FiO2, as shown previously [10]. A single fixed value of 'effective shunt' may therefore not be able to simulate changes in the PaO2/FiO2 ratio accurately.
Mathematical models have been proposed recently that describe the gas exchange using two parameters: a shunt value, and a second parameter describing the V/Q ratio [11,12]. These parameter values can be estimated simply and noninvasively in the clinic [13], and have been shown to fit data from a range of mechanically ventilated patients and spontane-ously breathing patients [14-16]. These models and tech-niques therefore provide tools that can both describe pulmonary gas exchange in the individual patient and poten-tially simulate changes in the PaO2/FiO2 ratio.
The purpose of the present article is to assess the relevance of variation in the PaO2/FiO2 ratio with the FiO2 level. To do so, we determined whether changes in the PaO2/FiO2 ratio can
be described accurately by either the 'effective shunt' model or a two-parameter model describing shunt and V/Q mismatch. Unlike previous studies that have examined changes in the PaO2/FiO2 ratio with FiO2 theoretically through model simula-tion [6-8], the present analysis is performed both theoretically and experimentally by comparing model simulations with measured values of the PaO2/FiO2 ratio in a range of different patients. Simulations of the PaO2/FiO2 ratio performed with
the two-parameter model are compared with those using the
'effective shunt' model to investigate whether the extra com-plexity of the two-parameter model is justified. The models are then used to simulate whether, and under which conditions, the PaO2/FiO2 ratio varies with FiO2, to further investigate the discrepancies between the two models and whether such var-iation is clinically relevant.
Materials and methods
Data were collected from 93 patients, most of these data being published previously [11,14,15]. Patients included postoperative surgical patients following gynaecological laparotomy [11,14] and cardiac surgery [14,15], those patients receiving intensive care therapy [14], normal subjects [14] and patients suffering from cardiac incompensation [14]. Twenty-eight of these patients were mechanically ventilated and presented in the intensive care unit; the remaining 57 patients were breathing spontaneously. Some patients were studied on more than one occasion, giving a total of 120 patient cases. In addition, new data from a further eight mechanically ventilated intensive care patients studied at one or two positive end-expiratory pressure settings were included in the analysis, adding 14 additional patient cases – giving a total of 134 patient cases. All intensive care patients had dis-orders in pulmonary gas exchange either due to primary infec-tious involvement or due to a secondary pulmonary involvement as a consequence of severe sepsis or septic shock. Ethical approval was obtained from the relevant ethics committee for all studies, and informed written and oral con-sent was obtained for all patients.
On each occasion patients were studied using four to eight different FiO2 values, achieving arterial oxygen saturation
(SaO2) values in the range 85–100%. The FiO2 values were
selected on a patient-specific basis to cover this range, mean-ing that patients with more severe pulmonary disorders received higher FiO2 levels. Steady state was achieved at each FiO2 level either by waiting 5 minutes or by the presence of a stable end-tidal oxygen fraction over a 30-second period [13]. At steady-state conditions, measurements were taken of ventilation (FiO2, end-tidal oxygen fraction), of end-tidal carbon
dioxide fraction, tidal volume, and respiratory frequency, and of arterial acid–base and oxygenation status (SaO2, PaO2, pH, partial pressure of carbon dioxide, haemoglobin, methaemo-globin, and carboxyhaemoglobin). In some patients it was nec-essary to administer subatmospheric oxygen fractions to achieve SaO2 in the range 85–90%, which was achieved by
mixing nitrogen with air in the inspiratory gas. In 18 experi-ments where all patients were breathing spontaneously, arte-rial blood gases were only measured at two levels of FiO2.
Mathematical models
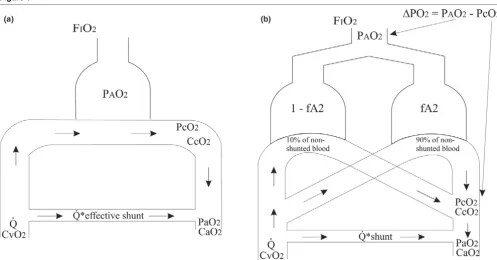
The data were analysed using two mathematical models of gas exchange: the 'effective shunt' model, used by Aboab and col-leagues [6]; and the two-parameter model [11,13,14], the equations of which have been published previously ([14] elec-tronic supplement). Figure 1 illustrates how these models dif-fer in their representation of pulmonary gas exchange. The 'effective shunt' model includes one ideally ventilated and per-fused alveolar compartment plus a compartment representing pulmonary shunt. The two-parameter model includes two alve-olar compartments incorporating V/Q inequality with the addi-tion of a shunt compartment.
In the 'effective shunt' model, oxygenation problems are described by a single parameter ('effective shunt') quantifying the blood flowing through the lungs without being oxygenated. In the two-parameter model, a shunt parameter is included along with the parameter fA2 describing the fraction of venti-lation to a compartment receiving 90% of nonshunted per-fusion. An fA2 value of 0.9 gives ideal V/Q matching, while lower fA2 values indicate V/Q mismatching. An fA2 value can be transformed into a ΔPO2 value, which describes the drop in
oxygen pressure from the ventilated alveoli to the mixed blood leaving the lung capillaries; that is, the value in blood prior to the mixing of shunt. As such, ΔPO2 describes the extra oxygen
pressure required at the mouth to remove an oxygenation
problem due to V/Q mismatch; that is, ΔPO2 = 20 kPa means
air plus 20% inspired oxygen (FiO2 = 0.41) is required.
Mathematical model simulations and statistical analysis The 'effective shunt' model and the two-parameter model were used in three ways.
A theoretical comparison was performed between model sim-ulations of changes in SaO2 and the PaO2/FiO2 ratio with
var-iation in FiO2 using the two mathematical models. To do so, simulations were performed for different values of model parameters.
The models were fitted to the data from each patient in turn using the least-squares method, and the root mean square of the residuals was calculated for each of the fits. Model fits were illustrated by plotting simulated and measured values of SaO2 and the PaO2/FiO2 ratio versus FiO2. A statistical com-parison of the 'goodness' of fit of the two models to the data was performed using an F test [17].
[image:3.612.57.554.91.351.2]Both models were then used to analyse the variation in the PaO2/FiO2 ratio over a range of FiO2 levels. This analysis had two aims: first, to evaluate the significance of any difference between the two models when fitted to the data; and second, to investigate whether the simulated variation in the PaO2/ Figure 1
Mathematical models of pulmonary gas exchange
Mathematical models of pulmonary gas exchange. (a) The 'effective shunt' model. (b) The two-parameter shunt and ventilation/perfusion mismatch model. Data describing oxygen transport in the models are indicated: oxygen partial pressure in alveolar air (PAO2), oxygen partial pressure in
capil-lary blood (PcO2), oxygen partial pressure in arterial blood (PaO2), concentration of oxygen in venous blood (CvO2), concentration of oxygen in
Critical Care Vol 11 No 6 Karbing et al.
FiO2 ratio was relevant. The relevant range was defined on an
individual patient basis as the FiO2 range that resulted in a sim-ulated value of SaO2 within the range 92–98%. The variation
in the PaO2/FiO2 ratio was then used to quantify the number of patients changing disease classification as a result of vary-ing FiO2 levels according to the two models across the
defined FiO2 range, these results being presented in a confu-sion matrix [18]. Patients were classified into disease groups at the lowest and highest FiO2 level in the range, according to
the following criteria: ARDS (PaO2/FiO2 < 27 kPa) [4,5], ALI (27 kPa ≤ PaO2/FiO2 < 40 kPa) [4,5], and normal (PaO2/FiO2
> 47 kPa) [19]. Those patients falling outside these categories are defined here as having mild hypoxemia (40 kPa ≤ PaO2/ FiO2 < 47 kPa).
Results
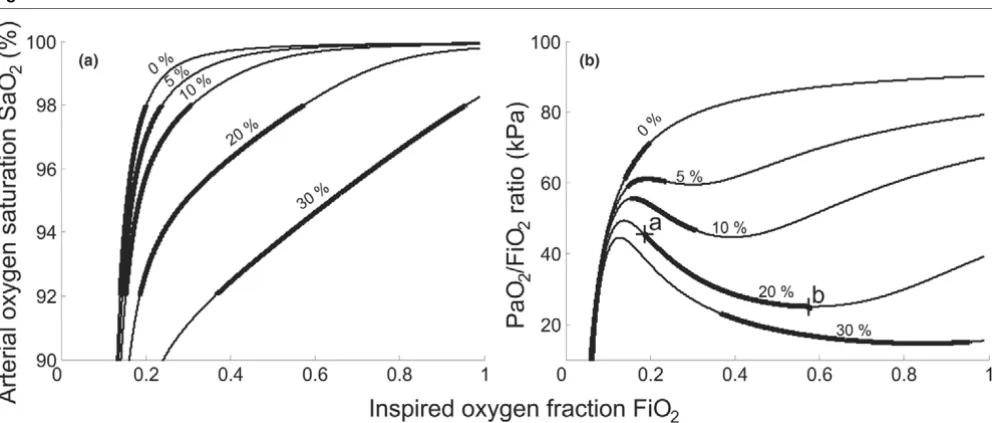
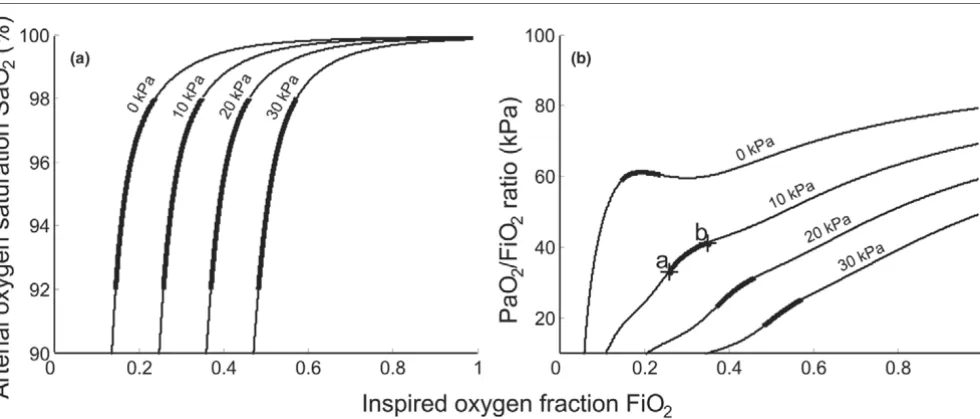
Figures 2 and 3 illustrate the results of the theoretical analysis showing the effects of varying FiO2 on model simulated values of SaO2 and the PaO2/FiO2 ratio.
Figure 2a,b illustrates the effects of varying either the 'effective shunt' of the model of Aboab and colleagues [6] or the shunt value included in the two-parameter model, these being equiv-alent for ΔPO2 = 0 kPa. Simulated increased shunt depresses
the shoulder of the FiO2 versus SaO2 curve, and depresses
and deforms the shape of the FiO2 versus PaO2/FiO2 ratio curve. As a result, the relevant range of FiO2 (thick solid part of
lines) broadens with increases in shunt. The deformation in the PaO2/FiO2 ratio curve has a characteristic shape whereby the PaO2/FiO2 first falls and then gradually rises, explained as
fol-lows. On increasing the FiO2 level, the partial pressure of
oxy-gen in the lung capillary blood increases. As the lung capillary blood mixes with that shunted, the increase in the partial pres-sure of oxygen in the lung capillary blood helps to oxygenate the shunted blood, so that the PaO2 value increases little and the PaO2/FiO2 ratio falls. On increasing the FiO2 level further, the mixture of shunted and lung capillary blood reaches an SaO2 value of about 98% where the arterial blood haemo-globin is almost saturated. Further increases in FiO2 translate
into increased PaO2, and hence an increasing PaO2/FiO2
ratio. It should be noted that the range of FiO2 giving 92–98% saturation may extend below atmospheric oxygen levels (FiO2
= 0.21) in patients with only mild gas exchange abnormalities or in normal subjects. The simulations in Figure 2b show how the PaO2/FiO2 ratio changes with FiO2 as found by Aboab and
colleagues [6]. For example, for a shunt value of 20% (see Fig-ure 2b, points a and b) the PaO2/FiO2 ratio falls by 20.5 kPa,
from 45.5 kPa to 25 kPa, over the relevant range of FiO2.
Figure 3a,b illustrates the effects of varying the degree of V/Q mismatch in the two-parameter model. The effects of a V/Q mismatch on the SaO2 or the PaO2/FiO2 ratio are quite
differ-ent from the effects of shunt. The FiO2 versus SaO2 curves are
shifted horizontally along the FiO2 axis with increasing V/Q mismatch. The PaO2/FiO2 ratio is increased with increasing
FiO2 levels, as the absence of significant shunt means that
arterial haemoglobin is saturated on small increases in FiO2. The small dip in the PaO2/FiO2 ratio seen in these curves,
particularly at the 0 kPa level, is due to the 5% shunt used in these plots. For the cases simulated in Figure 3, the PaO2/ FiO2 ratio is quite sensitive to changes in FiO2. Within the
[image:4.612.60.556.469.680.2]rel-evant range of FiO2 (thick solid part of lines) for a ΔPO2 value
Figure 2
Model simulations of arterial oxygen saturation and arterial oxygen partial pressure/inspired oxygen fraction ratio
Model simulations of arterial oxygen saturation and arterial oxygen partial pressure/inspired oxygen fraction ratio. (a) Inspired oxygen fraction (FiO2)
of 10 kPa (see Figure 3b, points a and b), the PaO2/FiO2 ratio increases by 8.3 kPa, from 32.9 kPa to 41.2 kPa.
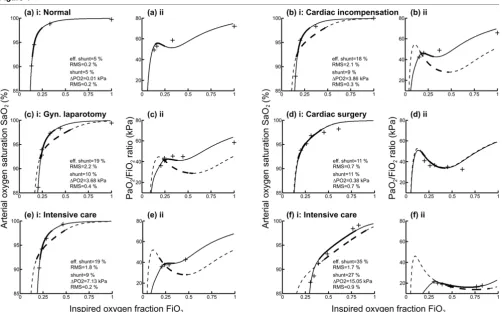
Figure 4 illustrates model simulations and measured data describing the changes in SaO2 and the PaO2/FiO2 ratio on
varying the FiO2 level for six patients, selected from the 116 patient cases to represent typical cases. Measured values and the model simulations using the 'effective shunt' model and the two-parameter model are shown. The range of FiO2 defined for each patient (giving SaO2 = 92–98%) is shown, such that
those patients with more severe lung diseases have a higher range than those with less severe disease. For each of the fits, values of model parameters are given along with the root mean square value describing the error in model fitting.
The average (± standard deviation) root mean square for fitting the two-parameter model to the data was 0.5 ± 0.4%, com-pared with 1.4 ± 1.0% (± SD) for the 'effective shunt' model. The results of the F test showed that the two-parameter model gave a statistically better fit to the data than the 'effective shunt' model (P < 0.005). In all cases the two-parameter model fitted the data either as well as or better than the 'effec-tive shunt' model, as described by the root mean square. In cases where the 'effective shunt' model fitted the data well (for example, Figure 4a,d), the fits of the two models were almost identical. In other cases (for example, Figure 4b,c,e,f), the two-parameter model gave a much better fit to the data.
The plots of FiO2 versus the PaO2/FiO2 ratio illustrated in
Fig-ure 4 also show that the two-parameter model is necessary to
describe measured changes in the PaO2/FiO2 ratio, where a V/Q mismatch is present. For some patients (Figure 4b,c,e,f) the measured change in the PaO2/FiO2 ratio with FiO2 had a very different form from that predicted by the 'effective shunt' model. The possibility of a patient being defined in different clinical groups dependent on the FiO2 level can be seen, for example, in Figure 4d(ii). Here, according to the two-parame-ter model, an increase in the FiO2 level from 0.21 to 0.43
decreased the PaO2/FiO2 ratio from 45 kPa to 34 kPa, result-ing in a change in disease classification from mild hypoxemia to ALI.
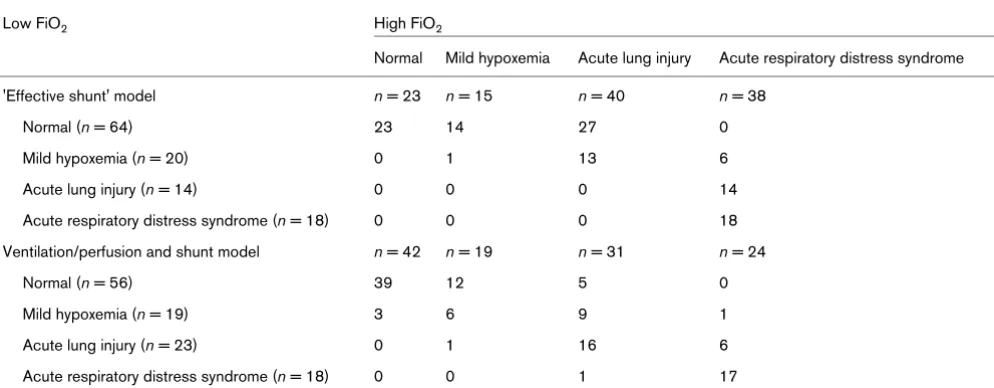
Table 1 presents a confusion matrix showing the number of patient cases classified in the four disease groups and how this classification varied with changes in FiO2 using the two
models. The left-hand column presents the number of patient cases classified in each group at a low FiO2 level. The table elements then describe the patient cases classified in each group at high FiO2. Each element can therefore be interpreted to illustrate movement between groups; for example, of the 56 patient cases classified as normal at low FiO2 level using the
two-parameter model, 39 patients remain classified as normal at high FiO2 levels.
Disease classification changed in 60 of 116 patient cases (~50%) according to the 'effective shunt' model, compared with 38 of 116 patient cases (~30%) according to the two-parameter model. With an increase in the FiO2 level, but main-taining SaO2 within the range 92–98%, according to the
[image:5.612.64.554.94.303.2]'effective shunt' model the number of patient cases classified Figure 3
Model simulations of arterial oxygen saturation and arterial oxygen partial pressure/inspired oxygen fraction ratio
Model simulations of arterial oxygen saturation and arterial oxygen partial pressure/inspired oxygen fraction ratio. (a) Inspired oxygen fraction (FiO2)
versus arterial oxygen saturation (SaO2). (b) FiO2 versus the partial pressure of oxygen in arterial blood (PaO2)/FiO2 ratio. Simulations performed using shunt = 5%, parameter ΔPO2 (fA2) = 0–30 kPa (0.9–0.11), oxygen consumption = 0.26 l/min, alveolar minute volume = 5.25 l. Points a and b, the PaO2/FiO2 ratios for FiO2 = 0.26 (point a) and FiO2 = 0.35 (point b) – corresponding to the extremes of the relevant range of FiO2 (thick solid
Critical Care Vol 11 No 6 Karbing et al.
as ALI and ARDS changed from 14 to 40 (~186% increase) and from 18 to 38 (~111% increase), respectively. According to the two-parameter model, the number of patient cases clas-sified as ALI and ARDS changed from 23 to 31 (~35% increase) and from 18 to 24 (~33% increase), respectively. According to the 'effective shunt' model, disease severity only increased with FiO2 – whereas five patient cases changed classification to a less severe disease group according to the two-parameter model.
Discussion
The present study has investigated the variation in the PaO2/ FiO2 ratio with FiO2, and the mathematical model complexity
necessary to describe this variation. For the first time this anal-ysis has been performed not only theoretically using mathe-matical model simulations, but also experimentally from measurements of the PaO2/FiO2 ratio taken at different FiO2 levels.
The use of a two-parameter model of gas exchange to describe variation in the PaO2/FiO2 ratio has been investi-gated. This model has been shown, using an F test, to provide a statistically better fit to oxygenation data than an 'effective shunt' model, even when taking into account the degrees of freedom lost due to the presence of an extra parameter. This improvement in fit can be seen in the plots shown in Figure 4, which were selected to illustrate a variety of patient cases. In four of these six cases (Figure 4b,c,e,f), simulations using the 'effective shunt' model do not describe the measured variation in the PaO2/FiO2 ratio with varying FiO2 level. Interpretation of
the PaO2/FiO2 ratio changes in these four examples using the 'effective shunt' model would result in an overestimation of the changes in the PaO2/FiO2 ratio when varying the FiO2 level. In
[image:6.612.57.559.91.403.2]the remaining two cases (Figure 4a,d) the 'effective shunt' model and the two-parameter model provide an equivalent description of the data. The case presented in Figure 4a rep-resents a normal subject with no V/Q mismatch problem and 5% shunt, whilst the case shown in Figure 4d represents a Figure 4
Model simulations and measured data for six patients selected to represent typical cases
patient with little V/Q mismatch such that all oxygenation prob-lems can be explained by shunt.
In general, use of the 'effective shunt' model to simulate changes in the PaO2/FiO2 ratio results in an overestimate of
the number of patient cases changing disease classification upon increasing FiO2, as illustrated in Table 1. Approximately 50% of the patient cases change classification using the 'effective shunt' model, in comparison with 30% using the two-parameter model.
For five patient cases, the change in disease classification sim-ulated by the 'effective shunt' model was in the opposite direc-tion to that shown by the measured PaO2/FiO2 ratio – the 'effective shunt' model simulating an incorrect degree of dis-ease severity. In these patient cases the V/Q mismatch was the major cause of hypoxemia according to the two-parameter model, and this model was necessary to simulate these changes in the PaO2/FiO2 ratio. The difference in the direction
of disease classification provided by these two models can be understood by looking at Figure 4e. For this case, the 'effective shunt' model simulation would result in a reduction in the PaO2/FiO2 ratio on increasing the FiO2 level in comparison with both the raw data and the two-parameter model simulation.
The necessary criteria for diagnosing ALI and ARDS include acute onset of respiratory failure, bilateral infiltrates seen on a frontal chest radiograph and no clinical evidence of left atrial hypertension in addition to the PaO2/FiO2 ratio limits [4]. In the present study, patient cases were classified only from the PaO2/FiO2 ratio. The sole difference between the criteria for
ALI and ARDS, however, is the level of hypoxemia quantified by the PaO2/FiO2 ratio.
Conclusion
The present article has shown that the PaO2/FiO2 ratio
depends on both the FiO2 level and the SaO2 level, and that, for changes in FiO2 corresponding to an SaO2 range of 92– 98%, 30% of patients change disease classification due to variation in the PaO2/FiO2 ratio. The clinical and scientific util-ity of the PaO2/FiO2 ratio therefore seems doubtful, and at the
very least the FiO2 level at which the PaO2/FiO2 ratio is
[image:7.612.59.556.116.310.2]meas-ured should be specified when quantifying the effects of ther-apeutic interventions or when specifying diagnostic criteria for ALI and ARDS. Perhaps more appropriate would be to replace the single-parameter PaO2/FiO2 ratio description with two parameters, a parameter to describe the oxygenation problem due to V/Q mismatch and one to describe oxygenation prob-lems due to shunt. Indeed, Riley and Cournand [20] recog-nized in the 1950s that oxygenation problems should be divided in this way. With the ability to identify two-parameter models rapidly using pulse oximetry data [14] and simple clin-ical methods [13], their clinclin-ical application seems timely. Table 1
Numbers of patients changing disease group with increasing inspired oxygen fraction (FiO2) across the relevant range
Low FiO2 High FiO2
Normal Mild hypoxemia Acute lung injury Acute respiratory distress syndrome
'Effective shunt' model n = 23 n = 15 n = 40 n = 38
Normal (n = 64) 23 14 27 0
Mild hypoxemia (n = 20) 0 1 13 6
Acute lung injury (n = 14) 0 0 0 14
Acute respiratory distress syndrome (n = 18) 0 0 0 18
Ventilation/perfusion and shunt model n = 42 n = 19 n = 31 n = 24
Normal (n = 56) 39 12 5 0
Mild hypoxemia (n = 19) 3 6 9 1
Acute lung injury (n = 23) 0 1 16 6
Acute respiratory distress syndrome (n = 18) 0 0 1 17
Patients classified into disease groups at the lowest and highest FiO2 level in the range, according to the following partial pressure of oxygen in
arterial blood (PaO2)/FiO2 ratio criteria: normal (PaO2/FiO2 > 47 kPa) [19], mild hypoxemia (40 kPa ≤ PaO2/FiO2 < 47 kPa), acute lung injury (27
kPa ≤ PaO2/FiO2 < 40 kPa) [4,5], and acute respiratory distress syndrome (PaO2/FiO2 < 27 kPa) [4,5].
Key messages
• The variation in the PaO2/FiO2 ratio with the FiO2 level
is scientifically and clinically relevant.
• The variation in the PaO2/FiO2 ratio with the FiO2 level
Critical Care Vol 11 No 6 Karbing et al.
Competing interests
SK, SA and SER are all shareholders of Mermaid Care APS, a company involved in the development of equipment for the measurement of pulmonary gas exchange. SA is a board mem-ber of Mermaid Care APS. All other authors declare that they have no competing interests.
Authors' contributions
All authors contributed to the conception and design of the study. SK, KE and CA contributed to the data collection and clinical interpretation of the results. DSK, BWS, SA and SER contributed to the mathematical modelling, data analysis and technical interpretation of the results, including statistical anal-ysis. DSK and SER drafted the manuscript, with all other authors being involved in its revision and approval.
Acknowledgements
This work was partially supported by the Programme Commission on Nanoscience, Biotechnology and IT under the Danish Council for Stra-tegic Research.
References
1. Amato MB, Barbas CS, Medeiros DM, Schettino G, de P, Lorenzi Filho G, Kairalla RA, Deheinzelin D, Morais C, Fernandes E, de O, Takagaki TY: Beneficial effects of the 'open lung approach' with low distending pressures in acute respiratory distress syn-drome. A prospective randomized study on mechanical ventilation. Am J Respir Crit Care Med 1995, 152:1835-1846. 2. Piccinni P, Dan M, Barbacini S, Carraro R, Lieta E, Marafon S,
Zamperetti N, Brendolan A, D'Intini V, Tetta C, et al.: Early isovol-aemic haemofiltration in oliguric patients with septic shock. Intensive Care Med 2006, 32:80-86.
3. Demory D, Michelet P, Arnal JM, Donati S, Forel JM, Gainnier M, Bregeon F, Papazian L: High-frequency oscillatory ventilation following prone positioning prevents a further impairment in oxygenation. Crit Care Med 2007, 35:106-111.
4. Bernard GR, Artigas A, Brigham KL, Carlet J, Falke K, Hudson L, Lamy M, Legall JR, Morris A, Spragg R: The American–European Consensus Conference on ARDS. Definitions, mechanisms, relevant outcomes, and clinical trial coordination. Am J Respir Crit Care Med 1994, 149:818-824.
5. Artigas A, Bernard GR, Carlet J, Dreyfuss D, Gattinoni L, Hudson L, Lamy M, Marini JJ, Matthay MA, Pinsky MR, et al.: The Ameri-can–European Consensus Conference on ARDS, part 2: venti-latory, pharmacologic, supportive therapy, study design strategies, and issues related to recovery and remodeling. Am J Respir Crit Care Med 1998, 157:1332-1347.
6. Aboab J, Louis B, Jonson B, Brochard L: Relation between PaO2/
FIO2 ratio and FIO2: a mathematical description. Intensive Care
Med 2006, 32:1494-1497.
7. Gowda MS, Klocke RA: Variability of indices of hypoxaemia in adult respiratory distress syndrome. Crit Care Med 1997, 25:41-45.
8. Whiteley JP, Gavaghan DJ, Hahn CEW: Variation of venous admixture, SF6 shunt, PaO2, and the PaO2/FIO2 ratio with FIO2.
Br J Anaesth 2002, 88:771-778.
9. Wagner PD, Saltzman HA, West JB: Measurement of continu-ous distributions of ventilation–perfusion ratios: theory. J Appl Physiol 1974, 36:588-599.
10. Andreassen S, Rees SE, Kjaergaard S, Thorgaard P, Winter SM, Morgan CJ, Alstrup P, Toft E: Hypoxemia after coronary bypass surgery modeled by resistance to oxygen diffusion. Crit Care Med 1999, 27:2445-2453.
11. Kjærgaard S, Rees SE, Nielsen JA, Freundlich M, Thorgaard P, Andreassen S: Modelling of hypoxaemia after gynaecological laparotomy. Acta Anaesthesiol Scand 2001, 45:349-356. 12. de Gray L, Rush EM, Jones JG: A noninvasive method for
eval-uating the effect of thoracotomy on shunt and ventilation per-fusion inequality. Anaesthesia 1997, 52:630-635.
13. Rees SE, Kjaergaard S, Thorgaard P, Malczynski J, Toft E, Andreassen S: The Automatic Lung Parameter Estimator (ALPE) system: non-invasive estimation of pulmonary gas exchange parameters in 10–15 minutes. J Clin Monit Comput 2002, 17:43-52.
14. Kjaergaard S, Rees S, Malczynski J, Nielsen JA, Thorgaard P, Toft E, Andreassen S: Non-invasive estimation of shunt and ventila-tion–perfusion mismatch. Intensive Care Med 2003, 29:727-734.
15. Kjaergaard S, Rees SE, Grønlund J, Lambert P, Nielsen EM, Thor-gaard P, Andreassen S: Hypoxaemia after cardiac surgery: clin-ical application of a model of pulmonary gas exchange. Eur J Anaesthesiol 2004, 21:296-301.
16. Rasmussen BS, Sollid S, Rees SE, Kjaergaard S, Murley D, Toft E: Oxygenation within the first 120 h following coronary artery bypass grafting. Influence of systemic hypothermia (32 degrees C) or normothermia (36 degrees C) during the cardi-opulmonary bypass: a randomized clinical trial. Acta Anaesthe-siol Scand 2006, 50:64-71.
17. Altman DG: Practical Statistics for Medical Research London: Chapman and Hall; 1991.
18. Kohavi R, Provost F: Glossary of terms. Mach Learn 1998, 30:271-274.
19. Gluck E, Sarrigianidis A, Dellinger RP: Mechanical ventilation. In Critical Care Medicine 2nd edition. Edited by: Parrillo JE, Dellinger RP. St Louis, MO: Mosby; 2002:137-161.