7446
ESTIMATION OF CENTRAL NERVOUS SYSTEM ACTIVITY
BY DATA MINING NORMAL SINUS-ECG RHYTHMS
1JEONG-HWAN KIM, 1JEONG-WHAN LEE, 1*KYEONG-SEOP KIM
1Biomedical Engineering, School of ICT Convergence Engineering, College of Science & Technology,
Konkuk University, Korea
*Corresponding author
E-mail: 1[email protected], 1[email protected], 1*[email protected]
ABSTRACT
In this study, we propose a method to assess central nervous system activity in terms of activity-degree in sympathetic and parasympathetic state by estimating the cardiac oscillator-parameters of Integral Pulse Frequency Modulation (IPFM) model in which the artificial heart rhythms are generated by modulating sinusoid signal with applying the threshold level for resolving R-peaks. With this aim, we proposed a modified IPFM model by the empirical method with applying preset-threshold of unity. The artificial R-R interval data are analyzed by the time and frequency-domain features to describe Heart Rate Variability (HRV) under the effects of cardiac oscillator constants. The benchmarking MIT/BIH database consisted of Normal Sinus Electrocardiogram rhythms (NSR-ECG) are utilized to estimate the sympathetic and parasympathetic constants by comparing HRV measures on MIT/BIH NSR with those on the data generated by our modified IPFM model. Based on our experimental results on estimating the modulatory parameters of central nervous system activity, we can conclude that IPFM parameters on the real ECG data can be effectively estimated to assess cardiac-sympathetic and parasympathetic activity.
Keywords: Electrocardiogram (ECG), Heart Rate Variability (HRV), Integral Pulse Frequency
Modulation (IPFM), Autonomic Nervous System (ANS), sinus rhythm, Poincare plot.
1. INTRODUCTION
Many biomedical measurements are influenced by the balance of autonomic nervous system (ANS) in terms of sympathetic and parasympathetic nerve activity [1]. The Electrocardiogram (ECG) also reflects the activities of two subsystems by revealing the variability in the time between successive heart beats. The prominent fiducial feature in ECG for estimating heart rate is R-peak wave and Heart Rate Variability (HRV) analyses the variability in R-R intervals [2],[3],[4]. Mathematical models for generating the artificial R-R intervals have been suggested to estimate the effects of autonomic nerve activity. Integrate Pulse Frequency Modulation (IPFM) model [5],[6],[7] aimed to produce heart beat-to-beat fluctuations by integrating the modulated sinusoid signals with the coupled-oscillating coupling constants: sympathetic oscillator, Cs and parasympathetic oscillator, Cp.
The effects of coupling parameters were investigated by interpreting time-domain or power
spectrum features of HRV applied on the artificially generated heart-beats [8]. However, none of the proposed IPFM models offered a method to estimate the values of Cs and Cp based on the ECG
data obtained from the real cardiac patients. With this aim, a new IPFM model is proposed with applying preset-threshold of unity to generate R-R intervals and then the time and frequency-domain features of HRV on the simulated time series are computed with varying cardiac oscillator parameters, Cs and Cp. In order to validate the
7447
2. MATHEMATICAL MODEL FOR
GENERATING ARTIFICIAL HEART BEATS
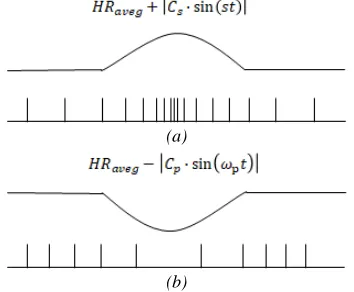
The IPFM model simulates heart-beat fluctuations, m(t) by modulating sinusoidal signal
[image:2.612.318.526.62.198.2]coupled with sympathetic and parasympathetic oscillator constants, Cs and Cp as illustrated in
Figure 1 and equation (1) [11]:
(a)
(b)
Figure 1: The role of Cs and Cp for modulating sinusoidal signal.
𝑚 t 𝐶 ∙ sin 𝜔 𝑡 𝐶 sin 𝜔 𝑡 (1)
𝐻𝑅 ≫ (2)
, where 𝜔 , 𝜔 are oscillating frequencies for modulating virtual cardiac control system and
HRaveg denotes the average time-duration between
heart beats. The output of IPFM model is a series of pulses, tk’s where each of amplitude exceeds the
predefined threshold value of unity as shown in Figure 2 [11].
Figure 2: Block diagram of IPFM model.
[image:2.612.106.283.199.345.2]A typical power spectrum of HRV has three frequency ranges: very low frequency (VLF) (0 ~ 0.04 Hz), low frequency (LF) (Mayer waves, 0.04 ~ 0.15 Hz) and high frequency (HF) range (RSA waves, 0.15 ~ 0.04 Hz) (Figure 3) [12].
Figure 3: Three-main waves in the power spectrum of HRV.
Attarodi et al. [6] proposed IPFM integral-model using four inputs of sinusoidal signals to simulate three-prominent peaks in the power spectrum of HRV. However, this IPFM model yielded the power spectrum of HRV with some spectral leakages between main waves. Thus, we propose an empirical IPFM model by employing data mining approach on MIT-BIH database.
𝐻𝑅 𝑚 t 𝐻𝑅 |𝐶 ∙ sin 𝜔 𝑡 |
∙ sin 𝜔 𝑡
𝐶 ∙ sin 𝜔 𝑡 (3)
Here, HRaveg was estimated by the average value
of R-R intervals with considering NSR database: MIT-BIH record: 16265, 16272, 16273, 16240, 16483, 16539, 16773, 16786, 16795, 17052, 17453, 18177, 18184, 19088, 19090, 19093, 19140 and 19830. Each record contained 20 ~ 22 hours ECG measurements sampled with 360 Hz. The proposed IPFM model generates the simulated R-wave of the ECG signal when the output of integrator reaches the threshold value of unity. Figure 4 shows the power spectrum of HRV signals based on the proposed IPFM model by exemplifying the oscillator constants:
(a) Cs = 0.06, Cp = 0.34
(b) Cs = 0.1, Cp = 0.1
(c) Cs = 0.5, Cp = 0.1
[image:2.612.93.300.536.596.2]7448
(a)
(b)
[image:3.612.99.276.76.503.2](c)
Figure 4: Power spectrum of HRV signal based on our proposed IPFM model, (a) Cs = 0.06, Cp = 0.34, (b) Cs =
0.1, Cp = 0.1, (c) Cs = 0.5, Cp = 0.1.
3. HRV MEASURES FOR ESTIMATING THE OSCILLATOR PARAMETERS OF ROPOSED IPFM MODEL
In order to evaluate the roles of Cs and Cp in the
proposed IPFM model as expressed in equation (3), we selected time-domain and power spectrum measures as summarized in Table 1. Here, Poincare plot represents the geometrical pattern of R-R time series on Cartesian plane by visualizing the correlation between consecutive R-R intervals [13]. Also, Welch-LF/HF, Burg-LF/HF and Lomb-LF/HF imply the ratio of LF and HF power spectrum computed by Welch, Burg and Lomb’s
[image:3.612.315.522.199.541.2]periodogram processing method, respectively [14]. For our computations of HRV measures, we applied HRVAS (HRV Analysis Software) open source Matlab library which was developed to analyze HRV features [15].
Table 1: HRV measures selected for estimating the parameters of autonomic nervous activity [16].
Variable Units Descriptions
SDNN ms The standard deviation of all normal beat to normal beat (NN) intervals.
SDNN index ms
Mean of the standard deviations of all NN intervals for all 5 min segments of
the entire recording
SDANN ms
The standard deviation of the average of NN intervals in all 5 min segments of the considered ECG recordings.
RMSSD ms The square root of the mean of the sum of the squares of differences between the adjacent NN intervals.
NN50 -
Number of pairs of adjacent NN intervals differing by more than 50 ms
in the ECG recordings.
pNN50 % NN50 counts divided by the total number of all NN intervals.
SD1 ms
The standard deviation of the perpendicular distance to the line of
identity in Poincare plot.
SD2 ms
The standard deviation of the distance along to the line of identity in Poincare
plot.
Welch-LF/HF -
The ratio of LF and HF spectrum in HRV by Welch Power Spectrum
estimation.
Burg-LF/HF -
The ratio of LF and HF spectrum in HRV by Burg Power Spectrum
estimation.
Lomb-LF/HF -
The ratio of LF and HF spectrum in HRV by Lomb Power Spectrum
estimation.
4. EXPERIMENTAL RESULTS AND ANALYSIS
For the experimental simulations, we adopted the eighteen sets of NSR and each HRV signal is computed based on non-overlapping ECG data segment of five minutes duration. HRV measures as specified in Table 1 were calculated and compared with the corresponding HRV feature on the artificial R-peaks by increasing or decreasing Cs
and Cp value with using a scale of 0.01. The
computing range of Cs is from 0 to 1 and the scope
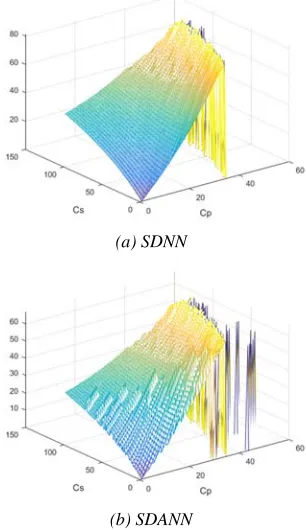
of Cp is from 0 to 0.5. Figure 5 shows the computed
7449
(a) SDNN
(b) SDNN index
(c) SDANN
(d) RMSSD
(e) NN50
(f) pNN50
(g) SD1
7450
(i) Welch-LF/HF ratio
(j) Burg-LF/HF ratio
[image:5.612.114.278.84.516.2](k) Lomb-LF/HF ratio
Figure 5: The computed HRV measures on the artificial heart beats. The index represents the scaled version (100
times) of actual values of Cs and Cp. In other words, Cs (Cp) ranges from 0 to 1.0(0.5) with increasing by 0.01.
Similarly, we calculated HRV features using the MIT-BIH NSR database and tried to eliminate the outliers by applying Interquartile-range (IQR) statistical analysis [17]. Table 2 shows the HRV features which exists in the range of Q1-1.5·IQR ~
Q3+1.5·IQR, where Q1 and Q3 denote the first
quartile and third quartile of the total range, respectively.
Table 2: HRV features resulted from applying IQR analysis on MIT-BIH NSR dataset.
HRV Features Maximum value Minimum value
SDNN 81.5 -3.3
SDANN 66.9 -1.9
RMSSD 76.85 -8.35
NN50 179 -85
pNN50 53.1 -26.1
SD1 54.45 -5.95
SD2 101.5 -4.1
Welch-LF/HF 8.552 -3
Burg-LF/HF 8.9745 -3.4375
Lomb-LF/HF 8.6235 -3.1085
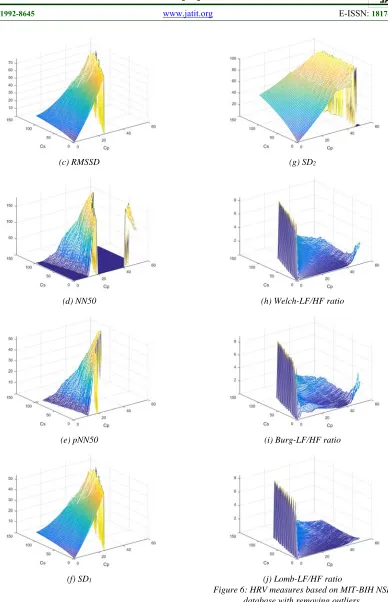
The outliers that exist in the computed HRV measures as shown in Figure 3 were eliminated by applying Interquartile-range analysis as stated in Table 2. Figure 6 displays HRV feature resulted from removing outliers. Note that SDNN index feature was not considered due to its nonlinearity and the negative values displayed in Table 2 were not used.
(a) SDNN
[image:5.612.315.521.117.280.2] [image:5.612.342.495.401.666.2]7451
(c) RMSSD
(d) NN50
(e) pNN50
(f) SD1
(g) SD2
(h) Welch-LF/HF ratio
(i) Burg-LF/HF ratio
[image:6.612.115.503.65.667.2](j) Lomb-LF/HF ratio
Figure 6: HRV measures based on MIT-BIH NSR database with removing outliers.
The valid range of Cs and Cp was determined by
7452
Figure 7: The decision logic map for determining the valid range of Cs and Cp. The real Cs and Cp values can be obtained by dividing 100.
The final Cs and Cp value on the real ECG
segments are estimated by finding the minimum mean-square-error (MSE) as the differences of HRV measures on between the annotated ECG segment and the IPFM output. We tested 18 MIT-BIH NSR dataset (16265, 16272, 16273, 16240, 16483, 16539, 16773, 16786, 16795, 17052, 17453, 18177, 18184, 19088, 19090, 19093, 19140 and 19830) by encoding the data into 5 minutes-segments. Figure 8 represents histogram distribution of Cs and Cp evaluating on MIT-BIH
NSR dataset. It also shows that Cs (Cp) have a
Gaussian distribution ranging from 0 to 1.0 (0.5) for Normal sinus rhythms.
(a)
[image:7.612.121.271.104.217.2](b)
Figure 8: Histogram distribution of (a) Cs and (b) Cp by evaluating MIT-BIH NSR dataset.
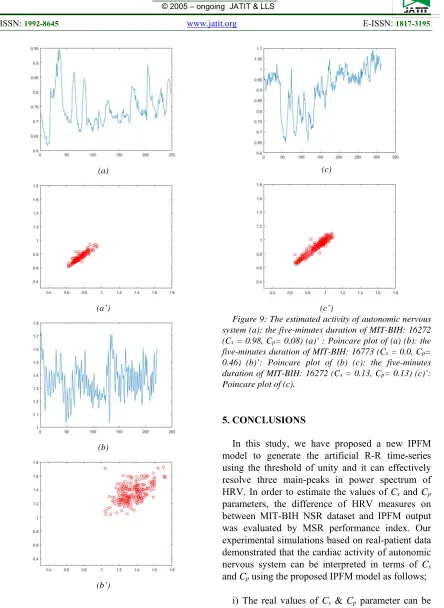
To illustrate effects of Cs and Cp by Poincare
plot, we sought particularly three cases: (a) high Cs
and low Cp, (b) low Cs and high Cp and (c) similar
range of Cs and Cp, respectively. With this aim, we
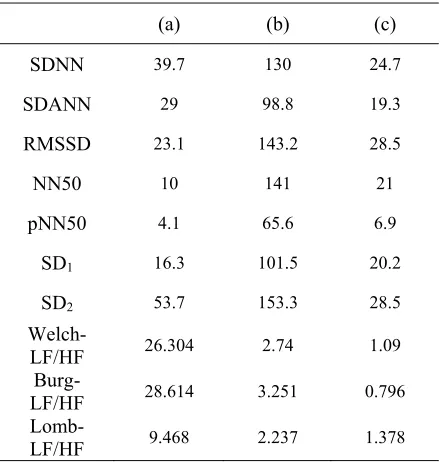
[image:7.612.308.528.286.517.2]considered MIT-BIH (a) five-minutes duration of 16272 elapsed by 22 hours, (b) five-minutes duration of 16773 between 20 and 22 hours elapsed and (c) five-minutes duration of 16272 between 8 and 10 hours elapsed. Table 3 displays HRV measure on the selected MIT-BIH NSR dataset and Table 4 shows the estimated Cs, and Cp values.
Table 3: HRV measures on five-minutes duration of 16272, 16773 and 16272 record, Respectively.
(a) (b) (c)
SDNN 39.7 130 24.7
SDANN 29 98.8 19.3
RMSSD 23.1 143.2 28.5
NN50 10 141 21
pNN50 4.1 65.6 6.9
SD1 16.3 101.5 20.2
SD2 53.7 153.3 28.5
Welch-
LF/HF 26.304 2.74 1.09
Burg-
LF/HF 28.614 3.251 0.796 Lomb-
[image:7.612.126.268.450.705.2]LF/HF 9.468 2.237 1.378
Table 4: The estimated Cs and Cp based on the records as specified in Table 3.
Cs Cp
(a) 0.98 0.08
(b) 0 0.46
(c) 0.13 0.13
[image:7.612.309.524.564.624.2]7453
(a)
(a’)
(b)
(b’)
(c)
[image:8.612.91.535.55.663.2](c’)
Figure 9: The estimated activity of autonomic nervous system (a): the five-minutes duration of MIT-BIH: 16272 (Cs = 0.98, Cp= 0.08) (a)’ : Poincare plot of (a) (b): the five-minutes duration of MIT-BIH: 16773 (Cs = 0.0, Cp= 0.46) (b)’: Poincare plot of (b) (c): the five-minutes duration of MIT-BIH: 16272 (Cs = 0.13, Cp= 0.13) (c)’: Poincare plot of (c).
5. CONCLUSIONS
In this study, we have proposed a new IPFM model to generate the artificial R-R time-series using the threshold of unity and it can effectively resolve three main-peaks in power spectrum of HRV. In order to estimate the values of Cs and Cp
parameters, the difference of HRV measures on between MIT-BIH NSR dataset and IPFM output was evaluated by MSR performance index. Our experimental simulations based on real-patient data demonstrated that the cardiac activity of autonomic nervous system can be interpreted in terms of Cs
and Cp using the proposed IPFM model as follows;
i) The real values of Cs & Cp parameter can be
estimated by using data mining approach on MIT-BIH NSR dataset.
ii) Cs (Cp) have a Gaussian distribution ranging
7454
ACKNOWLEDGMENTS:
This work was supported by the National Research Foundation of Korea (NRF) grant funded by the Korean government (MSIP) (No. 2016R1A2B4016231).
REFRENCES:
[1] J. K. Karemaker, “An Introduction into Autonomic Nervous Function”, Physiological Measurements, Vol. 38, 2017, pp. R89-R118.
[2] E. Gernot, “Heart-Rate Variability-more than Heart Beats?" Frontiers in Public Health, Frontiers in Public Health, Vol. 5, 2017, pp.
1-12.
[3] U. R. Acharya, K. P. Joseph, N. Kannathal, C. L. Lim, and J. S. Suri, “Heart Rate Variability: a Review”, Medical and Biological Engineering and Computing, Vol. 44, Issue 12, 2006, pp.
1031-1051.
[4] J. D. Scheff, P. P. Mavroudis, S. E. Calvano, S. F. Lowry, and I. P. Androulakis, “Modeling Autonomic Regulation of Cardiac Function and Heart Rate Variability in Human Endotoxemia”,
Physiological Genomics, Vol. 43, 2011, pp.
951-964.
[5] M. Brennan, M. Palaniswami, and P. Kamen, “Poincare Plot Interpretation Using a Physiological Model of HRV Based on a Network of Oscillators”, Am J Physiol Heart Circ Physiol, Vol. 283, 2002, pp. H1873-1886.
[6] G. Attarodi, N. J. Dabanloo, Z. Abbasvandi, and N. Hemmati, “A New IPFM Based Model For Artificial Generating of HRV With Random Input”, International Journal of Computer Science Issues, Vol. 10, No. 2, 2013, pp. 1-5.
[7] G. W. Jeung, J. H. Kim, J. W. Lee, and K. S. Kim, “Assessment of Chaotic-threshold model on Integral Pulse Frequency Modulation for HRV Analysis”, The Transactions of the Korean Institute of Electrical Engineers, Vol.
66, No. 3, 2017, pp. 581-586.
[8] N. Safdarian, “New Modeling for Generation of Normal and Abnormal Heart Rate Variability Signals”, Journal of Biomedical Science and Engineering, Vol. 7, No. 14, 2014, pp.
1122-1143.
[9] G. B. Moody, and R. G. Mark, “The impact of the MIT-BIH Arrhythmia Database: History Lessons Learned, and Its Influence on Current and Future Database”, IEEE Engineering in Medicine and Biology Magazine, Vol. 20, Issue
3, 2001, pp. 45-50.
[10] A. L. Goldberger, L. A. N. Amaral, L. Glass, J. M. Hausdorff, P. C. Ivanov, R. G. Mark, J. E. Mietus, G. B. Moody, C. K. Peng, and H. E. Stanley, “PhysioBank, PhysioToolkit, and PhysioNet: Components of a New Research Resource for Complex Physiologic Signals”,
Cirulation, Vol. 10, No. 23, 2000, pp.
E215-220.
[11] A. H. Khandoker, C. Karmakar, M. Brennan, A. Voss, and M. Palaniswami, Poincare Plot methods for Heart Rate Variability Analysis, Springer, 2013, pp. 25-46.
[12] P. E. Mcsharry, G. D. Clifford, L. Tarassenko, and L. A. Smith, “A Dynamical Model for Generating Synthetic Electrocardiogram Signals”, IEEE Transactions on Biomedical Engineering, Vol. 50, Issue 3, 2003, pp.
289-294.
[13]K. Saranya, G. K. Pal, S. Habeebullah, and P. Pal, “Analysis of Poincare Plot of Heart Rate Variability in the Assessment of Autonomic Dysfunction in Patients with Polycystic Ovary Syndrome”, International Journal of Clinical and Experimental Physiology, Vol. 2, Issue 1,
2015, pp. 34-39.
[14] H. C. Omer, “Preprocessing Effects in Time-Frequency Distributions and Spectral Analysis of Heart Rate Variability”, Digital Signal Processing, Vol. 19, Issue 4, 2009, pp. 731-739.
[15] https://github.com/jramshur/HRVAS.
[16] A. John Camm, Günter Breithardt, J. Thomas Bigger, Sergio Cerutti, Richard J. Cohen, Philippe Coumel, Ernest L. Fallen, Harold L. Kennedy, Robert E. Kleiger, Federico Lombardi, Alberto Malliani, Arthur J. Moss, Jeffrey N. Rottman, Georg Schmidt, Peter J. Schwartz, Donald H. Singer, “Heart Rate Variability: Standards of Measurement, Physiological Interpretation, and Clinical use”,
European Heart Journal, Vol. 1996, 1996, pp.
357-381.
![Table 1: HRV measures selected for estimating the parameters of autonomic nervous activity [16]](https://thumb-us.123doks.com/thumbv2/123dok_us/8901385.955009/3.612.315.522.199.541/table-measures-selected-estimating-parameters-autonomic-nervous-activity.webp)