5522
THE APPLICATION OF ENTROPY-ROV METHODS TO
FORMULATE GLOBAL PERFORMANCE FOR SELECTING
THE AUTOMOTIVE SUPPLIERS IN MOROCCO.
MOUNA EL MKHALET1, SOULHI AZIZ2, RABIAE SAIDI3
1PhD student at Laboratory LASTIMI, CEDOC EMI, Rabat, Morocco 2Professor at Ecole Nationale Supérieure des Mines de Rabat, Agdal Rabat, Morocco
2ORCID: 0000-0003-1904-513X and the Scopus Author ID: 42162322200 3PhD student at Laboratory LASTIMI, CEDOC EMI, Rabat, Morocco
E-mail: 1[email protected],2[email protected], 3[email protected]
ABSTRACT
In Morocco, the automotive sector is constantly improving because it occupies an important place in the Moroccan economy; this is why our research will be in this context in order to bring added value in term scientist. The study we are conducting proposes, firstly, the selection of best AKPI: Appropriate Key Performance Indicators in an objective and utilitarian way, by the application of the combined method ENTROPY-ROV (Range of Value) in the Moroccan automotive sector, and then realize the formula of Global Performance. Secondly, this one will be used to select the best supplier in the Moroccan industrial automotive sector. Furthermore, the results obtained by the application of Entropy-ROV shows that the highest weight among the AKPIs are Machine Availability and the Number of Occupational Injuries, which respectively correspond to the key factors of success: Efficiency of Production Systems and Health and Safety: which requires improvement on the part of Moroccan companies in automotive sector. We also find that the calculation of Global Performance for suppliers shows, that the best supplier is the supplier2 which ranks first among the others. In addition when we compare the results obtained concerning the priority of the AKPIs and the choice of suppliers by the Entropy-ROV method in our research, to that of Chahid et al [28], who used the AHP method, we note that they are not the same. Finally, our contribution is to use for the first time, a scientific, quantitative and mathematical multi-criteria evaluation method called ENTROPY-ROV, which is a combined method, in the automotive industry in Morocco in order to select the best key success factors and to evaluate the suppliers in an objective and utilitarian way.
Keywords:Entropy, ROV, Supplier selection, Appropriate Key Performance indicator (AKPI), Moroccan automotive industry
1. INTRODUCTION
The automotive industry creates benefits and makes common advantages while relying on the mobilization of those who work there; it is therefore considered the company that creates more innovation and dynamism in upstream logistics [50].
In Morocco, the automotive sector is assumed to play an important role in economic development, this is due to the essential part of the business in the Moroccan economy (6% of GDP, 14% of exports), this is why Morocco aims to further develop and invest in this sector [51]. The automobile industries have a great impact in the development of the industrial sector in general in
Morocco, and lower the unemployment rate by creating new jobs [52].
In relation to world production, Morocco is the second-largest car producer in Africa, after South Africa, with a 26% share of African production (636,519 vehicles), which represents only 0.73% of global car production in 2013 [52].
This table below shows the production of vehicles between 2003 and 2013, from the three African countries: South of Africa, Morocco and Egypt [52].
Tableau 1: the production of vehicles between 2003 and 2013, from the three African countries[52]
Country 2003 2013
5523
Morocco 5% 26%
Egypt 5% 4%
The concentration of the automotive industries, are in three zones of Morocco: Tangier (43 per cent), Casablanca (39 per cent) and Kenitra (7 per cent) [52] [64].
The figure below shows the location of the three Moroccan cities; where the automotive industries are largely concentrated.
[image:2.612.324.511.127.275.2]These cities are located in northwestern Morocco.
Figure 1: locations of Tangier, Casablanca and Kenitra[65]
[image:2.612.101.290.242.424.2]Regarding the exports of the Moroccan automobile sector, in recent years they have recorded a remarkable performance, rising from 12.7 billion dirhams in 2007 to more than 40 billion dirhams in 2014, an average annual growth rate of 21 percent. % as shown in the figure:
Figure 2: Evolution of automotive exports between 2007-2013 [52]
There was also a significant increase in skilled employment, which grew at a rate of nearly 16% per year between 2008 and 2012, from 38,795
[image:2.612.101.290.533.683.2]jobs to 70,000 jobs: An additional creation of more than 31,000 jobs, as shown in Figure below:
Figure 3: Evolution of employment in the automotive sector between 2008-2012[66] [52]
On the other hand, Braglia and Petroni [53] announce that supplier selection is a very important phase for any industry in its buying process. Sharma [54] stated that the selection of suppliers and their assessment is currently considered very important and relevant in any automotive company and industry.
Given the importance of selecting the best Key factor success and choosing the best supplier in the automotive sector in Morocco, we will see, through this study that we will conduct, in this paper, how we can select the Key factor success in an objective and utilitarian way through the use of Multi criteria decision making (MCDM) and how we can select the best supplier.
In terms of knowledge, we contribute to the Moroccan automotive industry sector by proposing a new quantitative and mathematical multi-criteria evaluation method called Entropy-ROV for the choice of key success factors and evaluation of suppliers. This creates a certain added value in the Moroccan automotive industry because it is a scientific evaluation method and generally Moroccans do not use scientific methods for evaluating suppliers.
The Moroccan industrial automobile sector fail to use a scientific approach because it requires scientific expertise, and I as a research scientist I could apply this method Entropy-ROV in the Moroccan automotive industry, which requires to follow the steps and to apply the equations carefully.
5524 and ROV methods in the Moroccan automotive sector to solve the problem of supplier evaluation and the selection of key success factors in a utilitarian and objective way.
2. METHODOLOGY
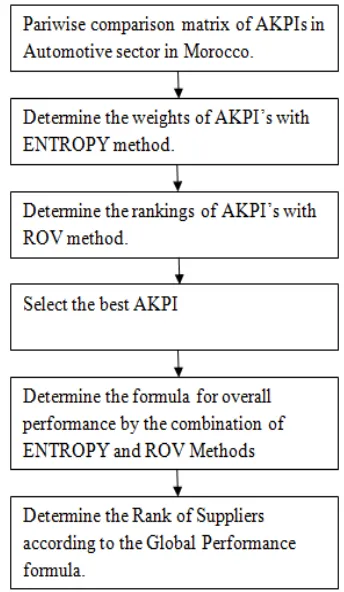
[image:3.612.107.279.365.661.2]The following methodology was carried out to achieve the objective of this research: firstly, in the results section, we present the different methods used to select the best supplier in the automotive sector. Secondly, the entropy method is presented, and we give examples of the studies that used it. Then, the entropy’s steps for calculate weight are presented with equations. In addition, the ROV: ranking of values method is presented and we give examples of the studies that used it. Then ROV’s steps for calculate weight are presented with equations. Furthermore, we explain our contribution in this paper of research in the automotive sector in Morocco. Then, in the case study, the procedure applied in our research is applied in Figure 4:
Figure 4: the procedure applied in our research
The weight of All Appropriate Key performance Indicators (AKPIs) for all automotive sectors in Morocco will be calculated by entropy method and then the ranking of the weight of
AKPI’s by ROV method is done. Then the graph of the AKPI's weight rankings obtained by the combination of the two methods mentioned, is clearly explained and analyzed. Then the formula of (GP) overall performance is expressed by the weights of combined Entropy-ROV method of the AKPI. Furthermore, we will apply this formula to choose the best supplier in the automotive sector in Morocco.
Finally, in the section: Discussion, through this paper, we will show the effectiveness of the method for the case studied.
3. RESULTS
3.1 The Methods Used For Selection Of Suppliers In Automotive Sector
5525 in a study conducted by Zeydan et al. [41] to solve a problem of supplier selection and evaluation in the automotive sector in Turkey. A new method that transfers the approach of typical of quality function deployment: QFD, to the house of quality (HOQ) method was applied in an automotive industry by Bevilacqua et al. [42] to solve the problem of selecting the best supplier. In order to solve the problem of selecting the best supplier in the automotive production industry, Keskin et al. [43] used the fuzzy-ART: fuzzy adaptive resonance theory (Fuzzy-ART) in his research. For selecting the best supplier in automotive manufacturing company in Malaysia, Jamil et al. [44] used different MCDM methods (AHP, FAHP, TOPSIS, FTOPSIS, and FAHPiFTOPSIS). Dogan and Aydin [45] proposed a combination between Bayesian Network (BN) and Total Cost Ownership (TCO) methods and tested their approach for the supplier selection process. In automotive industry in India, Parthiban et al. [46] utilized first an interpretive structural modeling technique to get the weights for the performance factors that influence the supplier selection process after studied them, and they applied AHP to obtain the rank of suppliers. Using a case of automotive industry in Pakistan, Dweiri et al. [47] proposed a decision support model for supplier selection based on analytic hierarchy process (AHP). For identifying the most important criteria to be used as a baseline for a supplier selection process of automotive sector in India, Sagar and Singh [48] used the questionnaire for data collection and compared with the previous research. Huang and Hu [49] conducted a study with the aim is selection of the best supplier in automotive industry in Taiwan based on use of Fuzzy Analytic Network Process-Goal Programming (FANP-GP) and De Novo Programming (DNP).
3.2 The Entropy Method:
Entropy starts first in thermodynamics with Rudolph Clausius (1865) to describe the irreversibility of the system [61]. The entropy, in a closed physical system, increases over time [62] [63].
The figure below shows the increase of the entropy in a system. When there is the order, the entropy is small, there is no agitation between the particles, and there are no shocks between them as shown in the first picture of the figure below. Whereas when there is a disorder, there is an increase of the entropy, there is a lot of agitation in the particles and there are even shocks between them.
Figure 5: System in order and disorder [58]
On the other hand, It was Shannon who was the first one who developed the theory of entropy of information in 1948 [7].
The theory of Shannon was mainly applied in communication systems such as Radio, Television [58]. A general communication system consists of five parts [7] [59]
The message is generated by a source S,
The message is generated by a source S is transmitted to an emitter T, which changes it into a signal that will be transmitted.
The signal is transmitted from the transmitter to the receiver through the CH channel
The message is reconstructed from the signal, thanks to receiver R
The message is received by a destination D
5526
Figure 6: Parts of system communication according to Shannon’s theory [7][59]
The Source S is a system with a range of possible states s1, s2….sn with respective
probabilities p(s1), p(s2)….p(sn). The average
amount of information produced at the source S is the entropy of the source S:
)
(
log
)
(
)
(
1
ni
i
i
p
s
s
p
S
H
(1)The Destination D is a system with a range of possible states d1, d2….dn with respective
probabilities p(d1), p(d2)….p(dn). The average
amount of information produced at the destination D is the entropy of the source D:
)
(
log
)
(
)
(
1
ni
i
i
p
d
d
p
S
D
(2)Without direct inclusion of the decision-maker, the entropy is a method which makes it possible to obtain objective weights of the alternatives [8]. The objective weight is determined by the entropy of Shannon [9]. The degree of disorder of a system is measured by Shannon's entropy, which can also be used to define also whether the data grant an effective information or not [11].
In the literature, the entropy of Shannon has been used in several fields. To protect land in China against the expansion of industrialization and urbanization, luo et al. [12] use Entropy method combined with AHP method to assess a more objective weight of indicators that have an effect on intensive land use in districts, counties and other
provinces of China. Hamidi et al. [13] use Entropy method combined with AHP method to evaluate the weight of important criteria that affect the selection of the best brands in Iran's beverage industries. Chuansheng et al. [10] use Entropy method combined with AHP method to calculate the weight of criteria impacting the measure of the safety level of smart grids in four regions of China. Li and Zhang [14] use Entropy method combined with AHP method to calculate the criterion that has the great impact on road traffic capacity, especially with the presence of traffic congestion problem caused mainly to the development of cities in China. Entropy was employed, by Zou et al. [9] to determine of weight of evaluating indicators in water quality assessment of a river. Entropy was utilized by Zhengyuan et al. [30] to calculate weight in Fuzzy Comprehensive Model for Evaluation Research of Regional Power Grid Companies' Operation Capacity based on Entropy Weight. To solve the problem of selecting the best supplier, Safari et al. [31] use entropy to calculate the weight of the criteria and uses PROMETHEE to rank the alternatives. To solve the problem of choosing the best supplier, Pani et al. [55] utilized heuristic method (AET) and a combination of AHP, entropy, (TOPSIS). Based on objective weight measurements obtained using Shannon's entropy, Shemshadi et al. [56] then applies a fuzzy VIKOR (Seeing Kriterijumska Optimizacija I Kompromisno Resenje) method to resolve the problem of supplier selection. Entropy method based TOPSIS method was used by Islamoglu et al. (2015) in Tureky, to measure the financial performance of real estate investment trusts.
There are mainly three steps to respect, cited by Chakraborty and Chatterjee [15] when it comes to the application, of any MCDM method to solve a problem of decision-making:
Indicate the criteria and alternatives of the problem studied.
Determine the measurement of each criterion in relation to the alternatives studied.
Rank the alternatives according to their performance measures.
In addition, the weight of the criteria by the entropy method is given by the following steps, [16][24]:
5527 Step1: The decision matrix which shows the performance of different alternatives Ai
(1,2…m)and respect to various criteria Cj
(j=1,2…n) is formed. For:
)
,
,
2
,
1
;
,
2
,
1
(
i
m
j
n
mn m n n n m ijX
X
X
X
X
X
X
X
X
X
X
1 2 22 21 1 12 11 (3)Step2: The decision matrix is normalized. Beneficial (maximization) and non-beneficial (minimization) are normalized by equation (2) and equation (3) respectively:
For
(
i
1
,
2
,
m
;
j
1
,
2
,
,
n
)
ij
ijij ij ij
X
X
X
X
r
min
max
min
(4)For
(
i
1
,
2
,
m
;
j
1
,
2
,
,
n
)
ij
ij ij ij ijX
X
X
X
r
min
max
max
(5) Step3:Entropy values (ej) are determined for each
criterion:
n
j
m
i
for
1
,
2
;
1
,
2
m i ij ij ijr
r
f
1 (6) And1
0
ln
ln
1
j m i ij ijj
and
e
m
f
f
e
(7)If fij are all the same then the entropy values of each
criterion is the maximum (ej=1), if
f
ijis
0
, thenfijlnfij=0 [17]
Step4: Entropy weights (Wj) are calculated:
1
1
1 1
n j j m i j jj
where
W
e
n
e
W
(8)3.3 Ranking of Values: ROV Method
It is Yakowitz et al. [18] who proposed The range of value (ROV) for the first time in 1993. The ROV method is based on very simple calculation steps, which justifies its use compared to other MCDM methods [19]. The application of the ROV method is very efficient, for decision-makers in the case of quantitative weight problems [20].
Athawale and Chakraborty [21], are conducting a research aimed at selecting the best robot to be used in a given industrial application, while conducting a study of the ranking performance of ten most well-known MCDM methods, among them the ROV method. The ROV method was used by Madić et al. [19] in four cases, to solve cutting fluid selection problems, they find that there was a great correlation between the results obtained using the ROV method and those obtained by previous researchers using others methods of MCDM. To solve a problem of a water management in irrigation district in Mexico, Salazar et al. (1998) compare three multi-criterion decision making techniques: ELECTRE II, Q-analysis and Range of Value (ROV) method [22]. To solve a problem for discrete multi-objective optimization of laser cutting process, Madić et al. [23] use the ROV based Taguchi methodology. Isik and Adalı [24] proposed a combination between the entropy and the the ROV method for resolve a problem of selection of the most appropriate apple for the food company to make apple juice concentrate. In their search Jha et al. [25] proposed ROV method in two examples, to solve a problem of selection of suppliers. It has been applied to problems of watershed management by Yakowitz and Lane [18] , and Yakowitz and Hipel [27]. Hajkowicz and Higgins [20] use the Range of Value (ROV) method, among other methods to solve six water management decision problems.
5528 Step1: The ROV method begins by determining the criteria and alternatives for the problem studied. The decision matrix is presented in Equation (1)
Step2: The decision matrix is normalized by using Eq. (4) and Eq. (5) for beneficial and non-beneficial criteria respectively.
Step 3: The best and worst utility for each alternative are calculated. This is achieved by maximizing and minimizing a utility function. For a linear additive model, the best utility
u
iand theworst utility
u
i of ith alternative are obtained usingthe following equations [20][21] :
Maximize:
j n
j ij
i
r
w
u
1
(9)
Minimize:
j n
j ij
i
r
w
u
1
(10)
Where
w
jare criteria weights which satisfy1
1
nj j
w
andw
j
0
Step 5:
If
u
i
u
i then alternative i outperforms alternative i’ regardless of the actual quantitative weights. If it is not possible to differentiate the alternatives on this basis then a scoring can be attained from the midpoint, which can be calculated as:2
i i iu
u
u
(11)On the basis of ui, that we find the ranking of
alternatives, the one with the highest value of ui is
the best alternative, and the worst alternative is the one with the lowest value of ui
From the above, in the case study, we will apply the combined Entropy-ROV method to obtain the weight of the AKPIs to have a selection of the best Moroccan supplier in automotive sector, in a way, objective and beneficiary.
3.4 Case Study:
3.4.1 Presentation of AKPI’s
In his research, Chahid et al [28], developed a model for Performance measurement system by using Performance Measurement Questionnaire (PMQ) to 28 Moroccan automotive suppliers, AKPI and AHP method to obtain a global formula.
[image:7.612.320.510.414.707.2]The table below shows the Identification of AKPI for each KSF (Key Success Factor) of Moroccan automotive suppliers:
Table 2: Identification of AKPI for each KSF of Moroccan automotive suppliers [28]
KSF AKPI
Customer Orientation Rate of Customer Complaint ( Cc)
Total Quality Scrap Rate (Qs)
Efficiency of Production Systems
Machine Availability (Ma)
Internal Climate Favorable
Absenteeism (Ab)
Health and Safety Number of Occupational
Injuries (Oi) Development of Human
Skills
Training Days Person (Tdb)
The table below shows AKPIs calculation methods:
Table 3: AKPIs calculation methods[28]
AKPI Calculation methods
Cs The number of customer complaints/
one million hours delivered
Qs (Non- conformities total / Parts supplied) * 1 Million = PPM Quality
PPM Quality/ one million hours delivered
Ma Ratio between the actual production time and the total time available.
Ab Number of hours missed/ one million
hours delivered
Oi Number of Occupational Injuries (AT) / one million hours delivered
5529
3.4.2 Pairwise Comparison Matrix :
The pairwise comparison matrix is in the table 3 below:
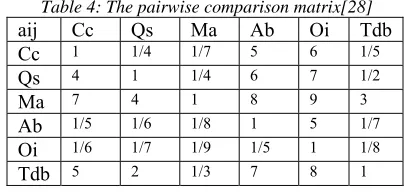
Table 4: The pairwise comparison matrix[28]
aij Cc Qs Ma Ab Oi Tdb
Cc 1 1/4 1/7 5 6 1/5
Qs 4 1 1/4 6 7 1/2
Ma 7 4 1 8 9 3
Ab 1/5 1/6 1/8 1 5 1/7
Oi 1/6 1/7 1/9 1/5 1 1/8
Tdb 5 2 1/3 7 8 1
3.4.3 Beneficial AKPI and non-beneficial AKPI
Before starting the weight calculation by the entropy method, one must first, differentiate between the AKPIs that are beneficial and non-beneficial, the table below shows Beneficial AKPI and Non-Beneficial AKPI.
The table shows Beneficial AKPI and non-Beneficial AKPI.
Tableau 5: Beneficial AKPI and Non-Beneficial AKPI
Beneficial AKPI Non-Beneficial AKPI
Machine Availability (Ma)
Training days per person (Tdb)
Rate of Customer Complaint (Cc) Scrap Rate (Qs) Absenteeism (Ab) Number of Occupational injuries (Oi)
3.4.4 The calculation of AKPI weights by Shannon's entropy method
We specify the maximum: Max and the minimum: Min and Max-Min of each column in pairwise matrix presented in the table3, It’s before to start the normalization of the matrix.
Tableau 6: Max, Min, Max-Min of each colon in pairwise comparison matrix [28]
aij Cc Qs Ma Ab Oi Tdb
Cc 1 0,25 0,142 5 6 0,2
Qs 4 1 0,25 6 7 0,5
Ma 7 4 1 8 9 3
Ab 0,2 0,166 0,125 1 5 0,142
Oi 0,166 0,142 0,111 0,2 1 0,125
Tdb 5 2 0,333 7 8 1
Max 7 4 1 8 9 3
Min 0,166 0,142 0,111 0,2 1 0,125
Max-
Min 6,834 3,858 0,889 7,8 8 2,875
Using equation (4), we calculate the highest values of: Machine Availability (Ma) Training days per person ( Tdb) because they are beneficial AKPI.
We use equation (5) to the smaller values of Rate of Customer Complaint (Cc), Scrap Rate ( Qs), Absenteeism (Ab), Number of Occupational injuries (Oi), because they are non-beneficial AKPI.
[image:8.612.91.295.130.227.2]So the normalization of the pairwise matrix is in the table 6 below:
Table 7: normalization of the pairwise matrix
aij Cc Qs Ma Ab Oi Tdb
Cc 0,877 0,972 0,034 0,384 0,375 0,026
Qs 0,438 0,777 0,156 0,256 0,25 0,130
Ma 0 0 1 0 0 1
Ab 0,995 0,993 0,015 0,897 0,5 0,005
Oi 1 1 0 1 1 0
Tdb 0,292 0,518 0,249 0,128 0,125 0,304
Sum 3,604 4,261 1,456 2,666 2,25 1,466
[image:8.612.95.286.347.434.2]Using equation(6), we calculate Fij, the table below shows the calculation of Fij
Table 8: Calcul of Fij
aij Cc Qs Ma Ab Oi Tdb
Cc 0,243 0,228 0,023 0,144 0,166 0,017 Qs 0,121 0,182 0,107 0,096 0,111 0,088 Ma 0 0 0,686 0 0 0,681 Ab 0,276 0,233 0,010 0,336 0,222 0,004 Oi 0,277 0,234 0 0,375 0,444 0 Tdb 0,081 0,121 0,171 0,048 0,055 0,207
[image:8.612.370.464.576.660.2]Using equation (7), we calculate eij, the table below shows the calculation of eij:
Table 9: Calculate of eij
AKPI ej
Cc 0,845
Qs 0,883
Ma 0,523
Ab 0,772
Oi 0,780
Tdb 0,500
Using equation (8), we calculate Wj, the entropy weights of AKPI by entropy method.
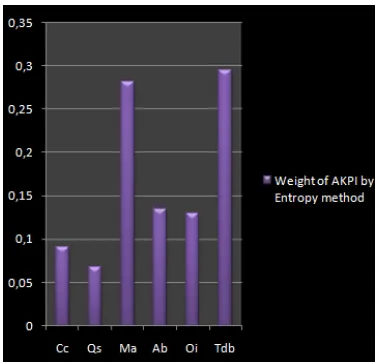
5530 Table10: The weights of AKPI by Entropy method
AKPI Weight of AKPI by Entropy method
Cc 0,091
Qs 0,068
Ma 0,281
Ab 0,134
Oi 0,129
Tdb 0,295
According to the figure 7, the Training days per person: Tdb is the most important criterion with the highest entropy weight, it is the AKPI that has the most objective weight among the other AKPIs.
Then followed by, respectively by Absenteeism (Ab), Number of Occupational injuries (Oi), Rate of Customer Complaint (Cc) and Scrap Rate (Qs). Qs, is the least important criterion with the smallest entropy weight, and it is the AKPI that has the least objective weight among the other AKPIs.
Figure 7: The presentation of weights of AKPI’s by Entropy Method
3.4.5 The Ranking of AKPI’s weights by ROV Method:
Now we use ROV method for ranking AKPIs, Firstly we use the matrix already normalized in table 6, by the two equations( 4) and (5). And we use the weights obtained by the Entropy method in the table 9 to calculate the best and worst utility. According to the equation (9) The best utility
u
i of AKPIs Is in the table 10 below:Table11: Calculation of the best utility of each AKPI
AKPI
i
u
Cc 0,091* [0,034+0,026]
Qs 0,068* [0,156+0,130]
Ma 0,281*[1+1]
Ab 0,134*[0,015+0,005]
Oi 0,129*[0+0]
Tdb 0,295*[0,249+0,304]
According to the equation (9) the worst utility
u
i Of AKPIs Is in the table 11 below. [image:9.612.317.514.246.342.2]
Table 12: Calculation of the worst utility of each AKPI
AKPI
i
u
Cc 0,091*[0,877+0,972+0,384+0,375]
Qs 0,068*[0,438+0,777+0,256+0,25]
Ma 0,281*[0+0+0+0]
Ab 0,134*[0,995+0,993+0,897+0,5]
Oi 0,129*[1+1+1+1]
Tdb 0,295*[0,292+0,518+0,128+0,125]
[image:9.612.100.290.361.542.2]Finally we obtain the final calculation of the utility of each AKPI by using equation (11) shown in the table 12 below:
Table13: Utility of AKPI by ROV Method
AKPI
i
u
u
i
i
u
Cc 0,005 0,237 0,121
Qs 0,019 0,118 0,068
Ma 0,562 0 0,281
Ab 0,002 0,454 0,228
Oi 0 0,519 0,259
Tdb 0,163 0,313 0,238
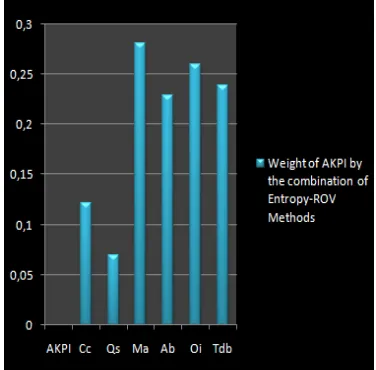
[image:9.612.328.516.604.719.2]We rank the weights in percent of AKPIs by the combination of Entropy-Rov method in the table13 below and we will present them in a figure (8) to analyze it.
Table 14: The rank of the weights in percent of AKPIs by the combination of Entropy-ROV Methods
AKPI
Weight of AKPI by the
combination of
Entropy-ROV Methods Rank
Cc 12,16% 5
Qs 6,89% 6
Ma 28,12% 1
Ab 22,86% 4
Oi 25,95% 2
5531 The figure shows that the Machine Availability (Ma) has the first rank with the weight is equal to 0,28: this means that it is the AKPI which is objective and which has the most utility, among the other AKPIs. Then the Number of Occupational injuries (Oi) has the second rank with the weight is equal to 0,25 . Also, Training days per person ( Tdb) has the third rank with the weight is equal to 0,23. Rate of Customer Complaint (Cc), Scrap Rate ( Qs), Absenteeism (Ab) have the little impact in performance measurement in automotive sector in Morocco.
[image:10.612.344.493.268.320.2]By applying the combination between ROV and entropy methods we find that: Efficiency of Production Systems and Health and Safety are the prior Key Factor of Success which should be take in consideration in Moroccan automotive sector industry
Figure 8: Weights of AKPIs by the combination of Entropy-ROV Methods
3.4.6 Global performance
The global performance (GP) is expressed in the formula below [29]
61
)
*
(
*
100
i i
AKPI
r
P
GP
The formula for overall performance by the combination of Entropy and ROV methods of Moroccan automotive suppliers is calculated as follows:
GP=100*(0,12PCc+0,06PQs+0,28PMa+0,22PAb + 0,25POi+0,23PTdb)
3.4.6 Suppliers selection in automotive sector:
The table below shows the pairwise matrix according to AKPIs [67]:
Table 15: pairwise matrix comparison of suppliers [67]
PCc PQs PMa PAb POi PTdb
Sup1 1 0,9 0,5 0,2 0,8 0,7
Sup2 0,8 0,8 0,7 0,8 0,5 1
Sup3 0,8 0,9 1 0,1 0,5 0,7
For ranking the best supplier among the others, the overall performance of each supplier is calculated using the above formula based on the application of the Entropy-ROV combination.
Table 16: Global Performance of suppliers
Suppliers GP
Sup1 0,719
Sup2 0,871
Sup3 0,738
[image:10.612.100.288.312.497.2]We Rank the suppliers in automotive sector by GP based on Entropy-ROV Methods.
Figure 9: Global Performance of Suppliers
According to the table (15) and figure9, we conclude that Supplier2 has the first rank, followed by supplier 3 and finally supplier 1
4. DISCUSSION
[image:10.612.321.511.366.526.2]5532 The entropy method allowed us to have an objective weight AKPI [9]. The ROV method allowed us to calculate the ranking of AKPI's and to have the best and worst utility of each AKPI according the objective weight calculated by Entropy Method. ROV method does not require complicated calculation, it is simple in use [19].
We have found that the best AKPIs, according to the application of Entropy-ROV methods, are Machine Availability and the Number of Occupational Injuries which correspond respectively to the key success factors Efficiency: Production Systems and Health and Safety. According to the combined method, the two AKPIs are those which have an objective weight, which have more utility, in comparison with others AKPIs. That indicates that these need to be taken into consideration by automotive companies in Morocco. Also, The Entropy-ROV combined method allowed us to calculate the formula for the Global Performance thanks to this formula; we rank the best supplier in the Moroccan automotive sector, we find that the supplier 2 is the best one.
To improve the two key success factors that are health and safety and the system of production, we can create a plan to promote the workplace, train employees and raise awareness by the importance of safety and health at within a Moroccan industrial automotive company. We can also improve the production system while improving the quality and at the same time reducing the losses and minimizing the cost of production.
[image:11.612.96.294.547.682.2]Comparing our results regarding the weights and ranking of AKPI with those obtained from Chahid et al [28], in the table below:
Table 17: Comparison between the weights of AKPI obtained by the Entropy-ROV method and the AHP
method [28] AKPI
Weight of AKPIs by Entropy-ROV method
Rank Weight of AKPIs by AHP method
Rank
Cc 12,16% 5 9% 4
Qs 6,89% 6 17% 3
Ma 28,12% 1 43% 1
Ab 22,86% 4 5% 5
Oi 25,95% 2 2% 6
Tdb 23,87% 3 23% 2
By comparing the weights and the classification of the AKPI obtained by the AHP method carried out by Chahid et al. [28], in his
research, and our study that we conducted, we notice that the results diverge.
"Ma" Machine Availability is the AKPI that ranks first with the two methods mentioned with a weight of 28.12% in the Entropy-ROV combined method and a weight of 43% with the AHP method. For the second rank, it is the Number of Occupational Injuries "Oi" which is the AKPI with the Entropy-ROV combined method with a weight of 25,95%, while for the AHP method it is "Tdb" Training days per person who gets the second rank with a weight of 23%.
The best AKPIs, according to the application of Entropy-ROV methods, are Machine Availability and the Number of Occupational Injuries, which correspond respectively to the key success factors Efficiency: Production Systems, and Health and Safety while for the AHP method are Machine Availability and Training days per person (Tdb) which corresponds to the key success factors Efficiency: Production Systems and Development of Human Skills.
The difference in results is due to the nature of the method used. The Entropy-ROV combined method is used by the Decision Maker in order to have an objective and utilitarian choice at a time, whereas for the AHP it is for a choice that is subjective: The AHP method provides subjective data that is caused by the variation of judgment from one decision maker to another [68].
[image:11.612.325.509.550.645.2]Regarding the comparison of Global Performance and the selection of suppliers, the table below shows the difference in overall supplier performance between the Entropy-ROV combined method and the AHP method:
Table 18: The comparison of the Overall Supplier Performance by the Entropy-ROV method and the AHP
method. Supplier Global
Performance by Entropy-ROV method
Global Performance by AHP method
Sup1 0,719 0,65
Sup2 0,871 0,79
Sup3 0,738 0,83
5533 However, research remains limited as it focuses on choosing the best AKPIs and selecting the best supplier by the Entropy-ROV combined method, but it does not evaluate if there is a capability of the process of delay of purchase in any Moroccan automotive industry.
5. CONCLUSION
The research we conducted through this paper was aimed at two objectives: The first is the application of the Entropy-ROV combined method, for the first time, in the automotive sector in Morocco for the selection of the best AKPI.
After following the steps of the entropy method, we calculated the weight of the AKPI's by this said. The Entropy method is an objective weighting method, which provides an objective weight without considering the decision makers’ preferences [9]. This is how the weights obtained from the AKPI are objective. Then ROV was used to classify the AKPIs. ROV allowed us Ranking of AKPI's. Its mode of use is very easy and it is not complicated [19]. The best and worst utility for each AKPI are calculated: [20] [21]. According to Table 13 and figure 8, we found that the first two AKPIs with the objective weight and highest utility value are Machine Availability (Ma) and the Number of Occupational Injuries (Oi) that corresponds respectively to the Efficiency of Production Systems and Health and Safety. The application of the Entropy-ROV combined method allows the decision maker to choose in an objective and utilitarian way, the best two AKPIs in order to improve the Key success factor which corresponds to its respectively.
Second is that we have established the Global Performance formula that will help us rank the best supplier presented in the table and figure: we have found that the best supplier is supplier 2.
In the Discussion section, we deduce that the results are not the same by comparing our results obtained by the Entropy-ROV combined method, with the results obtained by the AHP method of Chahid et al [28]. This gives the choice to the decision-makers, in case they want a subjective evaluation, they will choose the search of Chahid et al.[28] and if they want an objective and utilitarian choice they will choose our search.
Our contribution in this study that we conducted was to bring an application of a combined quantitative and multi-criteria method called Entropy-ROV, for the first time, in the Moroccan industrial automotive sector in order to choose the best AKPI, keys success factors, even to
evaluate the suppliers in an objective and utilitarian way.
Our motivation for the next study is to evaluate whether there is a capability of the delay of purchase process, in any Moroccan automotive industry with the application of the six-sigma method.
REFERENCES:
[1] P. Moeinzadeh, A. Hajfathaliha, “A Combined Fuzzy Decision Making Approach to Supply Chain Risk Assessment”, International Journal of Mechanical, Aerospace, Industrial, Mechatronic and Manufacturing Engineering, Vol. 3, No. 12, 2009, pp 1631-1647
[2] M. Pirdashti, A. Ghadi, M. Mohammadi, G. Shojatalab, “Multi-Criteria Decision-Making Selection Model with Application to Chemical Engineering Management Decisions”, International Journal of Chemical and Molecular Engineering, Vol. 3, No. 1, 2009, pp 1-6.
[3] Ü. Şengül, M. Eren, S. E. Shiraz, V. Gezder, A. B. Şengül, “Fuzzy TOPSIS method for ranking renewable energy supply systems in Turkey”, Renewable Energy, Vol. 75, 2015, pp 617-625
[4] A. Soltani, K. Hewage, B. Reza, R. Sadiq, “Multiple stakeholders in multi-criteria decision-making in the context of Municipal Solid Waste Management: A review”, Waste Management , Vol. 35, 2015, pp 318-328 [5] R. Rajesh, V. Ravi, “Supplier selection in
resilient supply chains: A grey relational analysis approach”, Journal of Cleaner Production, Vol. 86, 2015, pp 343-359.
[6] R. A. Ghunem, M. Hamid, S. H. Jayaram, R. Seethapathy, A. Naderian, “Transformer Insulation Risk Assessment Under Smart Grid Environment Due to Enhanced Aging Effects, in 2011 IEEE Electrical Insulation Conference (EIC), 2011, pp. 276-279.
[7] C. E. Shannon , “ A mathematical theory of communications”, Bell Systems Technical Journal, Vol. 27,1948, pp. 379-423, 623-656. [8] Pomerol, J-C and Romero, S. B. (2000),
“Multicriterion Decision in Management: Principles and Practice”, Klumer Academic Publishers.
5534 Environmental Sciences, Vol. 18, No. 5, 2006, pp 1020-1023
[10]X. Chuansheng, D. Dapeng, H. Shengping, X. Xin, C. Yingjie, “Safety Evaluation of Smart Grid based on AHP-Entropy Method”, Systems Engineering Procedia The 2nd International Conference on Complexity Science &
Information Engineering, Vol. 4, 2012, pp
203-209.
[11]W. Liu, J. Cui, “Entropy Coefficient Method to Evaluate the Level of Sustainable Development of China's Sports”, International
Journal of Sports Science and Engineering,
Vol. 02, No. 2, 2008, pp 72-78.
[12]M. Luo, S. Zhao, J. Jiang, W. Xu, “Research on Intensive Land-use Evaluation Model for Districts and Counties Based on AHP and ENTROPY”, in IEEE International Conference on Information Management, Innovation Management and Industrial Engineering, V. 3, 2009, pp 153-157.
[13]N. Hamidi, P. M. Pezeshki, A. Moradian, “Weighting the criteria of brand selecting in beverage industries in Iran”, Asian journal of
management research , Vol.1, No. 1, 2010, pp
250-267
[14]Y. P. LI, X. ZHANG, “RESEARCH on
Comprehensive Decision Model Based on Analytic Hierarchy Process and Entropy Method”, 3rd Annual International Conference
on Modern Education and Social Science,
2017, pp 19-23.
[15]C. Chakraborty, & P. Chatterjee, “Selection of materials using multi-criteria decision-making methods with minimum data”, Decision Science Letters, Vol. 2, No. 3, 2013, pp 135-148.
[16]X. Li, K. Wang, L. Liu, J. Xin, H. Yang, C. Gao, “Application of the entropy weight and TOPSIS method in safety evaluation of coal mines”, in Procedia Engineering First International Symposium on Mine Safety
Science and Engineering, ,Vol. 26, 2011, pp 2085-2091
[17]J. Wu, J. Sun, L. Liang, Y. Zha, “Determination of weights for ultimate cross efficiency using Shannon entropy”, Expert Systems with Applications, Vol. 38, No. 5, 2011, pp 5162-5165.
[18] D. S Yakowitz, L. J. Lane, F. Szidarovszky, “Multi-attribute decision making: dominance with respect to an importance order of the attributes”, Applied Mathematics and Computation, Vol.54, No. 2-3, 1993, pp 167-181.
[19]M. Madić, M. Radovanović, M. Manić, “Application of the ROV method for the selection of cutting fluids”, Decision Science Letters, Vol. 5, No. 2, 2016, pp 245-254 [20]S. Hajkowicz & A. Higgins, “A comparison of
multiple criteria analysis techniques for water resource management”, European journal of operational research, Vol.184, No. 1, 2008, pp 255-265.
[21]V. M. Athawale, S. Chakraborty, “A comparative study on the ranking performance of some multi-criteria decision-making methods for industrial robot selection”, International journal of industrial engineering computations, Vol. 2, No. 4, 2011, pp 831-850.
[22]Salazar, R. Yakowitz, D. & Duckstein, L. (1998). Comparison of several multi-objective techniques to optimize water management in an irrigation district in Quanajuato, Mexico, Multiple Objective Decision Support Systems for Land, Water, and Environment, 1225.] [23]M. Madić, M. Radovanović, M. Coteata, P.
Janković, D. Petković, “ Multi-Objective optimization of Laser Cutting Using ROV-Based Taguchi Methodology”, Applied
Mechanics and Materials, Vol. 809-810, 2015,
pp 405-410.
[24]A. T. Işık, E. A. Adalı, “The Decision-Making Approach Based on the Combination of Entropy and Rov Methods for the Apple Selection Problem”, European Journal of Interdisciplinary Studies, Vol. 8, No. 1, 2017, pp 81-86.
[25]G. K. Jha, P. Chatterjee, S. Chakraborty, “Suppliers selection in manufacturing environment using Range of Value Method”, I-Manager's Journal on Mechanical Engineering, Vol. 3, No. 3, 2013, pp 15-22. [26]P. Heilma, D.S Yakowitz, L.J. Lane,
“Targeting farms to improve water quality”,
Applied Mathematics and Computation, Vol.
83, No. 2-3, 1997, pp 173–194.
[27]D.S. Yakowitz, K.W. Hipel, “Multiple objective decision making for Lokahi (balance) in environmental management”,
Applied Mathematics and Computation, Vol.
83, No. 2-3, 1997, pp 97-115.
[28]M. T. CHAHID, J. EL ALAMI, A. SOULHI & N. EL ALAMI, “Performance Measurement Model for Moroccan Automotive Suppliers Using PMQ and AHP”, Modern Applied Science, Vol. 8, No.6, 2014, pp 137-152 [29]C. C. Chen, “An Objective-Oriented and
5535 Performance Measurement”, International
Journal of Production Economics,Vol. 112,
No. 1, 2008, pp 380-390
[30]J. Zhengyuan, W. Chunmei, H. Zhiwei, & Z. Gang, Z, “Evaluation research of regional power grid companies’ operation capacity based on entropy weight fuzzy comprehensive model”, Procedia Engineering, Vol.15, 2011, pp 4626-4630
[31]H. Safari, M.S. Fagheyi, S.S. Ahangari, & M.R. Fathi, “Applying PROMETHEE method based on entropy weight for supplier selection”, Business management and strategy, Vol. 3, No. 1, 2012, pp 97-106.
[32]M. R. Galankashi, S. A. Helmi, P. Hashemzahi, “Supplier selection in automobile industry: A mixed balanced scorecard–fuzzy AHP approach”, Alexandria Engineering Journal, Vol. 55, 2016, pp 93-100
[33]A. Beşkese, A. Şakra, “A MODEL PROPOSAL FOR SUPPLIER SELECTION IN AUTOMOTIVE INDUSTRY”, 14th
International Research/Expert Conference Trends in the Development of Machinery and Associated Technology” TMT 2010, 2010, pp 809-812
[34]A. Aksoy, & N. Ozturk, “Supplier selection and performance evaluation in just-in-time production environments”, Expert Systems with Applications, Vol. 38, No. 5, 2011, pp 6351-6359
[35]D. Golmohammadi, “Neural network application for fuzzy multi-criteria decision making problems”, International Journal of
Production Economics, Vol. 131, No. 2, 2011,
pp 490-504.
[36]S. Percin, “An application of the integrated AHP–PGP model in supplier selection”, Measuring Business Excellence, Vol. 10, No. 4, 2006, pp 34-49
[37]T.J. Kull & S. Talluri, “A supply-risk reduction model using integrated multicriteria decision making”, IEEE Transactions on
Engineering Management, Vol. 55, No. 3,
2008, pp 409-419.
[38]K. Shahanaghi, S. A. Yazdian, “Vendor selection using a new fuzzy group TOPSIS approach”, Journal of Uncertain Systems, Vol. 3, No. 3, 2009, pp 221-231.
[39]F. Jolai, S. A. Yazdian, K. Shahanaghi, M. A. Khojasteh, “Integrating fuzzy TOPSIS and multi-period goal programming for purchasing multiple products from multiple suppliers”, Journal of Purchasing & Supply Management, Vol. 17, No. 1, 2011, pp 42-53
[40]F. R. L. Junior, L. Osiro, L.C.R. Carpinetti, “A comparison between fuzzy AHP and fuzzy TOPSIS methods to supplier selection”, Applied Soft Computing, Vol. 21, 2014, pp 194-209.
[41]M. Zeydan, C. Çolpan , C. Cobanoglu, “A combined methodology for supplier selection and performance evaluation”, Expert Systems with Applications, Vol. 38, 2011, pp 2741– 2751.
[42]M. Bevilacqua, F. E. Ciarapica, G. Giacchetta, “A fuzzy-QFD approach to supplier selection”, Journal of Purchasing and Supply
Management, Vol. 12, No. 1, 2006, pp 14–27.
[43]G.A. Keskin, S. Ilhan, C. Ozkan, “The fuzzy ART algorithm: A categorization method for supplier evaluation and selection”, Expert Systems with Applications, Vol. 37, No. 2, 2010, pp 1235-1240.
[44]N. Jamil, R. Besar, H. K. Sim, “A Study of Multi-criteria Decision Making for Supplier Selection in Automotive Industry”, Journal of Industrial Engineering, Vol. 2013, 2013,pp 1-23
[45]I. Dogan, N. Aydin, “Combining Bayesian networks and total cost of ownership method for supplier selection analysis”, Computers and Industrial Engineering, Vol. 61, No. 4, 2011, pp 1072-1085.
[46]P. Parthiban, H. A. Zubar, C. P. Garge, “A multi criteria decision making approach for suppliers selection”, Procedia Engineering, Vol. 38, 2012, pp 2312–2328.
[47]F. Dweiri, S. Kumarb, S. A. Khana, V. Jainc, “Designing an integrated AHP based decision support system for supplier selection in automotive industry”, Expert Systems With Applications , Vol. 62, 2016, pp 273–283 [48]M. K. Sagar, D. Singh, “Supplier Selection
Criteria: Study of Automobile Sector in India”, International Journal of Engineering Research
and Development, Vol. 4, No. 4, 2012, pp
34-39
[49]J. D. Huang, M. H. Hu, “Two-stage solution approach for supplier selection: A case study in a Taiwan automotive industry”, International Journal of Computer Integrated Manufacturing, Vol. 26, No. 3, 2013, 237-251. [50]D. Bonet, A. Boissinot, Quel leadership pour les prestataires de services logistiques dans la supply chain de l’automobile ? Logistique & Management, Vol. 20, 2012
5536 in Morocco”, International Business Research, Vol. 6, No. 11, 2013, pp 15-28
[52]DEPF (Direction des Etudes et des Prévisions Financières). (2015). Le secteur automobile au Maroc: Vers un meilleur positionnement dans la chaine de valeur mondiale. Ministère de
l’Economie et des Finances,
http://www.finances.gov.ma/Docs/2015/DEPF /Note%20automobile.pdf
[53]M. Braglia, A. Petroni , “A quality assurance-oriented methodology for handling trade-offs in supplier selection”, International Journal of Physical Distribution and Logistics
Management, Vol. 30, No. 2, 2000, pp 96-112
[54] S. Sharma, “Vendor Development Process in Automobile Industry in India: A Comparative Study”, International Journal of Advance Research in Computer Science and Management Studies, Vol. 1, N. 6, 2013, pp 118-124
[55]M. R. Pani, R. Verma, G. Sahoo, “A heuristic method for supplier selection using AHP, entropy and TOPSIS”, International Journal of Procurement Management, Vol. 5, No. 6, pp 784-796.
[56]A. Shemshadi, H. Shirazi, M. Toreihi, M.J. Tarokh, “A fuzzy VIKOR method for supplier selection based on entropy measure for objective weighting”, Expert Systems with Applications, Vol. 38, No. 10, 2011, pp 12160-12167
[57]M. Islamoglu, M. Apan, A. Oztel, “An evaluation of the financial performance of REITs in Borsa Istanbul: A case study using the entropy-based TOPSIS method”, International Journal of Financial Research, Vol. 6, No. 2, 2015, pp 124-138.
[58] L. A. Moralez, L. H. Favela, “Thermodynamics and Cognition: Towards a Lawful Explanation of the Mind”, Proceedings of the 38th Annual Conference of the Cognitive Science Society , 2016, pp 948-953, https://mindmodeling.org/cogsci2016/papers/0 173/paper0173.pdf
[59]C. Shannon, W. Weaver, “The Mathematical Theory of Communication”, 1949, Urbana and Chicago: University of Illinois Press.
[60]
http://philsci-archive.pitt.edu/10911/1/What_is_Shannon_In formation.pdf
[61]D.L. Mon, C.H. Cheng, J.C. Lin, “Evaluating weapon system using fuzzy analytic hierarchy process based on entropy weight”, Fuzzy sets and systems, Vol. 62, No 2, 1994, pp 127-134.
[62]L. Boltzmann, (1886/1974), “The second law of thermodynamics in Theoretical Physics and Philosophical Problems Selected Writings, 1974, pp 12-32, In D. McGuinness (Ed.),: Boston, MA: D. Reidel Publishing Company. [63]J. B. Brissaud, (2005). The meanings of
entropy. Entropy, 7, 68-96.
[64]Georgeta Vidican, Tina Hahn, “The effectiveness of Morocco’s Industrial Policy in Promoting a National Automotive Industry”,
2017, pp 14,
https://www.die-gdi.de/uploads/media/DP_27.2017.pdf [65]https://www.google.com/maps [66] 3ème assises de l’industrie, 2013
[67]M. T. CHAHID, M. HLYAL, J. EL ALAMI, “Performance Measurement Model in the supply chain context: The Aggregation approach based on the Nonadditive Fuzzy Sugeno Integral in the Selection of Moroccan Automotive Suppliers”, Advances in Computational Intelligence, 2015, pp 76-82 [68]F. De Felice , M. H. Deldoost, M.
Faizollahi, A. Petrillo, “Performance Measurement Model for the Supplier Selection Based on AHP”, International Journal of Engineering Business Management, 2015, Vol. 7, pp 1-13
![Figure 2: Evolution of automotive exports between 2007-2013 [52]](https://thumb-us.123doks.com/thumbv2/123dok_us/8902536.955460/2.612.101.290.242.424/figure-evolution-automotive-exports.webp)
![Figure 6: Parts of system communication according to Shannon’s theory [7][59]](https://thumb-us.123doks.com/thumbv2/123dok_us/8902536.955460/5.612.92.300.70.307/figure-parts-communication-according-shannon-s-theory.webp)
![Table 2: Identification of AKPI for each KSF of Moroccan automotive suppliers [28]](https://thumb-us.123doks.com/thumbv2/123dok_us/8902536.955460/7.612.320.510.414.707/table-identification-akpi-ksf-moroccan-automotive-suppliers.webp)
![Table 17: Comparison between the weights of AKPI obtained by the Entropy-ROV method and the AHP method [28]](https://thumb-us.123doks.com/thumbv2/123dok_us/8902536.955460/11.612.96.294.547.682/table-comparison-weights-akpi-obtained-entropy-method-method.webp)
