CONTENT BASED IMAGE RETRIEVAL USING MULTI
REGION FEATURES
1TALLURI. SUNIL KUMAR,2T.V.RAJINIKANTH,3B. ESWARA REDDY
1VNR Vignana Jyothi Institute of Engineering and Technology, Hyderabad, Telangana, India 2SNIST, Hyderabad, Telangana India.
3Professor in CSE and Principal, JNTU-A College of Engineering, Kalikiri, Chittoor Dist, Andhra. Pradesh, India.
Email:1[email protected],2[email protected] ,3[email protected]
ABSTRACT
In this paper an integrated method that brings together the image features form color, shape and texture is proposed for content based image retrieval (CBIR). The present paper converts the color image in to HSV color space and derives color histograms. The V color space of the image is divided into non over-lapping region of size 9x9. Each region is sub divided into nine non overlapped sub-regions and a feature vector is derived on each sub region. These feature vectors of each sub region compresses the 9x9 multi-region into 3x3. To derive shape feature, textons are computed on each 2x2 grid and the image is converted into “multi region texton matrix” (MRTM). The gray level co-occurrence matrix (GLCM) features are derived on MRTM and the image retrieval is performed on five categories of Wang database images by combining color histograms and the GLCM features of MRTM. The proposed method of CBIR is compared with GLCM and texton co-occurrence method (TCM) and results indicates the efficacy of the proposed method.
Key words:Texton, HSV, GLCM features, sub regions
1. INTRODUCTION
The exhaustive, low priced and efficient technological growth of image capturing devices made the availability of huge digital image databases or libraries. These digital libraries are expanding drastically day by day. The handling and accessing of these data base images by human annotations is impractical and it has led to the automatic search mechanisms and it has created a demand for content based image retrieval (CBIR) models. The traditional text based image retrieval models, retrieves an image using the key words that are used to annotate the images in the database. This is replaced by the content based image retrieval (CBIR) methods. In CBIR an image is retrieved by the visual contents of the image i.e. color, shape, texture and spatial distribution of intensities (low level features) etc. These low level features can be local, region or global. A good literature survey was conducted on CBIR and is available in [1-4]. The color is one of the significant feature of the CBIR and one of the simple color based CBIR is the color histogram [5]. The retrieval performance of this generally limited due to its low discrimination power mainly on immense data. To improve this various color
descriptors are proposed in the literature using neural networks [6], DCT- domain vector quantization [7], supervised learning [8] and color edge co-occurrence histograms [9].
has to specify the region of interest (ROI), and based on this the features are derived on this ROI and compared with the database images. The main drawback of ROI based methods [20, 21, 22, 23] is that it only compares the blocks having similar spatial locations. Therefore blocks that are not part of ROI are not retrieved. In the method [22] the ROI are not directly identified by the user. These methods [20 21, 24] fail to provide a detailed level of relative locations similarity measure and also they increase computational complexity. Recently various pattern based features i.e. local maximum edge patterns [25], local tetra patterns [26] and directional local extreme patterns [27] are proposed for natural images. The pattern based features are also proposed for retrieving of medical images i.e. directional binary wavelet pattern [28], local mesh patterns [29] and local ternary co-occurrence patterns [30]. The block based methods using LBP texture descriptors are proposed by Takalo et al. [31] for CBIR. The CBIR on region of interest (ROI) using center symmetric local binary pattern (CS-LBP) which is on extension of LBP [32] is also proposed [33]. The present paper divides the image into multi regions and evaluates the features on each sub region instead of from each pixel. This provides the detailed relative location similarity and reduces the computational complexity. The present method is not based on ROI.
The preset paper is organized in the following way. The brief review of image retrieval, literature survey are given in section one. The second section describes the proposed IR frame work by elaborating multi region, texton and the derivation of MRTM model. The third section describes the results and discussions. The fourth section gives the conclusions.
2. PROPOSED FRAME WORK
2.1. The HSV (Hue, Saturation, Value) Color Space:
HSV closely corresponds to the human visual perception of color. The HSV color space can be represented as a three-dimensional hexacone, where the central vertical axis represents intensity which takes a value between 0 and 255 (Shapiro & Stockman, 2001). Saturation is the depth or purity of color. For zero saturation, as we move higher along the intensity axis, we go from black to white through various shades of gray. On the other hand, for a given intensity and hue, if the saturation is changed from zero to one, the perceived color
changes from a shade of gray to the most pure form of the color represented by its hue. When saturation is near zero, all pixels, even with different hues, look alike and as we increase the saturation towards one, they tend to get separated out and are visually perceived as the true colors represented by their hues. Thus, the effect of saturation may be considered as that of introducing visual shadows on the image for any given value of hue and intensity.
2.2 Multi Region model
set of multi region can make the overall process to be simple.
The region based methods are more applicable when working with images of large size and especially in real time environment. The present paper considered a region of size 9x9 and sub divided into 3 non overlapped sub-regions of size 3x3 and a feature vector is derived on each sub region. The present paper derived a single feature from each sub region i.e. the average gray level value of that sub region. There are several advantage of this average operator on each sub-regions: (1) It is more robust than LBP; (2) it encodes not only microstructures but also macrostructures of image patterns, and hence provides a more complete image representation than the basic LBP operator; and (3) MR model with average operator can be computed very efficiently using integral images. That’s why the MR feature extraction can also be very fast: 4) MR features are more discriminative than Haar-like features and original LBP features. The transformation process of multi-region of size 9x9 into a region of size 3x3 is shown in Fig. 1.
90 70 15 40 75 65 78 90 15
65 10 75 25 90 19 25 45 55
15 28 10 19 25 12 13 18 15
65 25 34 15 26 38 48 46 75
15 26 35 48 98 10 23 54 65
87 75 48 15 29 63 14 18 96
42 13 16 18 26 29 27 26 38
80 76 94 89 17 69 92 64 99
75 48 66 52 71 13 98 68 92
Fig. 1 (a) The sub region of multi region.
42 41 39 4 5 5
45 38 49 4 3 4
57 43 67 4 4 4
1 (b) The transformed
multi region image
1(c ) quinary
multi region image
The present paper quantized the multi region neighborhood into quinary or five elements ranging from 1 to 5 i.e. {1, 2, 3, 4, 5} by using thresholds among the centre pixel (center sub region of MR) and the neighboring pixels (neighboring sub region of MR) based on the following equation 1.
( , ) =
⎩ ⎪ ⎨ ⎪
⎧1 ( , ) <2 ( , ) < ( , ) ≤( , ) >
3 ( , ) =
4 ( , ) > ( , ) >
5 ( , ) > ( , ) ≤
(1)
Where w is the grey level value of the centre pixel of the multi region and R (i,j) is the neighboring pixel grey level value a and b are the two thresholds.
The aim of this quinary multi region texture element representation {1, 2, 3, 4,5} is to deal precisely and accurately with regions of natural images in the presence of dissimilar digitization process and noise. This quinary quantization on MR features also help to extract more local texture information from the pixels and also to represent textons efficiently.
2.3 Computation of Multi Region Texton Matrix (MRTM)
The fundamental element of an image or in a raster screen is the pixel. A pixel is represented by its two dimensional co-ordinate positions and with a value that represents its brightness. It is found that, it is very difficult to obtain satisfactory results, of image processing, by designing algorithms that process the images based on pixel levels. More over this processing system fail in representing the shape component totally. Therefore inorder to improve the image retrieval performance, the present paper presents the texton based methods. Julesz [40] proposed the concept of textron’s twenty years back and they represent the relationship between pixels in the form of shape component, however defining a texton is still a difficult task. Texton is one of the popular and significant shape primitives and is defined with certain placement rule. The textons represents the emergent and dominant patterns on a local neighborhood. The previous step generates a multi-region based texture image with five quantized levels or patterns {1,2,3,4,5}. The present step evaluates the textons on this. The texton based models are widely used in texture classification [41, 42], image retrieval [43, 44], face recognition [45, 46], age classification [47], facial expression recognition [48, 49] and image segmentation [50]. The reason for this popularity is due to the maintenance of close relationship with image attributes and local distribution of textons.
[image:3.612.81.290.396.568.2]features. If the textons in image are small and the tonal differences between neighboring textons are large, a fine texture may result. If the textons are superior and holds quite a few pixels then it results a coarse texture and it also depends on scale [51]. In the image if the textons are large and contains a small number of texton categories, then a shape may result. There can be numerous types of textons in image. In this paper, we only classify and make use of seven special types of textons that holds all the four or two neighboring pixels on a 2 x 2 windows or grid. The pixels of the grid are denoted as V, W, X and Y. The seven types of textons are denoted as S1, S2, S3, S4, S5,S6and S7(Fig.2).
V W X Y
(a) S1 S2 S3 S4
[image:4.612.86.305.276.379.2]S5 S6 S7
Fig.2: The texton patterns used in this paper (a) 2x2 window of the image S1 to S7 : different texton patterns.
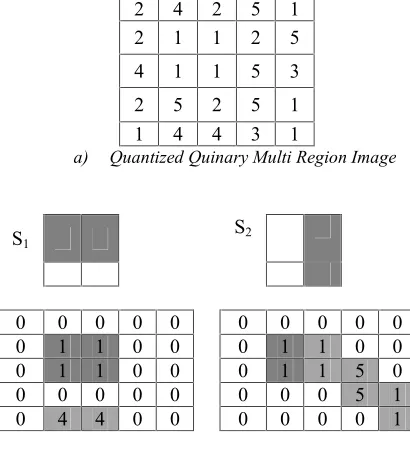
2 4 2 5 1
2 1 1 2 5
4 1 1 5 3
2 5 2 5 1
1 4 4 3 1
a) Quantized Quinary Multi Region Image
a) Detection Of Textons S1, S2, S3, S4On Quinary
Multi Region Image Of (A)
(C) Computation Of Textons S5, S6And S7On
Quinary Multi Region Image Of (A)
2 0 2 5 0 2 1 1 2 5 0 1 1 5 0
0 0 0 5 1
0 4 4 0 1
d) Formation of MRTM (Final Texton image) using S1, S2, S3, S4, S5, S6and S7 . Fig. 3: Computation Of MRTM From Quinary Multi
Region Image.
The process of texton identification is shown in Fig.3. The present paper used the seven types of textons to detect every grid. A particular texton
S1 S2
0 0 0 0 0 0 0 0 0 0
0 1 1 0 0 0 1 1 0 0
0 1 1 0 0 0 1 1 5 0
0 0 0 0 0 0 0 0 5 1
0 4 4 0 0 0 0 0 0 1
S3 S4
0 0 0 0 0 2 0 0 0 0
0 1 1 0 0 2 1 1 0 0
0 1 1 0 0 0 1 1 5 0
0 0 0 0 0 0 0 0 5 0
0 4 4 0 0 0 0 0 0 0
S5 S6
0 0 2 5 0 0 0 0 0 0
0 1 0 2 5 0 0 1 0 5
0 0 1 0 0 0 1 0 5 0
0 0 0 0 0 0 0 0 0 0
0 0 0 0 0 0 0 0 0 0
S7
0 0 0 0 0
0 1 1 0 0
0 1 1 0 0
0 0 0 0 0
[image:4.612.86.291.425.661.2]detection process is performed on a 2 x 2 grid in overlapped manner (shifting right by one column position then row by one position down) and if the texton is detected the pixels of textons are kept with original values and others are replaced with zeros. The same process is repeated for all seven categories and it is shown in Fig 3. The MRTM (final texton) image (Fig. 3d) will be formed by combining these seven types of texton images (Fig. 3b & 3c).
2.4 Computation of GLCM Features on MRTM On MRTM image, the co-occurrence matrix is formed with a distance D and with an angle 00,450,900 and 1350. This results a multi-region texton co-occurrence matrix (MRTCM) and this process of formation is shown in Fig.4. The GLCM features i.e. entropy, energy, contrast, local homogeneity and correlation (equations 2,3,4,5 and 6) are computed on MRTCM with 00,450,900and 1350 orientations and average feature values of these orientation are listed in the feature library. In order to extract color information the present paper also quantized the original image using HSV color space.
2 0 2 5 0
2 1 1 2 5
0 1 1 5 0
0 0 0 5 1
0 4 4 0 1
4(A) MRTM Of Fig. 3(D).
0 1 2 3 4 5
0 R(0,0) R(0,1) R(0,2) R(0,3) R(0,4) R(0,5) 1 R(1,0) R(1,1) R(1,2) R(1,3) R(1,4) R(1,5) 2 R(2,0) R(2,1) R(2,2) R(2,3) R(2,4) R(2,5) 3 R(3,0) R(3,1) R(3,2) R(3,3) R(3,4) R(3,5) 4 R(4,0) R(4,1) R(4,2) R(4,3) R(4,4) R(4,5) 5 R(5,0) R(5,1) R(5,2) R(5,3) R(5,4) R(5,5)
4(B)
(0 , = 1) =
⎣ ⎢ ⎢ ⎢ ⎢
⎡2 2 1 0 1 10 2 1 0 0 1
1 1 0 0 0 2 0 0 0 0 0 0 1 0 0 0 1 0
2 1 0 0 0 0⎦⎥
⎥ ⎥ ⎥ ⎤
(45 , = 1) =
⎣ ⎢ ⎢ ⎢ ⎢
⎡1 4 0 0 0 10 1 2 0 0 1
2 0 0 0 0 0 0 0 0 0 0 0 1 0 0 0 0 1
1 0 0 0 0 1⎦⎥
⎥ ⎥ ⎥ ⎤
(90 , = 1) =
⎣ ⎢ ⎢ ⎢ ⎢
⎡2 1 0 0 2 02 2 0 0 0 0
1 1 1 0 0 1 0 0 0 0 0 0 0 0 0 0 0 0
1 0 1 0 0 1⎦⎥
⎥ ⎥ ⎥ ⎤
R(135 , = 1) =
⎣ ⎢ ⎢ ⎢ ⎢
⎡2 1 0 0 2 01 1 0 0 0 2
1 2 1 0 0 0 0 0 0 0 0 0 0 0 0 0 0 0
0 2 0 0 0 1⎦⎥
⎥ ⎥ ⎥ ⎤
4(c)
Fig.4.The Flow Chart Of The Multi Region Texton
Co-Occurrence Matrix (MRTCM): A) MRTM Of Fig. 3(D) (B) The MRTCM Image (C) Four Directional MRTCM.
Entropy = ∑, −ln(P )P (2)
Energy = ∑, −ln(P ) (3)
Contrast = ∑, P (i − j) (4)
Local Homogenity = ∑, ( )
(5)
Correlation = ∑, P ( )( ) (6)
where Pij is the pixel value in position (i,j) of the texture image, N is the number of gray levels in the image, µ is = ∑, mean of the texture
image and is = ∑, ( − ) variance
of the texture image.
2.5 Image Retrieval Algorithm The proposed algorithm is given below
Input: Query image Output: Retrieval of similar images
1. Convert the RGB image into HSV color space. 2. Divide the v-color space image into non
overlapped regions of size 9 x 9.
3. Divide the region in to sub regions and derive feature vector based on average operator. 4. Quantize each region into quinary values
based on thresholds.
6. Derive multi-region texton co-occurrence matrix (MRTCM) with various distances. 7. Compute GLCM features on MRTCM. 8. Compute the histograms for H, S and V color
spaces.
9. Construct feature vector by concatenating histograms for H, S and V color spaces with MRTCM features.
10. Compare the features of query image with the images in the database using similarity measurement.
11. Retrieve the images based on nearest distance or best matches.
2.6 Query Matching
The present retrieval model selects 16 top images from the database images that are matching with query image. And also experimented with more number of top images and retrieval performance is measured. This is accomplished by measuring the distance between the query image and database images. The present paper used Euclidean distance as the distance measure and as given below
( , ) = ∑, ( ) − ( )
/
(7)
Where Tnquery image, Inimage in database; The database image is used as the query image in our experiments. If the retrieved image belongs to the same category as that of query image we say that the system has suitably identified the predictable image otherwise the system fail to find the image. The performance of the present model is evaluated in terms of precision and recall rate. Precision is the ratio of number of retrieved images (INR), vs the number of relevant images retrieved (IRR). The recall is the ratio of total number of relevant images in the database (ITR) vs IRR.
Precision - P= ( IRR / INR) (8)
Recall –R = ( IRR / ITR) (9)
3. RESULTS AND DISCUSSION
In order to efficiently investigate the performance of the present retrieval model, we have considered the WANG database [52]. Wang is a subset of Corel stock photo database. In the WANG database the images have been manually chosen. This data
base consists of 5 classes of images and 100 images per each class. The present paper used these 5 classes of images for relevance assessment. For a query image the relevant images are assumed to be the remaining 99 images of the same class. The images from all other classes are treated as irrelevant images. The hefty size of each class and the heterogeneous image class contents made WANG data base as one of the popular database for image retrieval.
The present paper compute GLCM features on MRTCM using various distance values:D= 1, 2, . . . , 7. The average precision and recall rates of all classes of images are computed based MRTCM features and color histograms and listed in Tables 1 and 2. The best performance of MRTM with color histograms was obtained whenD= 4.
The retrieval performance of the MRTCM is compared with GLCM[54], color correlogram [53] and texton co-occurrence matrix [43]. The present paper selected 60 images of the same category or class as query images (one by one) and computed precession and recall rates by selecting top 16, 25, 35, 45, 55,65,75,85 and 95 images. The average precession rates of GLCM, CCG and TCM are ranging from 38% to 45%, 39% to 46% and 60% to 64% for number of images retrieved INR=16 (Table 1 & 2). The average precession and recall rates are plotted in graphs (Fig. 5 and 6) by varying INR.The present paper also computed image retrieval accuracy as defined below (equation 10).
Table 1: Average Precision Rate Of All Classes Of
[image:7.612.83.534.77.413.2]Images With Various Distance Measures For IRR=16.
Table 2: Average Precession Rate On Each Class Of
Images For D=4 For IRR=16.
Method
s Image category and the precision (%). Afri
ca Beach Monu men ts
Bus
es Dinosaurs Avera ge
GLCM 0.39 0.42 0.44 0.48 0.5 0.45
CCG 0.4 0.43 0.46 0.49 0.52 0.46
TCM 0.61 0.6 0.66 0.67 0.7 0.64
MRTC M with color histogra ms
[image:7.612.336.540.398.617.2]0.64 0.65 0.74 0.77 0.79 0.72
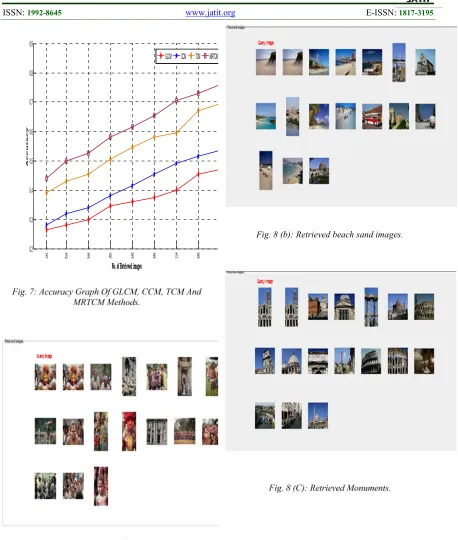
Fig. 5: Average Performance Curve (Precision) Using GLCM, TCM And MRTCM Method With D=4.
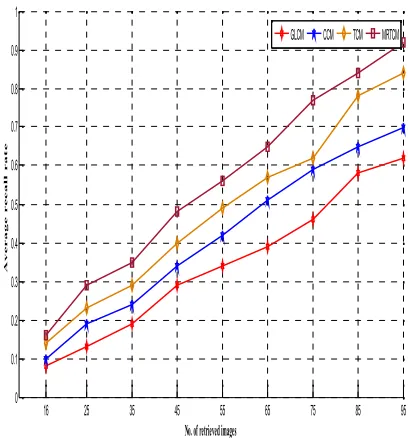
Fig. 6: Average Performance Curve (Recall) Using GLCM, TCM And MRTCM Method With D=4.
16 25 35 45 55 65 75 85 95
0.35 0.4 0.45 0.5 0.55 0.6 0.65 0.7 0.75
No. of retrieved images
A
ve
r
age
p
r
e
c
i
s
i
on
r
at
e
GLCM CCG TCM MRTCM
16 25 35 45 55 65 75 85 95
0 0.1 0.2 0.3 0.4 0.5 0.6 0.7 0.8 0.9 1
No. of retrieved images
A
ve
r
age
r
e
c
al
l
r
at
e
GLCM CCM TCM MRTCM Distance parameter
Methods D=1 D=2 D=3 D=4 D=5 D=6 D=7
GLCM 0.38 0.41 0.42 0.45 0.44 0.43 0.43
CCG 0.39 0.41 0.44 0.46 0.45 0.44 0.43
TCM 0.60 0.61 0.63 0.64 0.63 0.61 0.62
MRTCM with color
Fig. 7: Accuracy Graph Of GLCM, CCM, TCM And MRTCM Methods.
Fig. 8 (A): Retrieved African Images.
Fig. 8 (b): Retrieved beach sand images.
Fig. 8 (C): Retrieved Monuments.
16 25 35 45 55 65 75 85 95
0.2 0.3 0.4 0.5 0.6 0.7 0.8 0.9
No. of Retrieved images
A
c
c
u
r
a
c
y
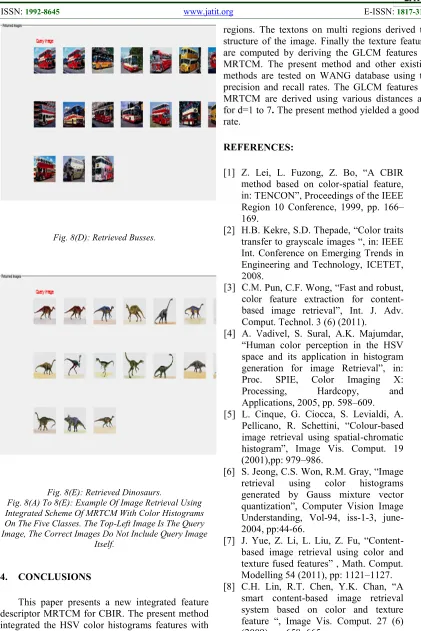
[image:8.612.88.546.69.609.2]Fig. 8(D): Retrieved Busses.
Fig. 8(E): Retrieved Dinosaurs.
Fig. 8(A) To 8(E): Example Of Image Retrieval Using Integrated Scheme Of MRTCM With Color Histograms On The Five Classes. The Top-Left Image Is The Query Image, The Correct Images Do Not Include Query Image
Itself.
4. CONCLUSIONS
This paper presents a new integrated feature descriptor MRTCM for CBIR. The present method integrated the HSV color histograms features with the GLCM features derived on MRTCM. The multi region approach reduced overall dimensionality by deriving features on each region instead of micro
regions. The textons on multi regions derived the structure of the image. Finally the texture features are computed by deriving the GLCM features on MRTCM. The present method and other existing methods are tested on WANG database using the precision and recall rates. The GLCM features on MRTCM are derived using various distances and for d=1 to 7.The present method yielded a good IR rate.
REFERENCES:
[1] Z. Lei, L. Fuzong, Z. Bo, “A CBIR method based on color-spatial feature, in: TENCON”, Proceedings of the IEEE Region 10 Conference, 1999, pp. 166– 169.
[2] H.B. Kekre, S.D. Thepade, “Color traits transfer to grayscale images “, in: IEEE Int. Conference on Emerging Trends in Engineering and Technology, ICETET, 2008.
[3] C.M. Pun, C.F. Wong, “Fast and robust, color feature extraction for content-based image retrieval”, Int. J. Adv. Comput. Technol. 3 (6) (2011).
[4] A. Vadivel, S. Sural, A.K. Majumdar, “Human color perception in the HSV space and its application in histogram generation for image Retrieval”, in: Proc. SPIE, Color Imaging X: Processing, Hardcopy, and Applications, 2005, pp. 598–609. [5] L. Cinque, G. Ciocca, S. Levialdi, A.
Pellicano, R. Schettini, “Colour-based image retrieval using spatial-chromatic histogram”, Image Vis. Comput. 19 (2001),pp: 979–986.
[6] S. Jeong, C.S. Won, R.M. Gray, “Image retrieval using color histograms generated by Gauss mixture vector quantization”, Computer Vision Image Understanding, Vol-94, iss-1-3, june-2004, pp:44-66.
[7] J. Yue, Z. Li, L. Liu, Z. Fu, “Content-based image retrieval using color and texture fused features” , Math. Comput. Modelling 54 (2011), pp: 1121–1127. [8] C.H. Lin, R.T. Chen, Y.K. Chan, “A
[image:9.612.90.511.70.701.2][9] J.Luo, D.Crandail, “Color object detection using spatial–color joint probability function”, IEEE transitions on Image Processing, 15 (6), (2006), 1443-1453.
[10]A. Pentland, R.W. Picard, S. Sclaroff,
Photobook: “Content-based
manipulation of image databases”, Int. J. Comput. Vis. 18 (1996), pp: 233–254. [11]J. Wu, Z. Wei, Y. Chang, “Color and texture feature for content based image retrieval” , Int. J. Digit. Content Technol. Appl. 4 (3) (2010).
[12]B.S. Manjunathi, W.Y. Ma, “Texture features for browsing and retrieval of image data”, IEEE Trans. Pattern Anal. Mach. Intell. 8 (8) (1996), pp: 837–842. [13]Gorti S Murty, V.Vijaya Kumar, A.
Obulesu, “Age classification based on simple LBP transitions”, International journal of computer science and engineering (IJCSE), Vol.5, No. 10, OCT-2013, pp.885-893.
[14]M. Kokare,P.K Biswas, B.N Chatterji, “Texture image retrieval using rotated wavelet filters”, J.Pattern Recognition. Lett. 28 (2007) 1240-1249.
[15]H. A. Moghaddam, T.T hajoie, A.H. Rouhi, “A new algorithm for image indexing and retrieval using wavelet correlograms”, Int. Conf. Image Process., K.N. Toosi Univ. of Technl., Tehran, Iran, 2(2003) 497-500.
[16]M.T. saadatmand, H.A. Moghaddam, “Enhanced wavelet correlogram methods for image indexing and retrieval”, IEEE Int.Conf. Image Procc., K.N. Toosi Univ. of Technol. Tehran, Iran (2005) 541-544.
[17]L.Birgale, M.Kokare, D.Doye, “Color and texture features for content based image retrieval”, Int.Conf.Comput. Grafics. Image Visual., Wash., USA (2006) 146-149.
[18]M.Subramanyam,A.B. Gonde, R.P. Maheshwari, “Color and texture features for image indexing and retrieval”, IEEE Int.Adv. Comput. Conf. Patial., Ind, (2009).
[19]M.Subramnyam, R.P. Maheshwari, R. Balasubramanian, “A correlogram algorithm for image indexing and retrieval using wavelet and rotated wavelet filters”, Int. J.Signal Imag. Syst.Eng. 4(1), (2011), 27-34.
[20]Jongwon Lee, Jongho Nang, “Content based image retrieval method using the relative location of multiple ROIs”, Advances in Electrical and Computer Engineering, 11(3), (2011), 85-90. [21]B. Moghaddam, HBiermann, D.
Margarties, “Regions- of-interest and spatial layout for content based image retrieval”, Multimedia Tools and Applicatioon, 14(2), (2001), 201-210. [22]B.G.Prasad, K.K.Biswas, S.K.Gupta,
“Region based image retrieval using integrated color shape and location index”, computer vision and image understating, 94(2004), 193-233. [23]Q.Tian, Y.Wu, T.S. Huang, “Combine
user defined region-of-interest and spatial layout for image retrieval”, in: Proc.of IEEE Int. Conf. on image Processing, (ICIP2000), pp: 746-749. [24]Muhammet Bastan, Hayati Cam, Ugur
Ulusoy, “BilVideo-7: an MPEG-7-Compatible video indexing and retrieval system”, IEEE Multimedia, 17 (3), (2010), 62-73.
[25]M. Subrahmanyam, R.P.Maheshwari, R. Balasubramanian, “Local maximum edge binary patterns: a new descriptor for image retrieval and object tracking”, Signal Process. 92 (2012) 1467–1479. [26]M. Subrahmanyam, R.P. Maheshwari,
R. Balasubramanian, “Local tetra patterns: a new feature descriptor for content based image retrieval”, IEEE Trans. Image Process. 21 (5) (2012) 2874–2886.
[27]M. Subrahmanyam, R.P. Maheshwari, R. Balasubramanian, “Directional local extrema patterns: a new descriptor for content based image retrieval”, Int. J. Multimed. Inform. Retr. 1 (3) (2012) 191–203.
[28]M. Subrahmanyam, R.P. Maheshwari, R. Balasubramanian, “Directional binary wavelet patterns for biomedical image indexing and retrieval”, J. Med. Syst. 36 (5) (2012) 2865–2879.
[30]M. Subrahmanyam, Q.M. Jonathan Wu, “Local ternary co-occurrence patterns: a new feature descriptor for MRI and CT image retrieval”, Neurocomputing 119, (7) (2013) 399–412.
[31]V. Takala, T. Ahonen, M. Pietikainen, “Block-based methods for image retrieval using local binary patterns”, LNCS 3450 (2005) 882–891.
[32]Ojala T., PietikaÈinen M., and Harwood D., “A Comparative Study of Texture Measures with Classification Based on Feature Distributions”, Pattern Recognition, vol. 29, pp. 51-59, 1996. [33]M. Heikkil, M. Pietikainen, C. Schmid,
“Description of interest regions with local binary patterns”, Pattern Recognit. 42 (2009) 425–436.
[34]P. Viola and M. Jones. “Rapid object detection using a boosted cascade of simple features”, In IEEE Conference on Computer Vision and Pattern Recognition, 2001.
[35]S. Z. Li, L. Zhu, and Z. Q. Zhang et al. “Statistical learning of multi-view face detection”. In ECCV, 2002.
[36]T. Mita, T. Kaneko, and O. Hori. “Joint haar-like features for face detection”. In ICCV, 2005.
[37]R. Lienhart and J. Maydt. “An extended set of haar-like features for rapid object detection”, In ICIP, 2002.
[38]B. Froba and A. Ernst. “Face detection with the modified census transform”. In AFGR, 2004.
[39]C. Huang, H. Ai, Y. Li, and S. Lao. “Learning sparse features in granular space for multi-view face detection”, IEEE International conference on Automatic Face and Gesture Recognition, April 2006.
[40]B. Julesz, “Textons, the elements of texture perception, and their interactions”, Nature 290 (5802) (1981) 91–97.
[41]U Ravi Babu,V Vijay Kumar, B.Sujatha, “Texture classification based on texton features”, International journal of image, graphics and signal processing (IJIGSP), Vol.4, No.8, pp.36-42, Auguest-2012, ISSN: 2074-9074.
[42]P. Kiran Kumar Reddy, V. Vijaya Kumar and B. Eswara Reddy, “Texture classification based on cross and diagonal shape descriptor co-occurrence matrix “, CiiT International Journal of Digital Image Processing, Vol. 6, No.06, pp. 261-268, June-July 2014. [43]Guang-Hai Liu, Jing-Yu Yang, “Image
retrieval based on the texton co-occurrence matrix”, Pattern Recognition, 41(12) (2008) 3521-3527. [44]Guang-Hai Liu , Lei Zhang, Ying-Kun Hou, Zuo-Yong Li, Jing-Yu Yang, “Image retrieval based on multi-texton histogram”, Pattern Recognition 43 (2010) 2380–2389
[45]K. Srinivasa Reddy (Research Scholar) , V.Vijaya Kumar, B.Eshwara reddy, “Face Recognition based on Texture Features using Local Ternary Patterns”, I.J. Image, Graphics and Signal Processing, 2015, 10, 37-46 , ISSN: 2074-9082.
[46]V.Vijaya Kumar, K. Srinivasa Reddy V.Venkata krishyna, “Face Recognition using the Prominent LBP Model”, International Journal of Applied Engineering Research (IJAER), ISSN: 1087-1090, 10(2), 2015, pp: 4373-4384. [47]B.Eswara Reddy, P.Chandra Sekhar Reddy, V.Vijaya Kumar, “Texton based shape features on local binary pattern for age classification”, International journal of image, graphics and signal processing (IJIGSP), Vol. 7, No.4,pp.54-60, July-2012, ISSN: 2074-9074.
[48]V. Vijaya Kumar, Gorti Satyanaraya Murty, PS V V S R Kumar, “Classification of facial expressions based on transitions derived from third order neighborhood LBP”, Global journal of computer science and technology graphics & vision (GJCST), Vol.14, N0.1, pp. 1-12, Jan-2014, ISSN: 0975-4350.
[50]J. Sasi Kiran. U. Ravi Babu, V Vijaya Kumar, “Wavelet based histogram method for classification of textures”, International journal of computer engineering & technology (IJCET), Vol. 4, No. 3, pp. 149-164, may-june-2013, ISSN: 0976-6375.
[51]M. Sonka, V. Hlavac, R. Boyle, “Image Processing, Analysis, and Machine Vision”, second ed., Thomson Brooks/Cole, Boston, MA, USA, 1998. [52]Corel 1000 image database. [Online].
<http://wang.ist.psu.edu/docs/related.sht ml>
[53]J. Huang, S.R. Kumar, M. Mitra, et al., “Image indexing using color correlograms “, in: IEEE Conference on Computer Vision and Pattern Recognition, 1997, pp. 762–768. [54]R.M. Haralick, K. Shangmugam, I.