Munich Personal RePEc Archive
Capitalization, regulation and the poor:
access to basic services in Bolivia
Barja, Gover and Urquiola, Miguel
http://www.wider.unu.edu/publications/books-and-journals/2003/en
GB/U tility
−
P rivatization
−
and
−
Regulation
−
A
−
F air
−
Deal
−
f or
−
Consumers/, http
:
//www.wider.unu.edu/research/projects
−
by
−
theme/employment
−
industry/en
GB/the
−
impact
−
of
−
privatization/, W orldInstitutef orDevelopmentEconomicsResearch
1 April 2001
Online at
https://mpra.ub.uni-muenchen.de/23920/
Capitalization, regulation, and the poor:
Access to basic services in Bolivia
Research funded by the United Nations University/
World Institute for Development Economics Research
Draft/preliminary - March, 2001
Gover Barja
Miguel Urquiola
1
1
I. Introduction
Like other Latin American countries, Bolivia has included privatization in a
package of structural reforms that, over the last 15 years, have significantly liberalized its
economy. As elsewhere, utilities have been among the key enterprises transferred to the
private sector, in an effort to attract investment and increase efficiency.
As Estache et al. (2000) review, increasing interest centers on how such transfers affected lower income households’ access to basic services, and their welfare more generally. While this has not yet been a major concern in Bolivia, the economic
slowdown of the past two years has resulted in growing criticism of the entire liberalization process, and further information on the “social” impact of privatization might usefully inform ongoing policy discussions.
In this context, this paper describes the privatization process as it took place in Bolivia, placing emphasis on the particularities of the “capitalization” mechanism that was used for this purpose, and the regulatory framework that was introduced as its
complement. With this background, the document then analyzes the impact of reforms
on poor or lower income households along two dimensions: i) access, understood as
connection, and ii) affordability, as determined by changes in consumption and pricing
patterns. Due to data availability issues, the emphasis is on urban households, though
information on the rural area is included where feasible.
The general picture that emerges points to the following conclusions:
1) Capitalization and regulation, and the liberalization of the utilities sector more
generally, have been effective as far as attracting foreign investment, thereby fulfilling one of these reforms’ central macroeconomic goals.
2) Overall, the evidence suggests that this investment facilitated an expansion of access to
basic services in the urban area. Access rates in the rural area, however, remain at very
low levels, which partially reflects that privatization was rarely meant to affect service
3) In the urban area and in terms of connection, the service expansions observed have not
bypassed the poor. On the contrary, in many cases it is the lower income quintiles that
seem to have benefited the most.
4) The fact that these reforms had a much smaller effect in rural areas, however, implies
that if one focuses on the poor at a national level, these expansions have probably
benefited higher income groups to a greater extent.
5) As far as the effects of pricing changes on households’ welfare, the information
presented does suggest some adverse effects. Nevertheless, the findings in this area are
affected by data limitations, and in any case would not seem to outweigh the benefits
brought about by greater access.
While this is a relatively optimistic prognosis as to the effects of capitalization
and regulation, it seems to be consistent with the fact that while increasing criticism is
aimed at economic liberalization within Bolivia, it is rarely focused on the direct
consequences of utility sector reform on the poor, except maybe for some localized
exceptions in the water sector.
The remainder of the paper is organized as follows. The next section provides
general background on economic performance and poverty in Bolivia. Section III
describes the privatization process of the mid-1990’s, and section IV explores its impact on access and affordability, paying particular attention to poor households’ situation. Section V explores changes in consumer welfare, and section VI reviews macroeconomic
effects. Section VII discusses challenges facing the regulatory system, and section VIII
concludes.
II. General background: a simple characterization of poverty
After a severe crisis that began in the late 1970’s, Bolivia implemented substantial economic liberalization measures in 1985, ending hyperinflation and setting the basis for
moderate but sustained growth. Figure 1, which presents basic information on inflation
Given an annual population growth rate of about 2.3 percent, the observed
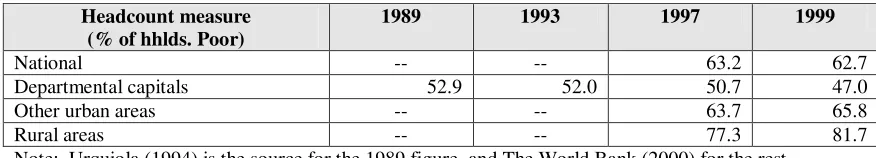
economic growth rates would not be expected to make a major dent on poverty. Table 1
illustrates this point presenting basic information on its level and evolution.2 As the table
shows, the incidence of poverty is significantly greater in urban centers outside the
department capitals, and in the rural area, where in 1999 it is estimated at roughly 80
[image:5.612.101.513.117.360.2]percent.
Table 1
Headcount and poverty gap measures in urban Bolivia
Headcount measure (% of hhlds. Poor)
1989 1993 1997 1999
National -- -- 63.2 62.7
Departmental capitals 52.9 52.0 50.7 47.0
Other urban areas -- -- 63.7 65.8
Rural areas -- -- 77.3 81.7
Note: Urquiola (1994) is the source for the 1989 figure, and The World Bank (2000) for the rest. For definitions on the measures used, see either of these publications.
2
For an early assessment of how growth and changes in the income distribution affected poverty, see Urquiola (1994). For an update using more recent methodologies, see Hernany (2000).
F ig u re 1
In fla tio n a n d eco n o m ic g ro w th in B o liv ia - 1 9 8 5 -1 9 9 9
0 2 0 4 0 6 0 8 0 1 0 0 1 2 0 1 4 0
1 9 8 5 1 9 8 6 1 9 8 7 1 9 8 8 1 9 8 9 1 9 9 0 1 9 9 1 1 9 9 2 1 9 9 3 1 9 9 4 1 9 9 5 1 9 9 6 1 9 9 7 1 9 9 8 1 9 9 9
Y ear In fl a ti o n -3 -2 -1 0 1 2 3 4 5 6 G D P g ro w th r a te
In fla tio n (L eft a x is)
[image:5.612.83.521.566.645.2]In department capitals, where more historical evidence is available, poverty has
experienced a moderate but sustained decline since 1989.3
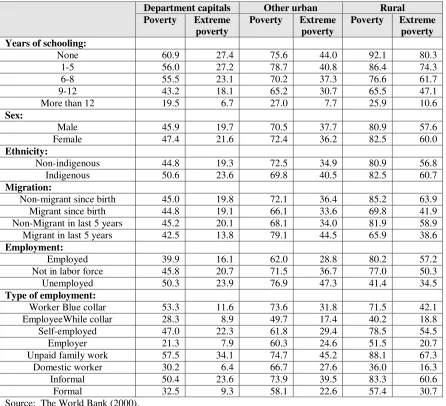
Table 2 complements this information presenting the simple probabilities of being
[image:6.612.85.531.188.594.2]poor that are associated with given characteristics in each of the realms considered.
Table 2
Probability of being poor or extremely poor by group, 1999
Department capitals Other urban Rural Poverty Extreme
poverty
Poverty Extreme poverty
Poverty Extreme poverty Years of schooling:
None 60.9 27.4 75.6 44.0 92.1 80.3 1-5 56.0 27.2 78.7 40.8 86.4 74.3 6-8 55.5 23.1 70.2 37.3 76.6 61.7 9-12 43.2 18.1 65.2 30.7 65.5 47.1 More than 12 19.5 6.7 27.0 7.7 25.9 10.6
Sex:
Male 45.9 19.7 70.5 37.7 80.9 57.6 Female 47.4 21.6 72.4 36.2 82.5 60.0
Ethnicity:
Non-indigenous 44.8 19.3 72.5 34.9 80.9 56.8 Indigenous 50.6 23.6 69.8 40.5 82.5 60.7
Migration:
Non-migrant since birth 45.0 19.8 72.1 36.4 85.2 63.9 Migrant since birth 44.8 19.1 66.1 33.6 69.8 41.9 Non-Migrant in last 5 years 45.2 20.1 68.1 34.0 81.9 58.9 Migrant in last 5 years 42.5 13.8 79.1 44.5 65.9 38.6
Employment:
Employed 39.9 16.1 62.0 28.8 80.2 57.2 Not in labor force 45.8 20.7 71.5 36.7 77.0 50.3 Unemployed 50.3 23.9 76.9 47.3 41.4 34.5
Type of employment:
Worker Blue collar 53.3 11.6 73.6 31.8 71.5 42.1 EmployeeWhile collar 28.3 8.9 49.7 17.4 40.2 18.8 Self-employed 47.0 22.3 61.8 29.4 78.5 54.5 Employer 21.3 7.9 60.3 24.6 51.5 20.7 Unpaid family work 57.5 34.1 74.7 45.2 88.1 67.3 Domestic worker 30.2 6.4 66.7 27.6 36.0 16.3 Informal 50.4 23.6 73.9 39.5 83.3 60.6 Formal 32.5 9.3 58.1 22.6 57.4 30.7 Source: The World Bank (2000).
These cover aspects like schooling, sex, ethnicity, migration, and employment-related characteristics. The results observed are based on cross sectional variation in individuals’ traits and their poverty status, so it is inappropriate to interpret them in a causal manner.
3
Nevertheless, the information is illustrative as to the characteristics that are associated
with being poor, and the expected ones stand out: low education, being female,
indigenous, or participating in the labor market’s “informal” segment.
After describing the essential features of the privatization process, the remaining
sections focus on its effects on the poor. For this purpose, the analysis distinguishes
between households according to which income quintile they belong to. While this
provides for a richer analysis than simpler poor/non-poor distinctions, it is useful to bear
in mind that as the previous tables suggest, in urban areas, poor households will generally
be those in the bottom two or three quintiles.
III. Capitalization, and regulatory reform
Despite the relatively early success with liberalization illustrated in figure 1,
Bolivia did not engage in sustained privatization efforts until the mid-1990’s. When it
finally embarked on this process, the government employed traditional procedures in
some instances, but mainly relied on capitalization as a mechanism for the transfer of
State-owned firms. This section describes how these approaches differ, provides
information on the legal framework that underpinned their implementation, and briefly
details the specific changes that took place in the Electricity, Natural Gas,
Telecommunications, and Water and Sewerage industries.
A. Capitalization and privatization4
Under traditional privatization, the government transfers a majority of ownership
in a State firm to the private sector, and has freedom over how to spend the proceeds.
Under capitalization, the State transfers shares equivalent to 50 percent of a firm to the
investor with the winning bid. It also yields about 45 percent to private pension fund
administrators, so that the citizenry in general gains this portion,5 with the remaining
4
For more on the capitalization experience, see Baldivia (1998) and Pierce (1997).
5
going to the company’s employees. The investor gains the right to manage the firm, and commits to investing its capital contribution, the amount it offered for its 50 percent
share, in its development. It must carry out this investment within a specified period
(typically six to eight years), agree to fulfill obligations that encompass expansion and
quality goals, and operate under regulation and other clauses specified in a long term
contract (typically 40 years).
Under this scheme, therefore, investment is given a high priority, and the
government gains no disposable income. This reflects the fact that having come relatively late in Bolivia’s liberalization, capitalization was not seen as a means to cover deficits, but rather as a way to attract foreign investment and improve management in key
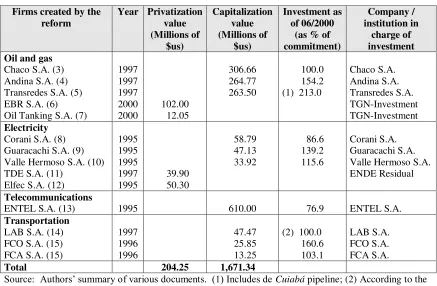
areas of the economy. Table 3 presents a summary of the privatization and capitalization
outcomes, including the firms that were created as a result of both, the financial resources
they generated, and the investments actually executed.
As this table illustrates, this process raised significant amounts of capital: total
commitments add up to about two billion dollars, roughly equivalent to 30 percent of
GDP. As detailed below, capitalization contributed to a significant increase in
investment. Additionally, several capitalized firms have exceeded their commitments
ahead of schedule, while announcing ambitious investment programs for subsequent
Table 3
Resources generated by privatization and capitalization
Firms created by the reform
Year Privatization value (Millions of $us) Capitalization value (Millions of $us) Investment as of 06/2000
(as % of commitment)
Company / institution in
charge of investment Oil and gas
Chaco S.A. (3) Andina S.A. (4) Transredes S.A. (5) EBR S.A. (6) Oil Tanking S.A. (7)
1997 1997 1997 2000 2000 102.00 12.05 306.66 264.77 263.50 100.0 154.2 (1) 213.0
Chaco S.A. Andina S.A. Transredes S.A. TGN-Investment TGN-Investment Electricity
Corani S.A. (8) Guaracachi S.A. (9) Valle Hermoso S.A. (10) TDE S.A. (11)
Elfec S.A. (12)
1995 1995 1995 1997 1995 39.90 50.30 58.79 47.13 33.92 86.6 139.2 115.6 Corani S.A. Guaracachi S.A. Valle Hermoso S.A. ENDE Residual
Telecommunications
ENTEL S.A. (13) 1995 610.00 76.9 ENTEL S.A.
Transportation
LAB S.A. (14) FCO S.A. (15) FCA S.A. (15)
1997 1996 1996 47.47 25.85 13.25
(2) 100.0 160.6 103.1
LAB S.A. FCO S.A. FCA S.A.
Total 204.25 1,671.34
Source: Authors’ summary of various documents. (1) Includes de Cuiabá pipeline; (2) According to the Transportation Superintendence; (3) Capitalized by Amoco; (4) Capitalized by YPF-Pérez Compac-Plus Petrol; (5) Capitalized by Enron-Shell; (6) Privatized in favor of Petrobras and others; (7) Privatized in favor of Oil Tanking; (8) Capitalized by Dominion Energy Inc.; (9) Capitalized by Energy Initiatives
Inc.; (10) Capitalized by Constellation Energy Inc.; (11) Privatized in favor of Unión Fenosa; (12) Privatized in favor of EMEL S.A.; (13) Capitalized by ETI Euro Telecom N.V.; (14) Capitalized by VASP; (15) Capitalized by Cruz Blanca.
B. Capitalization and regulation: the framework for sectoral reforms6
Capitalization was complemented with reforms to different sectors’ industrial organization, and with the implementation of a regulatory framework that seeks to
promote competition and efficiency. The main tool in this regard was the SIRESE7 Law
(1994), which created a regulatory system for the whole infrastructure sector. In essence,
this legislation defines the regulatory institutional structure, including the role of five
regulatory agencies (Superintendencias) for the Electricity, Telecommunications,
6
Hydrocarbons, Potable Water, and Transportation industries. Additionally, it sets up an
overseeing agency responsible for system-wide coordination, appeals and evaluation; and
introduces market competition as one of the guiding principles in the infrastructure
sector. Finally, it specifies procedures for appeals, hearings, and conflict resolution.
This framework is rounded out by four more specific laws: Electricity (1994),
Telecommunications (1995), Hydrocarbons (1996) and Potable Water (2000). These introduce changes in each sector’s industrial organization, and govern aspects related to tariff regulation, entry, service quality, and sanctions. The sectoral regulatory agencies
created as part of SIRESE administer each law. The remainder of this section briefly
describes the central changes this legislation led to in each of the industries cited.
Electricity
Prior to reform, the electricity industry was divided into the National
Interconnected System (NIS) and other independent networks, a distinction which
remains today. The first covers the largest cities, while the second concentrates on
secondary urban and rural areas.8 This paper focuses on the NIS, where the State-owned
ENDE9 participated in generation, transmission, and part of the distribution of electricity,
through ELFEC, to the city of Cochabamba. COBEE10, a private company, was active in generation and distribution in the cities of La Paz and Oruro. Other firms operating in
distribution were, CRE11 in Santa Cruz, SEPSA12 in Potosí and CESSA13 in Sucre. Competition existed only between ENDE and COBEE, and was limited to the direct
provision of electricity to a few mining and industrial businesses.
7
Sistema de Regulación Sectorial.
8
This distinction will be used extensively. In Bolivia, the main cities are the department capitals. The three largest have populations close to one million and form the so-called central axis: Cochabamba, La Paz/El Alto (El Alto is legally independent, but physically and economically linked to La Paz), and Santa Cruz. Unlike most of its neighbors, therefore, Bolivia does not have a dominant urban center, and has one of the lowest urban concentration ratios in the region. For further discussion, see Urquiola et al. (1999).
9
Empresa Nacional de Electricidad.
10
Compañía Boliviana de Energía Eléctrica.
11
Cooperativa Rural Eléctrica.
12
Servicios Eléctricos de Potosí, a municipal company.
The Electricity Law vertically separated generation, transmission, and
distribution. In generation, it promoted competition by creating the three firms cited in
table 3: Corani, Guaracachi and Valle Hermoso, limiting the market share each can have
to 35 percent of the NIS domestic market capacity. Exclusive rights were initially
granted to these companies, but by 1999 entry was liberalized and Synergia,
Hidroeléctrica Boliviana and Río Eléctrico joined the market.
In transmission, network operation was passed from ENDE to the private
Transportadora de Electricidad, without exclusive rights. Additionally, the Electricity
Law forbids the participation of transmission firms in purchase or sale activities, and
establishes open access and tariff regulation.
Finally, in distribution, firms were established as independent regional
monopolies subject to tariff regulation and quality control: CRE, privatized ELFEC,
privatized SEPSA, CESSA (still a cooperative), ELECTROPAZ and ELFEO. The last two resulted from the sale of COBEE’s distribution facilities, with the original company remaining only in the generation business. In this realm, tariff regulation consists of
several average cost caps with productivity factors, which multiplied by their respective
units, add to produce total income. The productivity factors are set using a four-year lag,
although tariffs are revised every semester to allow passthrough of energy costs changes.
These reforms, together with the introduction of a coordination office, have created a
wholesale electricity market that seeks to simulate competitive conditions.
Hydrocarbons
Prior to reform, the hydrocarbons (oil and natural gas) industry was under the
control of State-owned YPFB14, a vertically integrated monopoly involved in all aspects
of the industry. Limited private participation took place through joint ventures with this
company.
Since then, the priority has been to remove YPFB from production, and promote
foreign investment to foster a natural gas export industry directed mainly towards
southern Brazil. The State intends this industry to support the development of other
14
sectors of the economy, and with this goal in mind, reforms and foreign investment have
been directed towards exploration and infrastructure. The inauguration of a pipeline to
Brazil in 1999 made this vision a reality. As for the domestic market, a general policy of
private control of all phases up to retail commercialization was adopted.
To implement these objectives, the Hydrocarbons Law requires that exploration,
production and commercialization be executed by joint ventures with YPFB, while
placing few restrictions on the export and import of petroleum products. Pipeline
administration for gas and oil was transferred to the capitalized Transredes, without
exclusive rights. The administration of other pipelines (poliductos) was entrusted to the
private Oil Tanking, with the remaining under YPFB operation. In the area of refinement, most of YPFB’s units were transferred to the private Empresa Boliviana de Refinación, while the wholesale of petroleum products continues under YPFB.
In the commercialization process, YPFB’s storage terminals were transferred to Oil Tanking as well, but other private firms are also active. Bottled liquefied gas
distribution plants are all private, and about 85% of bottled gas plants continue under
YPFB. Compressed natural gas service stations are all private, and about 15 percent of
service stations for liquids continue under the State firm. Imports of liquids (mainly
diesel) and lubricants are carried out by private firms.
Mixed businesses continue to participate in network-based natural gas
distribution: SERGAS in Santa Cruz, EMCOGAS in Cochabamba, EMDIGAS in Sucre
and EMTAGAS in Tarija. Despite this activity, the network-based natural gas industry is
still relatively underdeveloped: by 1999 it included only about 6,000 connections.
Except for restrictions to vertical integration imposed on firms in gas pipeline
transportation, the industry structure is flexible and determined by export market needs,
although mergers and acquisitions are subject to approval. This has permitted
PETROBRAS, in association with others, to integrate several of the phases directed to
the natural gas exports to Brazil, at the same time as this company participates in
refinement directed to the domestic market.
As part of the regulatory package, rate of return regulation is applied to pipeline
transportation, with tariffs set to their 1997 level with a four-year regulatory lag. In
Finally, regulation in this sector does have some particularities, since as opposed to the
utilities considered in the rest of this paper, the hydrocarbons industry produces a tradable
for which Bolivia is a price taker. Under policies dictating that domestic prices reflect
opportunity costs, international price fluctuations affect the domestic market
significantly.
Telecommunications
Prior to reforms, the telecommunications industry was divided between ENTEL,15
which covered national and international long distance communication services, 15
cooperatives with monopolies in fixed local telephone services, and Telecel, a private
monopoly in the cellular market. The Telecommunications Law maintains this separation
until entry is liberalized, at the end of 2001. Until then, ENTEL and the cooperatives
retain exclusive rights, but the cellular market was opened to competition by allowing the
entry of ENTEL-Movil (a division of capitalized ENTEL).
Additionally, for the period prior to liberalization, legislation mandates tariff
regulation for firms that control more than the 60 percent of a given market. This scheme
has a similar structure in all areas, establishing an initial price cap for different baskets of
services, adjusted for inflation and a productivity factor with a three-year lag. Further,
the law stipulates requirements concerning expansion, service quality, and technological
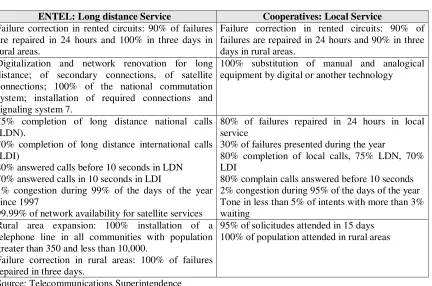
modernization. These were to be reached by the year 2000, and are detailed in Table 4.
Finally, the Telecommunications Law also features incentives for the exploitation
of scope economies by the most efficient firms. This objective is pursued using two
mechanisms: i) cooperatives which fail to accomplish improvement goals lose a
percentage of their market to ENTEL, and ii) authorization for mergers, acquisitions and
stock swaps.
15
Table 4:
Established goals for long distance and local services (Percentages are accumulated to the year 2000)
ENTEL: Long distance Service Cooperatives: Local Service
Failure correction in rented circuits: 90% of failures are repaired in 24 hours and 100% in three days in rural areas.
Failure correction in rented circuits: 90% of failures are repaired in 24 hours and 90% in three days in rural areas.
Digitalization and network renovation for long distance; of secondary connections, of satellite connections; 100% of the national commutation system; installation of required connections and signaling system 7.
100% substitution of manual and analogical equipment by digital or another technology
75% completion of long distance national calls (LDN).
70% completion of long distance international calls (LDI)
80% answered calls before 10 seconds in LDN 70% answered calls in 10 seconds in LDI
1% congestion during 99% of the days of the year since 1997
99.99% of network availability for satellite services
80% of failures repaired in 24 hours in local service
30% of failures presented during the year
80% completion of local calls, 75% LDN, 70% LDI
80% complain calls answered before 10 seconds 2% congestion during 95% of the days of the year Tone in less than 5% of intents with more than 3% waiting
Rural area expansion: 100% installation of a telephone line in all communities with population greater than 350 and less than 10,000.
Failure correction in rural areas: 100% of failures repaired in three days.
95% of solicitudes attended in 15 days 100% of population attended in rural areas
Source: Telecommunications Superintendence
To date, the only modification of this industrial structure has been a joint venture
between COMTECO (the Cochabamba cooperative) and Western Wireless International
for the acquisition of a PCS license. This venture created Nuevatel, which began its
operations in December 2000. This has resulted in an intensification of competition in
the mobile market. Meanwhile, incumbents and potential entrants are devoting their
energies to preparing for entry liberalization and the end of exclusive rights.
Water
While the other sectors experienced capitalization and the introduction of
regulation, the water industry has undergone limited changes and encountered more
difficulties. The intended result in this area was the proliferation of concessions (as
one municipal firm, SAMAPA (La Paz/El Alto), was transferred to the private sector in
1997, for its administration by Aguas del Illimani.16
The expectation was that within a prudent amount of time, legislation would be in
place to incorporate the remaining firms into a similar model. However, the long period
used for the development of the Potable Water and Sewerage Law (finally approved in
2000), together with significant failure in a second transfer of a municipal firm
(SEMAPA) to Aguas del Tunari in Cochabamba, has slowed and somewhat redirected
change in this sector. Nevertheless, during 1998 and 1999, the Water Superintendence
was able to incorporate the new regulatory regime and sign concessions with the existing
municipal water firms in Santa Cruz, Oruro, Sucre, and other smaller cities.
Under the new model, the concession seeks to improve internal efficiency and
attain expansion and quality goals. The characteristics of the Aguas del Illimani contract
reflect this, and the objectives established for the 1997-2001 period include: i) 100
percent access to potable water or sewerage (excluding public fountains) in the areas of
Achachicala and Pampahasi, which cover the city of La Paz, ii) 82 percent access to
potable water in the city of El Alto by 2001, of which 50 percent should be expansion
connections, and 41% access to sewerage; and iii) compliance with the long-term
[image:15.612.87.524.510.619.2]expansion goals presented in Table 5.
Table 5
Expansion goals for potable water and sewage services in La Paz and El Alto17 (Percentage of households)
Zone 2001 2006 2011 2016 2021 2026 Potable Water Achachicala Pampahasi El Alto 100 100 82 100 100 85 100 100 90 100 100 90 100 100 90 100 100 90 Sewerage Achachicala Pampahasi El Alto 81 83 41 84 85 43 90 90 47 94 94 71 95 95 90 95 95 90 Source: Aguas del Illimani contract.
16
The main shareholder is Lyonnaise Des Eaux, with 35 percent.
17
Quality norms include aspects related to the sources of water, its quality,
abundance and pressure; continuity of service, infrastructure efficiency, consumer
attention, and emergencies. Tariff regulation was established under a rate of return
mechanism with a five-year regulatory lag. Prices calculated this way are designed to
permit the firm to comply with its contractual obligations and the expansion goals.
Although the lag promotes internal efficiency, no productivity factors where
incorporated. Additionally, tariffs were set in dollar terms payable in bolivianos.18
Finally, the following are among the most important characteristics of the new
Potable Water and Sewerage Law: i) Responsibility for the provision of these services
belongs to municipal governments, but can be transferred to Water and Sewerage
Providers (WSP) which can be private, municipal, or mixed firms, cooperatives, or other
civil associations recognized by law; ii) The territory is divided into concessionary and
non-concessionary areas. The first are financially sustainable and the service is provided
only by WSP´s, the second are not and the service can be provided by a local
government; iii) Tariff regulation of WSP´s establishes the use of rate of return criteria,
investment and efficiency targets, and a five year regulatory lag; and iv) Universal access
in non-concession areas will be supported by public investment.
IV. The effects on access: connection and consumption
In most countries, reforms to the utilities sector raise a number of concerns, and recently these have included the impact on poor households’ access to basic services. This section addresses these issues in two stages: first, it focuses on how access defined
as connection has evolved during the period following capitalization; it then analyzes
how changes in pricing policies may have affected the poor.
A. Data and coverage
The analysis is based on data from three household surveys carried out by the
Instituto Nacional de Estadística (INE), as detailed in table 6. These allow study of the
1994-1999 period, during which the major capitalization and regulatory reforms took
place and had their initial effects. Additionally, they make feasible simple comparisons
with 1989-94, a period during which as figure 1 illustrated, the country had a similar
[image:17.612.82.530.203.266.2]economic performance, but none of the reforms were yet implemented.
Table 6
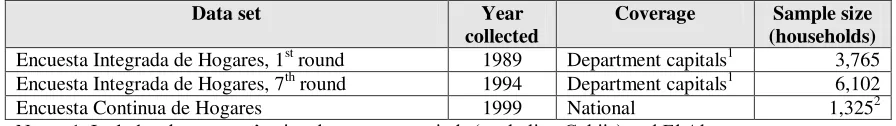
Household surveys used
Data set Year collected
Coverage Sample size (households)
Encuesta Integrada de Hogares, 1st round 1989 Department capitals1 3,765 Encuesta Integrada de Hogares, 7th round 1994 Department capitals1 6,102 Encuesta Continua de Hogares 1999 National 1,3252 Note: 1. Includes the country’s nine department capitals (excluding Cobija) and El Alto.
2. For comparability, this sample refers only to the department capitals covered in 1989 and 1994.
A drawback with the 1989 and 1994 surveys is that they only cover the major
urban areas: eight department capitals and El Alto; so that between-year comparisons
focus only on these urban centers. While this certainly limits the analysis, this restriction
may be appropriate to the extent that capitalization effects should be most visible in this
realm. To complement this information, this section also includes rural data based on the
1999 survey, as well as results from other studies. A final drawback is that the (relevant)
sample size for the1999 survey is considerably smaller than the other two; this may
explain some slightly anomalous results, as described below.
B. Changes in connection rates
In considering connection rates, this section focuses on access to electricity,
telephone, and water and sewerage services. Gas is ignored for three reasons. First, In most cities, gas for domestic consumption is distributed in liquefied, “bottled” form. Thus, its use does not imply connection to a network, but rather reflects households’ (potentially temporary) decision to use this fuel. Secondly, even in places where network
distribution does take place, its coverage is too small to be reliably captured using
household surveys. Finally, the emphasis of the capitalization processes in natural gas
With this caveat, table 7 illustrates the aggregate facts on the evolution of
connection to basic services in the larger cities. The precise survey questions used to
construct these connection rates are featured in the appendix. In this regard, electricity and telephone are the simplest cases, as they are based on the household’s straightforward declaration as to whether it has each service. Sewerage is considered available only if the household’s dwelling is connected to the network.
Finally, we include two definitions in the case of water. In the first case, the
household is considered connected if it declares it has a pipe connection either within its
dwelling or in the building its dwelling is a part of. In the second case, only the
households in the first category are considered connected. As evident, the difference
between these two is substantial: coverage is at least twice as large using the first
definition; in contrast, the improvement between 1994 and 1999 is greater under
definition (2). In part, these differences in improvement rates may reflect that the
wording of the questions used to prepare definition (2) has changed somewhat between
surveys. Additionally, accuracy in the case of criterion (2) relies on survey
administrators and respondents making somewhat subtle distinctions as to the nature of
water connections. In light of this, and since this paper focuses on changes in connection
rates, in the remainder we focus only on definition (1), but note it may overstate coverage
[image:18.612.163.441.532.649.2]levels.
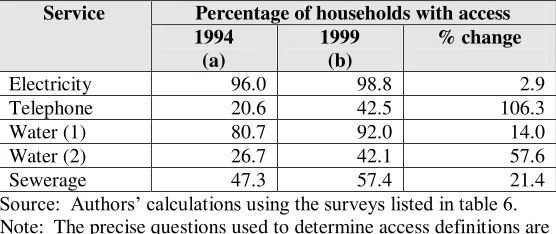
Table 7
Departmental capitals and El Alto:
Percentage of households connected to basic services, 1994-1999
Service Percentage of households with access 1994
(a)
1999 (b)
% change
Electricity 96.0 98.8 2.9 Telephone 20.6 42.5 106.3 Water (1) 80.7 92.0 14.0 Water (2) 26.7 42.1 57.6 Sewerage 47.3 57.4 21.4 Source: Authors’ calculations using the surveys listed in table 6. Note: The precise questions used to determine access definitions are detailed in the appendix.
Table 7 illustrates that, as might be expected in light of the investment record,
lower coverage, sewerage, water, and particularly telephone, the increases have been
significant. Importantly, the observed expansions took place in the context of one of the
more rapid urbanization processes in Latin America.19 This puts pressure on cities’ infrastructure because of the inflow of rural migrants who, on average, have lower
incomes than urban residents. In other words, in the absence of adequate investment,
coverage rates would have probably declined during these years.
C. Are these changes actually due to utility sector reforms?
While table 7 suggests that the reforms described in section III have been
associated with an expansion in access, it does not necessarily imply that these caused
this phenomenon. Indeed, other factors such as income growth or technological change
might have resulted in connection improvements even in the absence of any
liberalization.
In a strict sense, it is impossible to isolate the effects these measures had, since no
perfect counterfactual is available to assess what would have happened had none of the
measures been in place. If this information were available, a simple comparison would reveal the effects of the reform “treatment”; in its absence, simple conclusions are not feasible. Nonetheless, one can attempt to circumvent this problem by comparing “treatment” and “control” sectors or periods. This section presents two exercises that attempt this.
A first possibility is to observe the changes in access prior to the reform period,
comparing them to those that occurred thereafter. To implement this, figure 2 displays
access rates for 1989, 1994, and 1999 for each of the sectors considered.20 In this case,
the 1989-94 period serves as “control” for the 1994-99 capitalization years. This
comparison is enhanced because as suggested by figure 1, relatively low inflation,
moderate growth, and relative political stability prevailed during both periods.
19
Between the 1976 and 1992 censuses, the urbanization rate increased from 42 to 58 percent.
20
This simple evidence is generally suggestive of a positive effect in the cases of
sewerage, telephone, and water services. The access rates in these sectors were either “flat” or decreasing between 1989 and 1994, but display significant increases after this last year. In the case of electricity, in contrast, the entire 1989-99 period suggests gradual
growth in access rates, with no particular acceleration taking place during the second phase. In fact, figure 2 may actually underestimate a “capitalization effect”. This is because while the legal reforms underpinning capitalization began to take effect in 1994
and 1995, the actual investments, depending on the specific sector, did not start until
1996, 1997, or even 1998, as suggested in table 3.
In the case of telephone service, these issues are observed using conventional
penetration data, as presented in figure 3. This allows, further, a distinction between
fixed line and cellular connections, which is not possible with the household survey data.
This figure also displays stagnant performance early on, with a break in 1995/1996.
From this year on, mobile telephone coverage has increased rapidly, and although fixed
connections have been less dynamic, the overall penetration rate essentially tripled in
It bears repeating that the effects observed cannot be attributed only to
capitalization. As described in section III, other relevant changes include the
implementation of regulation in all these sectors, but also other liberalizations like the
introduction of competition in cellular (in relation to figure 3), and concessions in the
case of water and sewerage. Some of these factors are discussed further in the next
section.
Meanwhile, another way to attempt to isolate these reforms’ impact is to compare cities in which they would be expected to have more consequences with those in which
they might have had less of an effect. In the case of water and sewerage services, La
Paz/El Alto was the only city with a sustained concession. Figure 4 presents the evidence
on this case, where the expectation would be that increases in access would be larger in
In both cases, there are no major differences between the evolution of La Paz / El
Alto and other urban areas. For water, coverage in these areas appears to have converged
over this period, and in some cases differences are not statistically significant. In the case
of sewerage, after 1994 coverage appears to have risen somewhat faster in La Paz / El
Alto than in all other major urban areas (taken together). In short, the evidence in these
sectors is inconclusive, but does not seem to suggest a strong capitalization / privatization
effect. In the cases of electricity and telephone services, the distinction between the “treatment” and “control” urban centers is not always clear, and is omitted here for reasons of space.
In the end, none of these comparisons is conclusive, since in all cases it is simple
to think of concurrent events or trends that might confuse the interpretation.
Nevertheless, taken together and combined with the investment levels cited, they lend
support to the widespread perception that the capitalization processes did contribute to an
expansion of access to basic services.
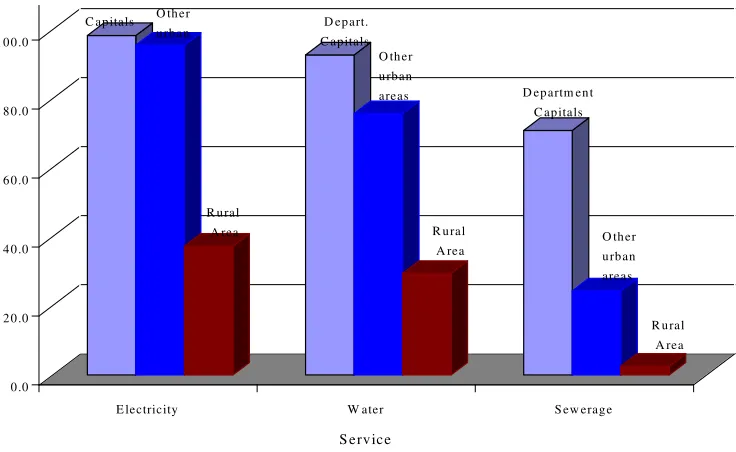
Before moving to whether these changes bypassed the poor, it is relevant to note
Bolivia. To a large extent, this reflects that due to data limitations, the analysis
concentrates only on department capitals.21 This overstates national welfare levels
because other urban areas, and the rural area in general, display lower connection rates.
This is illustrated in figure 5, which shows access rates in departmental capitals, other
urban areas, and rural locations. The significant differences between areas reflect, among
other factors, substantial variation in income levels and population densities.
D. Did the expansion in access bypass or benefit the poor?
The aggregate changes reviewed thus far are consistent with a number of
scenarios as to the distribution of the gains depicted. Specifically, they are not
informative as to what changes in access poor households experienced. As stated above,
the capitalization reforms have mainly affected the department capitals. This fact,
combined with the information contained in table 1 suggests that a first approximation
21
It is also possible that household could be overstating their welfare in this dimension. As long as such misrepresentation is consistent from period to period, however, it should not affect any conclusions based
0 .0 2 0 .0 4 0 .0 6 0 .0 8 0 .0 1 0 0 .0
E lectricity W ater S ew erag e
S ervice
F ig u re 5
P ercen ta g e o f h o u seh o ld s w ith a ccess to b a sic serv ices in th e d ep a rtm en t ca p ita ls, o th er u rb a n cen ters, a n d th e ru ra l a rea
D ep artm en t C ap itals
O th er u rb an areas
R u ral A rea R u ral
A rea R u ral
A rea
O th er u rb an areas O th er
[image:23.612.124.492.215.441.2]answer to the question “have these expansions bypassed the poor?” is simply, “yes”. This is a consequence of two facts: capitalization had relatively few effects on the rural
area, and clearly a majority of the poor population is concentrated there.
Ajwad and Wodon (2000) make this point indirectly and formally, by studying to
what extent poor municipalities (of which there are roughly 300 in total) benefit from
expansions in education, health or infrastructure services. They conclude that in
sewerage, electricity, and phone connections, the non-poor clearly benefit more, water
being the only exception. In short, if the entire capitalization process did lead to some
increase in access rates, it is unlikely to have been particularly beneficial to the poor, at
least from a national perspective.
Nevertheless, it is still relevant to explore whether access expansions bypassed the
poor in the urban area, since that would seem the real (and perhaps more reasonable) test
as to the equity side of the capitalization process (as opposed to more general
infrastructure investment). Furthermore, the low coverage rates in the rural areas reflect
inequity but also economic rationality: providing these services can be extremely
expensive when population density is below some threshold level. To this end, the
following figures compare how households have fared according to the (department
capital) quintiles to which they belong, where these are calculated using households per
capita labor income.22. It might well have been desirable to construct these quintiles using consumption or a more complete definition of income, for instance, one that
included transfers and asset-related payments. This was not done mainly because the
questions necessary to construct such measures change between the different surveys
considered.
on the trends.
22
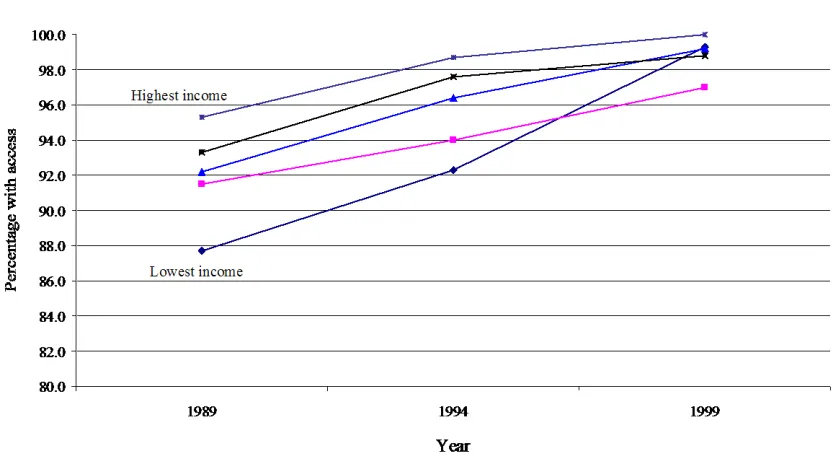
Figure 6 starts with the case of electricity, which has been the sector with the
smallest improvements in access, partially reflecting relatively favorable initial conditions. The figure displays a clear “convergence”: the quintiles with the lowest access levels in 1989 have been those with the greatest increases during 1989-99, an
observation which also holds for the 1994-99 time frame. While in 1989 households in
the lowest quintile had an access rate of only 86 percent, by 1994 all five had rates
exceeding 95 percent. It is surprising that by 1999 the lowest income group seems in fact
to have surpassed all but the richest. In part, this may reflect sampling issues, since when
all groups have high and similar access rates, these differences can cease to be
statistically significant; additionally, 1999 is the year with the smallest sample.
Taking a similar approach, figure 7 reviews the urban areas’ experience with telephone access. The evolution here has been somewhat different from that observed in
the case of electricity. As reviewed earlier, between 1989 and 1994 (the
pre-capitalization period) access rates were essentially flat. Figure 7 reveals that this
[image:25.612.99.518.129.364.2]and declines in connection for the lower income households, where once again, this could
reflect that many rural migrants enter the cities at the bottom of the income distribution.
Figure 7 also shows, however, that these trends changed significantly after
capitalization. Namely, between 1994 and 1999 access rates increased significantly for
all income groups. The relative gap between the two or three bottom quintiles and the
richest has decreased, even if the absolute difference in percentage points has remained
fairly constant. In short, this simple evidence suggests that in the case of telephone
access, liberalization has not merely included the poor, but may have actually reversed
trends that were detrimental to them.
Moving onto the case of water, figure 8 shows an evolution not unlike that
displayed by telephone services. Once again, access rates are relatively stable in the
control period, but increase between 1994 and 1999. The “convergence” in connection
rates is more marked: by 1999 households in all quintiles have access rates above 90
percent, and the differences between them are often not statistically significant.23 It bears
23
It might seem surprising that access rates are not closer to 100 percent for the top quintiles. While this
[image:26.612.101.518.179.403.2]repeating that while these connection rates may seem rather high, this in part reflects the
definition of access used, as detailed in the discussion surrounding table 7.
Finally, figure 9 shows the evolution of access to sewerage. In this case the
information is less consistent. A surprising observation is that some surveys suggest that
the situation of the lowest income quintile is better than that displayed by quintile 2 or
even 3. This may reflect measurement problems, and results in this realm must be
viewed with caution.
To summarize, despite data limitations, the household survey data suggests that
the capitalization/regulation reforms, to the extent that they caused increases in
connection rates, have not bypassed poor households, and have in some cases tended to
benefit poor households disproportionately. This has been particularly the case for phone
services, where competition has made this service much more accessible, and reversed
trends of increasing inequality.
E. Access as affordability: prices and expenditure
The previous section has concentrated on access as connection. As Foster (1999)
and Waddams Price and Hancock (1998) review, however, there are a number of other
price-related channels through which a process like capitalization could have adversely
affected the poor. These include that as a consequence of such reforms:
1) Average tariff levels can increase due to cost recovery requirements and the
need to finance quality improvements. This section shows that while average prices
increased in some sectors, changes were generally not dramatic. In part, this reflects that
because capitalization was not a means to raise deficit finance, there were fewer
incentives for the State to build high tariffs into privatization. The concurrent
implementation of a regulatory framework, and the promotion of competition may have
also helped to keep price increases in check.
2) Tariff structures may be readjusted as direct or cross-subsidies disappear,
either as an explicit policy or as a consequence of market forces. Waddams Price and
below suggest some rebalancing did take place, there are reasons to believe that in
Bolivia, the incentives to rebalance were not as strong. First, some firms affected by the
reforms were private already (e.g. COBEE in electricity). Second, where they were not
private, utilities often functioned as cooperatives. While these are not typical firms, they
do not have the same distributional goals as State enterprises, so these were not there to “abandon” after the reforms. Finally, the vertical separation that some industries displayed before privatization may have meant that cross subsidies were less prevalent
than in other countries. For instance, it is not uncommon for high long distance rates to
subsidize low local charges. In Bolivia, the long distance state provider, ENTEL, was
always separate from the local cooperatives
3) As the industry becomes more “formal”, revenue collection and
discouragement of illegal connections are likely to result in price increases. Once again,
the existence of private firms or cooperatives may have meant that there was not as much
room for improvement in this regard.
4) Privatization may affect the availability and prices of substitutes or
complements.
Making an effort to deal with significant data limitations, this section looks at these
issues in the case of electricity, water, and telephone services.
Electricity
Figure 10 presents the evolution of minimum electricity tariffs, up to 20
Kwh/month, in the three largest cities (for completeness, it includes data from 1992,
while the reforms commenced in 1994). Although these are not average tariffs, they are
likely to be most relevant for poor households. As evident, rates in Cochabamba have
decreased by about 14 percent since capitalization. In contrast, prices have gone up by
Regarding rebalancing, distribution is still carried out by local monopolies that
may experience fewer pressures to engage in this behavior. To explore this issue and
provide further evidence on average prices, table 8 shows the mean tariffs in cents per
Kwh for the three largest distributors, distinguishing according to the type of customer.
As the table shows, both the pre and post capitalization periods have been characterized
by overall real price increases for the residential sector. Nevertheless, this trend seems to
be reversing, with price decreases (or zero increases) visible in Cochabamba and Santa
Cruz by 1998, a behavior consistent with that displayed by minimum prices in figure 10.
The last six columns explore the issue of rebalancing. Although the classification
of customers varies between cities, the data suggest the residential sector has seen greater
increases, but the differences do not always go in this direction and generally do not seem
Table 8
Residential rates for electric distributors in La Paz / El Alto, Cochabamba, and Santa Cruz
Year Tariff rates Percentage change in the residential sector
Percentage change in all sectors
Electropaz
(La Paz / El Alto)
Elfec
(Cbba.)
CRE
(Santa Cruz)
Electropaz Elfec CRE Electropaz Elfec CRE
1992 3.96 5.62 4.45 -- -- -- -- -- --
1993 4.30 5.52 4.47 8.6 -1.8 0.0 9.8 -0.6 1.4 1994 4.60 5.66 4.56 7.0 2.5 2.0 5.3 1.2 1.8 1995 4.89 6.04 4.86 6.3 6.7 6.6 5.2 5.4 5.9 1996 5.04 6.25 5.45 4.2 3.5 12.1 2.9 1.9 6.8 1997 5.34 6.31 5.71 5.9 0.9 4.8 6.3 2.6 4.4 1998 5.74 6.65 5.71 7.5 5.4 0.0 7.4 3.4 -0.4 1999 6.08 6.45 5.52 5.9 -3.0 -3.3 5.4 -1.6 -1.9
Water
As stated, in the case of water “privatization” was really a concession, and only affected La Paz/El Alto. Up to 1996, the state-owned SAMAPA operated with a
complicated tariff structure that contained more than 150 categories, 15 for metered
customers and 135 for the rest. Under this arrangement, consumers were not charged for
the first 10m3, and a study from the time suggests the mean tariff was approximately $US
0.32/m3.
In December of 1996, the National Council of Tariffs voted to amend and
simplify this arrangement. This policy was intended to become effective on December
1996, but in practice was implemented by Aguas del Illimani in May, 1997, along with a
19 percent increase it was granted upon taking over. The prevailing tariff structure is
displayed in table 9.
Table 9
Tariff structures for SAMAPA and Aguas del Illimani
Type of consumer (m3 / month) Tariff ($US/m3) Percentage change Domestic Commercial Industrial SAMAPA Aguas del
Illimani
1 to 30 0.1850 0.2214 19.7
31 to 150 0.3719 0.4428 19.1
[image:31.612.85.532.627.713.2]While this arrangement is relatively progressive, clearly the customers that benefited from the “free” 10m3 would have been hurt. Nevertheless, cross subsidies persist, and while the concession did result in higher tariffs, the increases are smaller than
those in Santa Cruz, where no such reform took place. This is illustrated in figure 11.24
Telephone services
As indicated above, coverage expansions have been greatest in the case of
telephones, so one might expect significant price reductions in this case. These partially
reflect technological innovation and the effects of competition, which as in other
countries seems to have allowed privatization to create rather than destroy service
alternatives. In Bolivia, this happened because prior to reform Telecel had a (private)
monopoly in cellular services, and there is evidence that it priced accordingly. Figures 12 and 13 show the dollar price for the standard service offered from the early 1990’s to
24
October 1996. The fixed monthly tariff of 29.9 dollars did not include free minutes, and
the tariff per minute was 0.41, covering both incoming and outgoing calls. Additionally,
Telecel charged 417 dollars for the initial connection. The entrance of capitalized ENTEL’s subsidiary ENTEL-Movil, permitted the reductions observed. Competition was so effective that although the regulator set a price cap of $US 180 for access and
$US 51 for use, both firms began charging average rates that were roughly five percent of
[image:33.612.101.517.249.511.2]this level.
Figures 12 and 13 are based on ENTEL’s “Family Plan” and Telecel’s“Economy Plan”. Under these connection fees for digital lines are free, the monthly fixed tariff without free minutes dropped to 1.93 dollars in November 1996, and the tariff per minute
increased to 0.45. While in the first period tariffs where set in dollars, in the second
period they were set in bolivianos, becoming subject to currency depreciation. By
December 1999, the dollar value of the fixed tariff dropped to 1.67 and of the per minute
tariff dropped to 0.39. Simultaneously, both ENTEL and Telecel introduced a variety of
other plans and prepayment mechanisms, with the latter contributing to further
These price reductions, combined with the availability of low cost cellular phones
dramatically lowered access prices, particularly compared to the historical performance
of the local telephone cooperatives, which charge prices in excess 1,000 dollars for a
fixed connection/share. As all these markets will be liberalized in 2001, and as the first
PCS operator entered the market at the end of 2000, these trends are expected to continue
if not intensify.
Combining evidence for all these sectors, table 10 shows the average expenditure
levels (in dollars) on water, electricity and telephone services for the different income
quintiles. While all have increased in real terms, there seems to be no consistent pattern
on how these increases have been distributed across income groups. The next section
Table 10
Expenditures on basic services by income quintiles, 1994-1999
1994 expenditure (dollars)
1999 expenditure (dollars)
1994-1999 (% change)
Water Elec. Teleph. Water Elec. Teleph. Water Elec. Teleph.
1 2.9 6.1 7.9 4.5 8.8 11.6 52.9 44.5 47.9 2 3.4 6.7 9.0 5.5 10.1 14.0 62.4 49.5 56.5 3 3.8 7.7 9.0 6.7 12.4 14.5 75.0 61.7 61.2 4 4.5 9.3 12.2 7.6 13.3 17.5 69.6 42.9 43.1 5 7.0 14.1 20.0 11.1 20.3 30.7 58.3 43.5 53.3 Total 4.4 8.8 13.6 7.1 12.8 19.0 62.3 45.5 39.9
Source: Authors’ calculations.
V. The distributional impact of tariff structure changes
As suggested earlier, price changes may have affected different income groups
differentially. Unfortunately, data limitations make getting a handle on this issue difficult
in Bolivia. As Estache et al. (2000) point out, to assess the impact of rebalancing one
needs: i) household level observations on a range of socioeconomic variables, ii) data on
expenditure and physical consumption of utility services; and iii) information on
households which are not connected or are informally connected.
Unfortunately, these requirements are not met with the surveys at hand, which
have several of the disadvantages discussed by Gomez-Lobo, Foster, and Halpern (1999).
The central problem is that they do not record the quantity of electricity, water, or
telephone services consumed. Specifically, in the cases of electricity and water,
assessing the effects of price changes, as Waddams Price and Hancock (1998) do for the
UK, would require knowledge of which tariff rate each household paid each year. This is
difficult to determine without knowledge of the quantities consumed, particularly with
the sometimes intricate tariff structures prevalent before reform. In the case of telephone
services, this issue is even more severe, since it is impossible to differentiate between
expenditures on fixed line and mobile phone services.
Despite these difficulties, this section makes some assumptions to implement the
methodology used by Waddams Price and Hancock. This approach is summarized in the
W = x* (p1– p2)
where W is the change in consumer welfare; p1 and p2 are the average prices in periods
1 and 2, respectively, and x* is average consumption estimated from expenditure and
tariffs; a number between x1 and x2 (with x1 > x2 when p2 > p1).
A limitation is that this methodology does not take into account changes in access,
and while this may well not be a problem for the UK, it clearly matters in Bolivia. As a
result, for the Bolivian case x* is average consumption between x1 and x2, which biases
the measure of welfare change. Additionally, lack of information on average prices and
use of available minimum tariffs instead may cause an underestimate. Given these
restrictions, the results must be taken as an approximation, but hopefully remain
informative as to the distribution of welfare changes over quintiles and regions.25
Table 11 shows that in general, larger absolute losses are observed in Santa Cruz,
while Cochabamba presents some welfare gains. From a distributional perspective, the
absolute losses of the richest quintile are roughly two or three times that of the poorest.
As the last row which describes relative average incomes makes clear, the impact relative
to household income was clearly more adverse for poorer households, and the reforms
appear regressive in this sense.
25
Table 11
Average monthly variation of consumer surplus quintiles, 1994-1999 (in Dollars)
Location Total Quintile 1 Quintile 2 Quintile 3 Quintile 4 Quintile 5 LaPaz/ElAlto-LP/EA Water Electricity Bottled gas Total gain -0.68 -1.39 -0.06 -2.13 -0.47 -0.93 -0.06 -1.46 -0.45 -0.97 -0.06 -1.48 -0.58 -1.25 -0.06 -1.89 -0.62 -1.31 -0.06 -1.99 -1.23 -2.49 -0.06 -3.78 Cochabamba-CBBA Water Electricity Bottled gas Total gain 0.34 1.52 -0.07 1.80 0.26 1.21 -0.06 1.41 0.27 1.40 -0.07 1.60 0.34 1.39 -0.07 1.66 0.33 1.57 -0.07 1.84 0.50 2.21 -0.07 2.63 Santa Cruz-SCZ Water Electricity Bottled gas Total gain -5.68 -1.18 -0.06 -6.93 -4.06 -0.93 -0.06 -5.05 -6.03 -0.97 -0.07 -7.07 -4.56 -1.00 -0.06 -5.62 -5.15 -1.15 -0.06 -6.36 -7.09 -1.48 -0.07 -8.63 LP/EA-CBBA-SCZ Water Electricity Bottled gas Total gain -2.05 -0.54 -0.06 -2.65 -1.23 -0.35 -0.06 -1.64 -1.57 -0.40 -0.06 -2.03 -1.80 -0.48 -0.06 -2.34 -2.09 -0.55 -0.06 -2.71 -3.19 -0.83 -0.07 -4.09 Average income
relative to that of quintile 1
443 100 212 303 497 1104
Source: Authors’ calculations.
VI. Macroeconomic impact
Moving beyond the direct effects on consumers, it is relevant to note
capitalization also had significant impacts on macroeconomic variables, and is part of a
broader transformation in the Bolivian economy. The most visible is the increase in foreign direct investment (FDI) since 1994, partly explained by the capitalized firms’ activities, as shown in figure 14. In the external sector, this had the effect of
strengthening the balance of payments accounts and enhancing their sustainability. The
resilience of total FDI to the downturn that began in 1999 (see figure 1) is an important
factor in explaining why the recession in Bolivia was less severe than that in some
neighboring countries.26
26
In the national accounts FDI helped raised investment from 13.5 percent of GDP
in 1994 to 19.8 in 1999 (see Figure 15). This investment concentrated in several sectors:
oil and natural gas, electricity, bottled gas and oil derivatives, telecommunications and
transportation. As one would expect, these sectors gained importance relative to more “traditional” activities like mining.
Furthermore, the decision to capitalize State firms was considered a “second generation” part of the reforms initiated in 1985, with the usual objective of leaving the private sector in charge of productive activities, in an environment of open markets and
competition. The State remained responsible for regulating, administering the law,
ensuring macroeconomic stability, and investing in social sectors; all of these in an
Figure 16 shows how the composition of public investment gradually came to
reflect these priorities. Although total investment increased by only 3.4 percent, the social sectors’ participation went up from 25 percent in 1994 to 50 in 1999. Investment in production also increased from 8.1 to 15.4 percent, largely greater support of the
agricultural sector. However, investment in production of extractives decreased from
21.1 percent in 1994 to 1.3 in 1999, mainly due to withdrawal from hydrocarbons
production. The decline in infrastructure from 45.7 to 33.5 percent partially reflects
withdrawal from the electricity, telecommunications, and transportation sectors. At the same time, there was a sustained decrease of government’s participation in GDP.
F ig u re 1 5
M a in m a cro eco n o m ic v a ria b les a s p ercen t o f G D P
0 % 5 % 1 0 % 1 5 % 2 0 % 2 5 % 3 0 % 3 5 %
8 0 8 1 8 2 8 3 8 4 8 5 8 6 8 7 8 8 8 9 9 0 9 1 9 2 9 3 9 4 9 5 9 6 9 7 9 8 9 9 C g /G D P I/G D P X /G D P
[image:39.612.102.517.122.354.2]