An Evaluation of Palm Print Recognition Techniques
using DCT, Haar Transform and DCT Wavelets and
their Performance with Fractional Coefficients
ABSTRACT
Palm print recognition is a proliferating technique in the ever increasing use of Biometrics for security and identification. Our paper proposes a technique for palm print recognition using the Discrete Cosine Transform, Haar Transform and the DCT Wavelet along with tests related to their fractional coefficients. After experimental observation on a set of 8000 images, we have found their maximum accuracies to be in the range of 94.4% for each transform. Along with discussing each transform used, we demonstrate how partial energy coefficients can increase accuracy with a 99.5% reduction in computation, as can be inferred from our results.
General Terms
Palm Print Recognition, Biometrics, Wavelet Transforms, Pattern Recognition
Keywords
Palm Print, Biometrics, Haar, DCT, Wavelet, Kekre.
1. INTRODUCTION
One of the most rapidly developing and embraced techniques for identification currently lies in the field of Biometrics. It involves the usage of certain inherent facets or traits of humans in order to identify them. Biometrics can be divided into two discrete types: Physiological and Behavioural. One of the most accurate and reliable of the Physiological Biometrics Techniques is Palm print Identification. Palm Prints have been in use for over a century as identification standards. In fact, many of the methodologies used in fingerprint identification have now been adapted to palm prints [3].A palm print is essentially the large inner surface of the hand. It possesses certain discernable and unique characteristics, which can be easily extricated using Palm print Capture Devices. These devices provide us with an image called a friction ridge impression [3]. The impression can then be checked for the unique characteristics which include principal lines, ridges, minutiae points, singular points and texture[15][16][2][8]. A palm print is a physical feature that remains unaltered for a very long time, much like a fingerprint. However, the impetus of using palm prints in biometrics has been slower since palm recognition involves using larger images and more complex algorithms, thus causing restraints in computing capabilities and live-scan technologies [3][9][10][11].
One key feature in palm print identification is deciding how the image is to be taken for identification purposes. The images taken generally involve the entire hand of the subject. The problem with using the entire hand is that the area of the hand except for the palm can also be included in the identification process. In some cases, this may lead to obfuscation of the image and thus, may lead to faulty identification. One way to resolve this issue is by cropping the entire image to give us only that area of the image which contains the palm itself. This area is termed the “Region of Interest” (R.O.I.) as shown in Figure 1. In our procedure, we have used pre-processed palm prints with the ROI already removed using algorithms already in use [2] [4].
Fig.1 A on the left is a 2D-PalmPrint image from the Capture Device. B is the ROI image extricated from A
and used for processing [4].
2. LITERATURE REVIEW
The main challenge in PalmPrint Recognition is its practical application in a ubiquitous, lost-cost and facile fashion. Also, high accuracy must be provided with some regard for high computing speeds. Thus, accuracy cannot be compensated for lower complexity. Palm print algorithms generally involve vast numbers of calculations being done across thousands of images. A number of algorithmic techniques have been applied for Palm Print Recognition. On a general level, one can say that these techniques involve the determination and matching of certain friction ridge impressions. These techniques involve the usage of minutiae based matching, correlation based matching and ridge-based matching [3].
Most palmprint recognition techniques today, involve the extraction of feature vectors corresponsing to the palm print images and subjecting them to tests related to distance metrics [2]. These may include coding-based techniques which entails the coding down of the features
Aditya A. Tirodkar
B.E. (Comps) Student ThadomalShahaniEngg.College,
Bandra (W), Mumbai-50, India.
Dr.Tanuja K. Sarode
Asst. Professor ThadomalShahaniEngg.College,
Bandra (W), Mumbai-50, India.
Dr. H. B. Kekre
Sr. Professor, MPSTME, SVKM’s NMIMS (Deemed-to-be University, Vileparle(W), [image:1.595.322.518.421.518.2]into data structures and then comparing; line based techniques which use line features in the palm print and appearance based methods such as Linear Discriminant Analysis which are quicker techniques but much less accurate due to simpler analysis.
The usage of transforms in palmprint analysis takes into consideration the entire energy constituted by the palm print. For this purpose, a matrix of the palm print is obtained and transformations are applied on it using matrices corresponsing to the given transform. It so happens that such transformations segregate the energy of the image into a particular part of the transformation. The energy of the image is the part of the image that constitutes the image most unique characteristics. It is thus, crushed to one single part of the image. On cropping the image to regions which can only give these energy values, we see that accuracy is increased with a corresponding major decrease in computing requirements. The three transforms that we have used in this paper are the discrete cosine transform, the Haar Matrix and the DCT Wavelet all of whose results are compiled and checked for data comparison.
3. IMPLEMENTATION
Before we get to the actual implementation of the algorithm, let us see some pre-processing activities. Firstly, the database used consists of 8000 greyscaleimages of 128x128 resolution which contain the ROI of the palmprints of the right hand of 400 people. It was obtained from the Hong Kong Polytechnic University 2D_3D Database [17]. Here, each subject had ten palm prints taken initially. After an average time of one month, the same subject had to come and provide the palm prints again. Our testing set involved the first set of 4000 images and the second involved the next 4000. All these processing mechanisms were carried out in MATLAB R2010a. The total size of data structures and variables used totalled more than 1.07 GB.
(a)
(b)
Fig.2 Given Above are Two sets of Palm Prints from two different individuals. Within each set, the left image was taken in the initial test whereas the right image was taken a month later.
3.1Preprocessing:
Initially, all transforms were applied on the above images without any form of pre-processing. It was seen that as in the case of the right set above, the images taken one month later differed from their initial copies in areas such as hue. However, the original information about ridges and texture was not found to be missing. The hue change however, did lead to a large loss in accuracy.
To give a clearer picture of this, when the DCT transform was applied on these images, they gave an accuracy of 74%. When segregated into groups of 100 images, accuracy was as low as 43% in some cases and as high as 99%. These fluctuations proved most unnecessary. On carefully looking at the image, one can see that the details of ridges and lines are still easily discernable. Thus, some form of contrasting which can make the important details more visible is required. One such form of contrasting is called Histogram Equalization [12].
[image:2.595.320.519.345.465.2]Our results were found to be much better once Histogram Equalization was applied to the images and we ended up using it on our entire training as well as testing sets.Figure 3 shows the constrast between the original Image and Histogram Equalized Image.
Fig 3. Original Image and Histogram Equalized Image
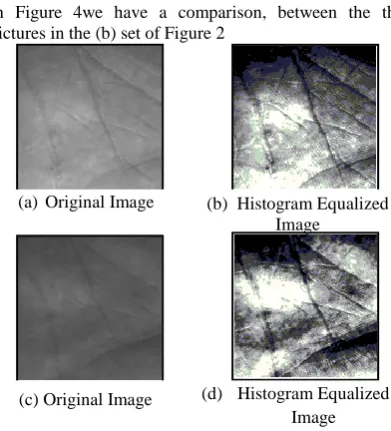
In Figure 4we have a comparison, between the the pictures in the (b) set of Figure 2
Fig 4. Sample Palm Print Images after Histogram Equalization
a. Original Image b. Histogram Equalized Image
(a)Original Image (b) Histogram Equalized Image
[image:2.595.78.273.480.703.2] [image:2.595.321.517.504.720.2]Its pretty obvious that in the equalized images, the different minutiae that constitute the palm print’s unique characteristics are more clearly visible. In the algorithm to be implemented, we are going to use the mean square error to calculate simliarity between images. In such a case, every unique characteristic is converted into an energy variable signifying entropy which when taken together constitutes one value for an entire image. Here, if the needless portions such as the area of the palm not constituting a ridge is removed, better and more concrete values for the entire image can be theoretically assumed. In the results tabulated, one can see that this assumption is found to be valid.
4. TRANSFORMS USED
A transform is essentially a coding model that is greatly used in video/image processing. Transforms work on the premise that a particular pixel exhibits a certain corelation with its neighbouring pixels. This premise is found to be be rather validated in video transmission systems. Thus, using transforms we can correctly predict the value of a pixel from its neighbouring pixels and the transformation essentially maps this correlation into transformed (uncorrelated) coefficients [1]. Thus, a large amount of information about a pixel can be obtained only from its neighbours.
One particularly striking feature of Transforms is that they essentially represent the entropy of an image’s pixels in the form of blocks. Thus, in the transformed image it may be seen that most of the energy is isolated towards a particular end, thus decorrelating the pixels and providing us a block of data equivialent to the image’s entropy. Thus, the number of pixels required for representation can be reduced greatly. These reduced sets of pixels are called Fractional Coefficients. Thus, by using a smaller amount of data from a larger set, we can carry out more effective analysis, a point we have touched on before.
4.1 Discrete Cosine Transform
Based on Chebyshev Polynomials [14], the Discrete Cosine Transform is used greatly in image compression techniques. The DCT used in images is called the two dimensional DCT. It works as an extension of the 1D-DCT which incorporates the usage of fast Fourier Transforms [1].
𝑩𝒑𝒒
= 𝜶𝒑𝜶𝒒 𝑨𝒎𝒏𝐜𝐨𝐬
𝝅 𝟐𝒎 + 𝟏 𝒑 𝟐𝑴
𝑵−𝟏
𝒏=𝟎 𝑴−𝟏
𝒎=𝟎
𝐜𝐨𝐬𝝅 𝟐𝒏 + 𝟏 𝒒 𝟐𝑵
… (1)
Equation 1 represents the fundamental equation for a Discrete Cosine Transform. As one can see, it works by obtaining the average values of sequences over the entire image, thus extrapolating pixel correlations. The values ofαpand αqare obtained from equation 2.
1
M
p
1
i f
M
2
0
p
i f
M
1
p
α
1
N
q
1
i f
N
2
0
q
i f
N
1
q
α
... (2) [image:3.595.327.521.415.601.2]It is seen that in equation 1, a matrix is obtained which is orthogonal in nature. This matrix, when multiplued with is transpose provides us with a top left basis function. This function, constant in value is called as the DC coefficient. All others are called as AC coeffients. Since the DCT is symmetric, orthogonal and separable, it is of extreme use in palm print recognition. Its ability to compact energy in one corner of the transformed image is also of great use [1].
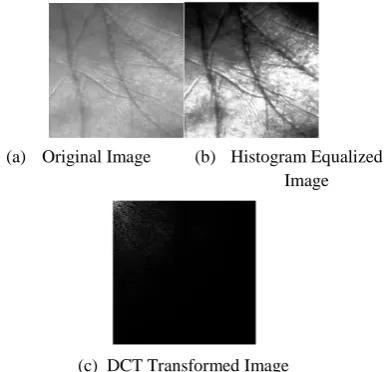
Fig 5. Images at different Stages of Transformation with the DCT Transform
4.2 Haar Transform
A Haar transform is the oldest and possibly the simplest wavelet basis [5][24]. It was developed in 1909 by Afred Haar. It consists of square shaped functions which like Fourier Analysis lead to the representation of functions in an orthonormal function basis. A Haar wavelet uses both low-pass filtering using the average of pixel values as well as high-pass filtering by using the difference, for image decomposition and first works on image columns (a) Original Image (b) Histogram Equalized
Image
and then on image rows [5]. For understanding a Haar Wavelet, first let us consider its underlying functions:
Ѱ 𝑡 =
1; 0 ≤ 𝑡 <
12−1;
12≤ 𝑡 ≤ 1
0; 𝑂𝑡ℎ𝑒𝑟𝑤𝑖𝑠𝑒
…(3)
Thus, in the Haar matrix, it is seen that in the transform, as the columns progress, for values of t, the matrix element is given either a value 1 or -1 depending upon its position with respect to t. the variable t is related to the order of the Haar transform to be used for the process. Now, after the matrix is made, each single row is divided by the square root of the square of the elements of the row. Thus, an elementary Haar matrix of 2X2 would look like:
𝐻
2= 1 1
1 −1
…(4)
Here, the two rows are to be multiplied by the square root of 2, for obtaining the final answer.A basic Haar matrix of the 4th order is given below:
𝐻
4=
1
4
1 1
1 1
1 1
−1 −1
2 − 2
0
0
0
0
2 − 2
…(5)
The Haar matrix when multiplied with an image along with the Haar matrix’s transpose provides us with a transform that contains both the frequency and location information of the image’s pixels[5]. Thus, it is of
immense use in the creation of Discrete Wavelet Transforms.
Fig6. Images at different Stages of Transformation with the Haar Transform
4.3DCT Wavelet
A wavelet is a mathematical tool that can e used to extract information from many kind of data, including images [7]. Wavelets have the unique property of being completely maleable to suit the specific properties required for a particular image processing technique. Thus, in images containing distortion, discontinuous signal values, wavelets areespecially useful. Especially in the field of data compression, wavelets have been seen to be immensely useful, providing better reconstruction capabilities. In our case, we have used the DCT Wavelet which as one can understand, is a wavelet constructed from the DCT Transform matrix given above. The construction of a wavelet involves discrete steps which involve a transformation of the original matrix. Let us illustrate this with a simple example:
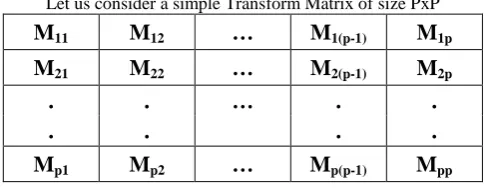
Let us consider a simple Transform Matrix of size PxP
M
11M
12…
M
1(p-1)M
1pM
21M
22…
M
2(p-1)M
2p.
.
…
.
.
.
.
.
.
[image:4.595.176.421.555.650.2]M
p1M
p2…
M
p(p-1)M
ppFig.7Transform Matrix (PXP)
(c) Haar Transformed Image
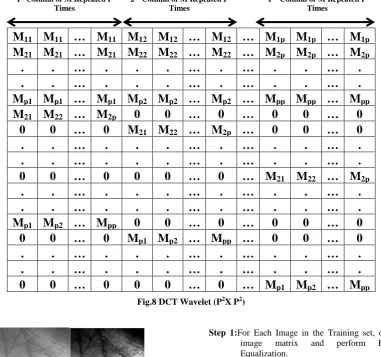
Its wavelet can be easily generated since it is of the form P X P. The wavelet will be of the size P2 X P2 [7]:
1st Column of M Repeated P Times
2nd Column of M Repeated P
Times
Pth Column of M Repeated P
Times
M
11M
11… M
11M
12M
12… M
12… M
1pM
1p… M
1pM
21M
21… M
21M
22M
22… M
22… M
2pM
2p… M
2p.
.
…
.
.
.
…
.
…
.
.
…
.
.
.
…
.
.
.
…
.
…
.
.
…
.
M
p1M
p1… M
p1M
p2M
p2… M
p2… M
ppM
pp… M
ppM
21M
22… M
2p0
0
…
0
…
0
0
…
0
0
0
…
0
M
21M
22… M
2p…
0
0
…
0
.
.
…
.
.
.
…
.
…
.
.
…
.
.
.
…
.
.
.
…
.
…
.
.
…
.
0
0
…
0
0
0
…
0
… M
21M
22… M
2p.
.
…
.
.
.
…
.
…
.
.
…
.
.
.
…
.
.
.
…
.
…
.
.
…
.
M
p1M
p2… M
pp0
0
…
0
…
0
0
…
0
0
0
…
0
M
p1M
p2… M
pp…
0
0
…
0
.
.
…
.
.
.
…
.
…
.
.
…
.
.
.
…
.
.
.
…
.
…
.
.
…
.
[image:5.595.106.488.121.478.2]0
0
…
0
0
0
…
0
… M
p1M
p2… M
ppFig.8 DCT Wavelet (P2X P2)
Fig 9. Images at different Stages of Transformation with the DCT Wavelet Transform
5. PROPOSED ALGORITHM
The following steps give us a clear picture of the algorithm used for palm print identification in our proposed system:
Step 1:For Each Image in the Training set, obtain the image matrix and perform Histogram Equalization.
Step 2:For Every Single Image in Training set, calculate the required Transformation.
Step 3:Repeat step 1 and step 2 for all images in the Training Set.
The above steps constitute the creation of Feature Vectors for the Training sets. Now, for the purpose of testing, the following steps are to be followed:
Step 1: Obtain the Image Matrix of thequery image.
Step 2:Perform Histogram Equalization and obtained the required Transfromation.
Step 3:Obtain the minimum mean square error between the Query image and the Feature vector and display the index of the Training Image which gave the lowest mean square error with the queryimage, as its closest match.
Initially, DCT is carried out on an image with no pre-processing gave us a result of 74% accuracy. In comparison with the accuracy values given in Table 1, we can see that the improvement is drastic. As stated above, in a transform the entropy values are generally crowded in one discrete part of the transform matrix. Our endeavour was to find out the part of the matrix that gave us this optimal value. For this purpose, we removed the fractional coefficients [3] of the images. These are also termed as partial energy coefficients.
(a) Original Image (b) Histogram Equalized Image
Table 1: Image matching results of DCT, Haar and DCT Wavelet Transforms on 128x128 images resized to 256x256 and fractional co-efficients removed from them.
Image
Dimensions DCT Haar
DCT Wavelet
256x256 92 92 92 128x128 91.675 91.7 92.05 96x96 92.125 92.675 92.425 84x84 92.35 93.05 92.725 64x64 92.95 93.425 93.425 32x32 94.05 93.925 94.325 28x28 94.225 94.025 94.425 26x26 94.275 94.05 94.45
25x25 94.375 94.1 94.4 24x24 94.375 94.375 94.325 22x22 94.4 94.025 94.225 21x21 94.425 93.95 94.125 20x20 94.45 93.825 94.05 19x19 94.4 93.7 93.975
[image:6.595.327.514.71.269.2]18x18 94.425 93.6 93.875 16x16 94.25 93.475 93.725
Fig.10.The coloured regions correspond to the fractional coefficients cropped from the original
image, seen in black.
A fractional co-efficient is the cropped up part of an image as related to the original size of the image. Thus, an image of 25x25 is the 0.95% fractional coefficient of the original image of 256x256. Thus, the processing required is found to decrease by a similar amount [3].
Fig.11. A graphical representation of the Values obtained in Table 1..
From the Figure 11, it is quite apparent that the accuracy of palm print matching does not decrease with a decrease in fractional coeffients. On the contrary, it is seen to increase and reach a peak value in the range 25x25 to 20x20. To understand the implications of this finding, let us consider the sheer amount of processing that comes into play in the calculation of the mean square error between 256x256 images. The number of calculations required for Mean Square Error is obtained by the following equation:
[image:6.595.66.520.107.570.2]((2N2- 1) additions +( N2+ 1)multiplications ...(6) Here, N is the order of the image matrix.
Table 2: Numerical Comparison of Operations
Parameter Value for 256x256 Value for 25x25
No. of
Images 4000 in each set 4000 in each set
No. of Operations
per Image
Add: 131,071 Mul: 65,537 Total: 196,609
Add: 1249 Mul: 626 Total: 1875
It is generally understood that a multiplication operation requires far more CPU units than an addition operation, in some cases 8 units as compared to a single addition
P
er
ce
nta
g
e
Acc
ura
cy
Partial Coefficient
DCT Haar DCT WAVELET
256
[image:6.595.309.530.623.728.2]one. Assuming this in the 25x25 case, as compared to the original 256x256 image we get a decrease in units consumed corresponding to 0.95% of the original number. This too with an increase of over 2% in accuracy.
6. CONCLUSION
In closing, it is safe to surmise that we have provided a perspicacious review of the resulting effects of the application of DCT, Haar Transforms and the DCT Wavelet on Palm Print images. We have obtained accuracies reaching a maximum of 94.45% for DCT, 94.375% for the Haar Transform and 94.45% for the DCT Wavelet each in a range of partial coefficients from 26x26 to 20x20 or 1.03% to 0.61% of the original image. The same operations on the original 256X256 image would require approximately 105 times as many computations. It is evident that these coefficients also lead to anappreciable drop in the processing operations required. Hence, we can conclude that the given transforms and wavelets have a high efficacy in palm print recognition, especially considering the use of their partial energy (fractional) coefficients.
7. REFERENCES
[1] Syed Ali Khayam.,xsx“The Discrete Cosine Transform (DCT): Theory and Application.” ECE 802-602: Information Theory and Coding. Seminar 1.
[2] Kiochi Ito, Takafumi Aoki, Hiroshi Nakajima, Koji Kobayashi, Tatsuo Higuchi. “A Palmprint Recognition Algorithm Using Phase-Based Image Matching. ICIP 2006. Pgs. 2669-2672.”
[3] H.B. Kekre, Sudeep D. Tepade, Ashish Varun, Nikhil Kamat, Arvind Viswanathan, Pratic Dhwoj. “Performance Comparison of Image Transforms for Palm Print Recognition with Fractional Coefficients of Transformed Palm Print Images.” I.J.E.S.T. Vol.2(12), 2010, 7372-7379.
[4] Wei Li, Li Zhang, Guangming Lu, Jingqi Yan. “Efficient Joint 2D and 3D Palmprint Matching with Alignment Refinement.”23rd IEEE Conference on
Computer Vision and Pattern Recognition, San Francisco, USA. June 13-18, 2010.
[5] Mohammed Alwakeel, Zyad Shaahban, “Face Recognition Based on Haar Wavelet Transform and Principal Component Analysis via Levenberg-Marquardt Backpropagation Neural Network.”European Journal of Scientific Research. ISSN 1450-216X Vol.42 No.1 (2010), pp.25-31. [6] Xiangqian Wu, David Zhang, Kuanquan Wang.
Fischerpalms based palmprint recognition. X. Wu et al. / Pattern Recognition Letters 24 (2003) 2829– 2838
[7] H.B. Kekre, Dr. Tanuja K. Sarode, Sudeep D. Thepade, Sonal Shroff. “Instigation of Orthogonal Wavelet Transforms using Walsh, Cosine, Hartley, Kekre Transforms and theiruse in Image Compression.” IJCSIS. Vol. 9. No. 6, 2011.Pgs. 125-133.
[8] D. Zhang, “Palmprint Authentication.” Kluwer Academic Publication, 2004.
[9] Parashar.S;Vardhan.A;Patvardhan.C;Kalra.P “Design and Implementation of a Robust Palm Biometrics Recognition and Verification System”, Sixth Indian Conference on Computer Vision, Graphics & Image Processing.
[10]http://www.ccert.edu.cn/education/cissp/hism/03904 1.html (last referred on 29 Nov 2010)
[11]Kumar.A;Wong.D;Shen.H;Jain.A(2003):“Personal Verification Using Palm print and Hand Geometry Biometric.” Proc. of 4thInternational Conference on Audio-and Video-Based Biometric Person Authentication (AVBPA)”, Guildford, UK.
[12]http://www.mathworks.in/help/toolbox/images/ref/h isteq.html.
[13]Acharya and Ray, “Image Processing: Principles and Applications,” Wiley-Interscience 2005 ISBN-0-471-71998-6
[14][14] Nasir Ahmed. “How I Came Up with the Discrete Cosine Transform.”Digital Signal Processing 1, pages 4-5 (1991).
[15]Zhang, D., 2000. “Automated Biometrics: Technologies and Systems”. Kluwer Academic Publishers.
[16]Zhang, D., Shu, W., 1999. Two novel characteristics in palmprint verification: Datum point invariance and line feature matching. Pattern Recognition. 32, 691–702.
[17]PolyU 3D Palmprint Database, http://www.comp.polyu.edu.hk/~biometrics/2D_3D _Palmprint.htm
[18]W. Li, D. Zhang, L. Zhang, G. Lu, and J. Yan, "Three Dimensional Palmprint Recognition with Joint Line and Orientation Features", IEEE Transactions on Systems, Man, and Cybernetics, Part C, In Press.
[19]W. Li, L. Zhang, D. Zhang, G. Lu, and J. Yan, “Efficient Joint 2D and 3D Palmprint Matching with Alignment Refinement”, in: Proc. CVPR 2010.
[20]D. Zhang, G. Lu, W. Li, L. Zhang, and N. Luo, "Palmprint Recognition Using 3-D Information", IEEE Transactions on Systems, Man, and Cybernetics, Part C: Applications and Reviews, Volume 39, Issue 5, pp. 505 - 519, Sept. 2009. [21]W. Li, D. Zhang, and L. Zhang, "Three Dimensional
Palmprint Recognition", IEEE International Conference on Systems, Man, and Cybernetics, 2009.
[22]D. Zhang, G. Lu, W. Li, L. Zhang, and N. Luo, "Three Dimensional Palmprint Recognition using Structured Light Imaging", 2nd IEEE International Conference on Biometrics: Theory, Applications and Systems, BTAS 2008, pp. 1-6
[23]Charles K. Chui, An Introduction to Wavelets, (1992), Academic Press, San Diego, ISBN 0585470901
8. AUTHOR BIOGRAPHIES
Dr. H. B. Kekre has received B.E. (Hons.) in Telecomm. Engineering.from Jabalpur University in 1958, M.Tech (Industrial Electronics) from IIT Bombay in 1960, M.S.Engg. (Electrical Engg.)from University of Ottawa in 1965 and Ph.D. (System Identification) from IIT Bombay in 1970 He has worked as Faculty of Electrical Engg. and then HOD Computer Science and Engg. at IIT Bombay. For 13 years he was working as a professor and head in the Department of Computer Engg. at Thadomal Shahani Engineering. College, Mumbai. Now he is Senior Professor at MPSTME, SVKM’s NMIMS. He has guided 17 Ph.Ds, more than 100 M.E./M.Tech and several B.E./ B.Tech projects. His areas of interest are Digital Signal processing, Image Processing and Computer Networking. He has more than 300 papers in National / International Conferences and Journals to his credit. He was Senior Member of IEEE. Presently He is Fellow of IETE and Life Member of ISTE Recently seven students working under his guidance have received best paper awards. Currently 10 research scholars are pursuing Ph.D. program under his guidance.
Dr. Tanuja K. Sarode has Received Bsc.(Mathematics) from Mumbai University in 1996, Bsc.Tech.(Computer Technology) from Mumbai University in 1999, M.E. (Computer Engineering) degree from Mumbai University in 2004, Ph.D. from Mukesh Patel School of Technology, Management and Engineering, SVKM’s NMIMS University, Vile-Parle (W), Mumbai, INDIA. She has more than 11 years of experience in teaching. Currently working as Assistant Professor in Dept. of Computer Engineering at Thadomal Shahani Engineering College, Mumbai. She is life member of IETE, member of International Association of Engineers (IAENG) and International Association of Computer Science and Information Technology (IACSIT), Singapore. Her areas of interest are Image Processing, Signal Processing andComputer Graphics. She has more than 100 papers in National /International Conferences/journal to her credit.
![Figure 1. In our procedure, we have used pre-processed palm prints with the ROI already removed using algorithms already in use [2] [4]](https://thumb-us.123doks.com/thumbv2/123dok_us/8127081.795802/1.595.322.518.421.518/figure-procedure-used-processed-prints-removed-using-algorithms.webp)