A Comparative Study of Different Density based Spatial
Clustering Algorithms
K. Nafees Ahmed
Research Scholar, Department of Computer Science, Jamal Mohamed College (Autonomous),
Tiruchirappalli, Tamil Nadu, India
T. Abdul Razak,
Ph.DAssociate Professor, Department of Computer Science, Jamal Mohamed College (Autonomous),
Tiruchirappalli, Tamil Nadu, India
ABSTRACT
Clustering is an important descriptive model in data mining. It groups the data objects into meaningful classes or clusters such that the objects are similar to one another within the same cluster and are dissimilar to other clusters. Spatial clustering is one of the significant techniques in spatial data mining, to discover patterns from large spatial databases. In recent years, several basic and advanced algorithms have been developed for clustering spatial datasets. Clustering technique can be categorized into six types namely partitioning, hierarchical, density, grid, model, and constraint based models. Among these, the density based technique is best suitable for spatial clustering. It characteristically consider clusters as dense regions of objects in the data space that are separated by regions of low density (indicating noise).The clusters which are formed based on the density are easy to understand, filter out noise and discover clusters of arbitrary shape. This paper presents a comparative study of different density based spatial clustering algorithms, and the merits and limitations of the algorithms are also evaluated.
General Terms
Algorithms, Cluster Analysis, Data Mining, Databases, Patterns
Keywords
Machine Learning, Asymmetric, Knowledge Discovery in Database, Density Based Clustering, Spatial Databases.
1.
INTRODUCTION
Spatial data mining is an emerging research field that is still in the early stage. Recently, due to the broad applications of global positioning systems (GPS) technology, web-based spatial data sharing and mapping, high-resolution remote sensing and location-based services, more research areas have been created or gained access to high-quality geographic data to incorporate spatial information and analysis in various fields such as geographic information systems (GIS), geo-marketing, traffic data, image database exploration, medical imaging, crime mapping, social analysis, census data, etc. [1] [2].
Spatial data mining is the process of discovering interesting, nontrivial and previously unknown but potentially useful patterns from large spatial datasets. It is more difficult to extract the useful patterns from spatial datasets than the traditional numeric and categorical data due to the complexity nature such as huge volume, high dimension, dynamic, multi-type of spatial data, spatial association and spatial autocorrelation [3].
Clustering has its roots in many areas including machine learning concept, pattern recognition technology, statistics, and biology etc. In machine learning, this clustering technique is called unsupervised learning.
It is the process of grouping data objects such that similar objects are placed in the same group and dissimilar objects, in different groups. Dissimilarities are assessed based on the attribute values describing the objects. In other terms, the objects are clustered or arranged based on the principle of maximizing the intraclass similarity and reducing interclass similarity.
Cluster analysis has been broadly used for the organization of spatial data. These spatial data are more complex, highly dynamic and huge in volume than the normal datasets. Application of spatial data clustering includes the detection of seismic faults by grouping the entries of an earthquake catalog, the creation of thematic maps in geographic information system, crime clusters, clustering of weather patterns, clustering of restaurants, clustering of disease, clustering for house construction, and clustering of road traffic etc.
Since the density based method group data objects based on similar density region, it is very effective and more suitable for spatial databases. It considers a cluster as high density region when compared to its encompassing region. In large spatial database applications, the clustering algorithms need the following requirements [4]:
1. Less domain knowledge to decide input parameters, since in many applications the suitable values are difficult to know in advance.
2. Detecting arbitrary shaped clusters, since the spatial databases have different cluster shapes.
3. Good effectiveness on large databases.
There are six methodologies that can be implemented for clustering namely partitioning, hierarchical, density, grid, model, and constraint based models. In this paper, the study on density based methods is emphasized. Fifteen algorithms were compared namely DBSCAN, DBCLASD, GDBSCAN, DENCLUE, OPTICS, DBRS, IDBSCAN, VDBSCAN, LDBSCAN, ST-DBSCAN, DDSC, DVBSCAN, DBSC, DMDBSCAN, and DCURS based on six important factors such as time complexity, required input parameters, handling of varied density, handling of arbitrary shape, robustness to noise and insensitiveness to data input order.
Section 3 introduces the approach of density based notion of clusters. Section 4 discusses fifteen density based clustering algorithms with its advantages and disadvantages. Section 5 concludes with a comparison of fifteen algorithms and some direction for future work.
2.
CLASSIFICATION
OF
CLUSTERING
METHODS
The clustering methods are categorized into six groups: partitioning method, hierarchical method, density based method, grid based method, model based method, and constraint based method [5].
2.1
Partitioning Method
A partitioning algorithm arranges the objects into k partitions (k ≤ n), where each partition denotes a cluster, for a given D, a database of n objects and the required number of clusters k. The data objects are classified into k groups, based on the following conditions: (1) each group must have at least one object and (2) each object must belong to precisely one group. To improve the partitioning, it uses an iterative relocation procedure which moves objects from one group to another. The common measure of a good partitioning is that objects in the same cluster are closer to one another, than objects of different clusters.
This method is not suitable to discover clusters of complex shapes and for clustering very large data sets.
2.2
Hierarchical Method
It constructs a hierarchical decomposition, a tree structure called dendrogram, which iteratively divide D (given set of data) into smaller subsets until each subset contains single object. In this hierarchy, each node of the tree represents a cluster of the given data. The dendrogram can either be formed from the leaves up to the root (agglomerative approach) or from the root down to the leaves (divisive approach) by merging or dividing clusters at each step. These algorithms do not need k (number of clusters) as an input. But, in order to specify when the merge or split process should be stopped, a termination condition has to be defined.
The advantage over partitioning method is that, this method does not need k as an input parameter.
The disadvantage is that it is unable to backtrack and do correction, once the merge or split decision has been executed.
2.3
Density Based Method
Most of the partitioning methods can find only spherical-shaped clusters and do not perform well in discovering of arbitrary shapes, since they work based on distance measures.
To overcome the above problems, density-based method has been developed, based on the notion of density. The basic idea is to continue increasing the given cluster as long as the density (number of objects or data points) in the neighborhood exceeds some threshold. That is, the neighborhood of a given radius has to obtain at least a minimum number of points, for each data point within a given cluster.
The main advantage of this method is that it discovers clusters of arbitrary shapes and can also be used to filter out noise.
2.4
Grid Based Method
This method uses a multi-resolution grid data structure. It quantizes the object space into a limited number of cells that
form a grid structure on which all of the operations for clustering are performed.
The main advantage of this method is its fast processing time, which is typically independent of the number of data objects, yet dependent on only the number of cells in each dimension in the quantized space.
2.5
Model Based Method
This method theorizes a model for each of the clusters and finds the best fit of the data to the given model. This may locate clusters by building a density function that reflects the spatial distribution of the data points.
It also helps to automatically determine the number of clusters based on statistic standards, taking “noise” or outliers into account and thus yielding robust clustering method.
2.6
Constraint Based Method
In this, the clustering is performed by including user-specified or application-oriented constraints. A constraint denotes a user’s expectation or describes “properties” of the desired clustering results, and provides an effective way for communicating with the clustering process.
Various kinds of constraints can be specified such as constraints on individual objects, constraints on the selection of clustering parameters, constraints on distance or similarity measures, user-specified constraints on the properties of individual clusters, semi-supervised clustering etc.
The major benefit is that the clustering process can be made with user interaction or guidance, which guides more wanted results.
3.
A DENSITY BASED NOTION OF
CLUSTERS
The density-based notion is a general approach for clustering. The core initiative of density based clustering algorithm is that the objects which form a dense region should be assembled together into one cluster. To determine the dense regions, a fixed threshold value is used. Regions of higher density in a feature space that are separated by regions of lower density are searched.
Density based clustering can be defined as follows [4]:
Definition 1: (Neighborhood) It is determined by a distance function (e.g., Manhattan, Minkowshi and Euclidean distances) for two points a and b, denoted by dist (a, b).
Definition 2: (Eps-neighborhood) The Eps-neighborhood of a point p, denoted by NEps (p), is defined by NEps (p) = {q ∈ D | dist (p, q) ≤ Eps}.
Definition 3: (Core object) if the Eps-neighborhood of an object contains at least a minimum number, MinPts, of objects, then the object is called a core object.
Definition 4: (Border object) an object p is a border object, if it is not a core object but density-reachable from another core object.
Definition 5: (directly density-reachable) A point p is directly density-reachable from a point q with respect to Eps and MinPts if
1. p ∈ NEps (q) and
Obviously, directly density-reachable is symmetric for pairs of core points. But, in broad, if one core point and one border point are involved, it is not symmetric as in Fig. 1.
Fig 1: Asymmetric case of directly density-reachable
Definition 6: (density-reachable) A point p is density-reachable from a point q with respect to Eps and MinPts if there is a chain of points p1, ..., pn, p1 = q, pn = p such that pi+1 is directly density-reachable from pi as shown in Fig. 2.
Fig 2: Density-reachability
Definition 7: (density-connected) A point p is density-connected to a point q with respect to Eps and MinPts, if there exists a point o such that both p and q are density-reachable from o. It is a symmetric relation. For points which are density reachable, density-connectivity is a reflexive relation as shown in Fig.3.
Fig 3: Reflexive relation of Density-connectivity
Definition 8: (Cluster) Let D denote a database of points. A cluster C is a non-empty subset of D with respect to Eps and MinPts, if it satisfies the following conditions:
1. Maximality - ∀ p, q: if p ∈ C and q is density-reachable from p with respect to Eps and MinPts, then q ∈ C.
2. Connectivity - ∀p, q ∈ C: p is density-connected to q with respect to Eps and MinPts.
Definition 9: (noise) Let C1,..., Ck be the clusters of the database D with respect to parameters Epsi and MintPtsi, i= 1, ..., k. Then we define the noise as the set of points in the database D not belonging to any cluster Ci, i.e. noise = {p ∈ D | ∀ i:p ∉ Ci}.
4.
CLUSTERING ALGORITHMS BASED
ON DENSITY BASED METHOD
4.1
DBSCAN (Density Based Spatial
Clustering of Applications with Noise)
Martin et al. [4] proposed the first density based traditional algorithm for spatial clustering, called DBSCAN, which develops in regions with sufficiently high density into clusters and discovers clusters of arbitrary shape with noise from spatial databases. It describes a cluster as a maximal set of density-connected points.
Clusters grow according to a density based connectivity analysis. It looks for clusters by examining the
Eps-neighborhood of each point in the database. If the Eps-neighborhood of a point ‘p’ contains more than MinPts, a new cluster with ‘p’ as a core object is formed. It then iteratively gathers directly density reachable objects from this core, which may involve the merge of a few density reachable clusters. The process ends, when the new point can be added to any cluster. Every object which is not included in any cluster is considered as ‘noise’.
DBSCAN needs two parameters namely Eps and MinPts of each cluster and at least one point from the respective cluster. But, it is difficult to get this information in advance for all clusters of the database. However, there is a simple and efficient heuristic to discover these parameters. Hence, for all clusters the DBSCAN uses global values for Eps and MinPts.
The benefits are
DBSCAN finds out clusters of random shape efficiently than CLARANS
DBSCAN outperforms CLARANS in terms of accuracy
Effectively handle noise
No need to assume a fixed number of clusters
4.2
DBCLASD (A Distribution Based
Clustering Algorithm for Mining in Large
Spatial Databases)
The problem of detecting clusters of points belonging to a spatial point process arises in many applications. To overcome this problem, a new clustering algorithm DBCLASD is introduced by Xu et al. [6] based on the assumption that the points inside a cluster are uniformly distributed.
DBCLASD is an incremental algorithm, placing a point into a cluster is based only on the points processed so far without considering the whole cluster or the whole database. It incrementally expands an initial cluster by its neighboring points as long as the nearest neighbor distance set of the resulting cluster fits the expected distance distribution. Based on region queries, it retrieves neighboring points which are best supported by spatial access methods such as R*-trees.
While the incremental approach is essential for the efficiency of DBCLASD on large databases, it implies a natural dependency of the discovered clustering from the order of generating and testing candidates from the database. Dependency is reduced by including two vital features:
1. Failed candidates are not discarded but tried again later.
2. Points that are previously allotted to some cluster may change to another cluster later.
The advantages of DBCLASD include:
It discovers clusters of arbitrary shape without the need of any input parameters
It outperforms CLARANS and DBSCAN without the need for any preprocessing
The run time is about three times of DBSCAN It also works efficiently on real databases where the
4.3
GDBSCAN (Generalized Density Based
Spatial Clustering of Applications with
Noise)
To generalize the DBSCAN algorithm, Sander et al. [7] presents GDBSCAN, which clusters point objects as well as spatially extended objects according to both spatial and non-spatial attributes. It requires three parameters namely a neighborhood predicate (NPred), a weight function (wCard) and a minimum weight (MinCard). GDBSCAN begins with an arbitrary point p and picks up all points that are density-reachable from p with respect to NPred and MinWeight. If p is a core point, it produces a density-connected set with respect to Npred and MinWeight. If p is not a core point, and no points are density-reachable from p, then p is allocated to noise. This procedure is iteratively applied to each point p which has not yet been classified.
GDBSCAN outperforms DBSCAN in two ways such that it can cluster point objects, and spatially extended objects based on both spatial and non-spatial attributes.
4.4
DENCLUE (DENsity Based
CLUstEring)
The problem with the existing approaches in the context of clustering multimedia data is that most algorithms are not designed for clustering high-dimensional feature vectors and therefore, the performance declines rapidly with rising dimension. In addition, only few algorithms can deal with noise presented in databases, where usually only a small portion of the database forms the attractive subset which accounts for the clustering.
To overcome the above problems, Hinneburg et al. [8] presents a new algorithm for clustering in large multimedia databases called DENCLUE. The fundamental idea of this approach is to model the overall point density logically as the sum of influence functions of the data points. Clusters can then be recognized by determining density-attractors (the local maxima of overall density function) and clusters of arbitrary shape can be easily expressed by a simple equation based on the overall density function. It introduces two forms of clusters namely center-defined cluster and arbitrary-shape cluster.
This algorithm works in two steps. The first step is a pre-clustering step, in which a record of the related portion of the data space is constructed. This record is used to speed up the calculation of the density function which is required for accessing neighboring portion of the data space efficiently. The second step is the actual clustering step, where it discovers the attractors and the corresponding density-attracted points.
In this approach, there are two significant parameters, namely σ and ξ. The parameter σ determines the influence of a point in its neighborhood and ξ describes whether a density-attractor is important, permitting a reduction in the number of density-attractors and assists to improve the performance.
The advantages of this algorithm are
It has a firm mathematical origin
Even with large amount of noise, it has excellent clustering properties
It allows a compact mathematical picture of arbitrary shaped clusters in high-dimensional data sets
It is appreciably faster than the DBSCAN algorithm.
4.5
OPTICS (Ordering Points to Identify
the Clustering Structure)
In many real world datasets, there does not exist a global parameter setting for which the result of the clustering algorithm describes the intrinsic clustering structure accurately. To overcome this problem, a new algorithm called OPTICS is proposed by Ankerst et al. [9] for the purpose of cluster analysis which does not generate a clustering of a dataset explicitly, but creates an augmented ordering of the database specifying clustering structure. Ordering of this cluster is equal to the density-based clustering connected to a broad range of parameter settings. It is an adaptable source for both automatic and interactive cluster analysis.
It is an extension of DBSCAN algorithm in which the variation is that it does not allocate cluster memberships. Instead, it stores the order in which the objects are processed and the information which would be used by an extended DBSCAN to allocate cluster memberships. This information consists of two values for each object namely (i) Core-distance and (ii) Reachability-Core-distance.
Thus, the benefit is that it removes repeatedly not only usual clustering information but also the essential hierarchical clustering structure.
4.6
DBRS (A Density Based Spatial
Clustering Method with Random Sampling)
Even though DBSCAN gives really good results and is efficient in various datasets, it may not be appropriate for finding of clusters with widely varied density, clusters which depend on non-spatial attributes, and managing of very large datasets. To overcome these problems, Wang et al. [10] proposed a novel algorithm DBRS.
DBRS starts with a random point q and finds its matching neighborhood, i.e., all points that are purity-density-reachable from q. Then it discovers the matching neighborhood, which is called qseeds. The q is considered as core point, only if the number of matching neighbors of q is at least MinPts and the purity is at least MinPur; otherwise q is noise or a border point. If q is a core point, the algorithm verifies whether its neighborhood intersects any identified cluster. The clusters are prearranged in a list called Cluster List. If qseeds meets with a single obtainable cluster, DBRS combines qseeds into this cluster. If qseeds meets with two or more existing clusters, it merges qseeds and those clusters together. Otherwise, a new cluster is formed from qseeds. After probing the neighborhood of one point, the algorithm chooses another arbitrary, unclassified point and repeats the above process until all data point in the dataset is clustered or is labeled as noise.
The advantages of DBRS are
Identify clusters of highly varying shapes and densities
Identify clusters which depend on non-spatial attributes
Identify approximate clusters in very large databases.
4.7
IDBSCAN (An Improved Sampling
Based DBSCAN for Large Spatial
Databases)
support, as it operates on the entire database. To overcome this, an improved version of DBSCAN called IDBSCAN is presented by Borah et al. [11], which can handle large spatial databases with minimum input and output cost.
It is an improved sampling-based DBSCAN which can cluster large-size spatial databases efficiently. The main disadvantage of DBSCAN algorithm is that it uses its major time in every object’s region query. Hence, instead of expanding each object within the region of core objects, IDBSCAN proposed to expand only those objects which are at the border region. This is because the expansion of border objects would cover the objects which have been enclosed by the objects, placed inside the region of core object, if they had been expanded.
The experimental results show that
IDBSCAN is faster than DBSCAN
It is less sensitive with the variation of MinPts It outperforms DBSCAN in terms of execution time It is capable of handling large volume of data.
4.8
VDBSCAN (Varied Density Based
Spatial Clustering of Applications with
Noise)
In several real world datasets, clusters with respect to different densities are all also helpful for analysis. It is essential to discover both dense clusters and sparse ones. But, the existing density-based algorithms have a difficulty in finding out all the significant clusters for datasets with varied densities. Conventional algorithms, such as DBSCAN and DENCLUE, can have the trouble with density, if the density of clusters varies extensively. OPTICS is also weak at finding out information of clusters in sparse datasets though it is fine at finding them in dense areas [12].
To overcome the above problem, Liu et al. [13] presents a new algorithm called VDBSCAN for the aim of varied-density datasets study. The fundamental idea of VDBSCAN is that, prior to applying traditional DBSCAN algorithm; some methods can be used to select numerous values of parameter Eps for different densities according to a k-dist plot. With different values of Eps, it is feasible to discover clusters with varied densities concurrently.
The algorithm works as follows: First, it calculates and stores k-dist for each object and division k-dist plots. Then the number of densities is set by k-dist plot. It chooses parameters Epsi automatically for each density at the third step. Fourthly, it scans the dataset and cluster different densities using corresponding Epsi. Finally, it displays the valid clusters corresponding with varied densities.
The main advantage of VDBSCAN is that it successfully identifies clusters with varied-density datasets.
4.9
LDBSCAN (A Local Density Based
Spatial Clustering Algorithm with Noise)
The key property of many real world datasets is that their intrinsic cluster structures are unable to differentiate by global density parameters. As a consequence, very different local densities may be required to disclose clusters in different regions of the data space.
The conventional DBSCAN algorithm which uses a global density parameter is not suitable. Though OPTICS gives an improved ordering of the database to represent its density-based clustering structure, it generates only the clusters having local-density that exceeds certain thresholds but not
similar local-density cluster. Also, it does not produce clusters of a dataset clearly.
To overcome these troubles, Daun et al. [14] proposed a new algorithm called LDBSCAN, relying on a local-density based notion of clusters. In this approach, the concept of local outlier factor (LOF) for each object in a dataset is introduced which represents the degree of outlierness [15]. LOF and local reachability density (LRD) are used later to detect clusters in a datasets and the noise data that do not belongs to any of clusters.
To find a cluster, it starts with an arbitrary point p and pulls through all points that are local-density-reachable from p with respect to pct and MinPts. If p is a center point, this process yields a cluster. If p is not a center point, it will verify with the next point of the database.
The benefit of LDBSCAN is that it provides better results than OPTICS and defeats the limitation of DBSCAN. In addition, it gets the gain of the LOF to find out the noises contrast with other density-based clustering algorithms.
4.10
ST-DBSCAN (An Algorithm for
Clustering Spatial-Temporal Data)
The majority studies in knowledge discovery in databases (KDD) [16] focus on discovering clusters from ordinary data (non-spatial and non-temporal data). So, they are unreasonable to use for clustering spatial-temporal data. The knowledge discovery process for spatial-temporal data is more complex than for non-spatial and non-temporal data. Because, spatial-temporal clustering algorithms have to consider the spatial and temporal neighbors of objects in order to extract valuable knowledge.
With the above inspiration, a new density-based clustering algorithm ST-DBSCAN is proposed by Birant et al. [17] which is based on the DBSCAN. Anatomy to the existing algorithms, ST-DBSCAN has the power to find out clusters according to spatial, temporal and non-spatial values of the objects. ST-DBSCAN improves DBSCAN algorithm in three important directions. First, this algorithm can cluster spatial-temporal data according to its non-spatial, spatial and temporal attributes. Second, DBSCAN is unable to detect some noise points, if the clusters of different densities exist. ST-DBSCAN solves this by assigning a density factor to each cluster. Third, the values of border objects in a cluster are very dissimilar than the opposite side border objects, if the non-spatial values of neighbor objects contain small differences and the clusters are contiguous to each other. It is resolved by equating the average value of a cluster with new future value.
While DBSCAN requires two input parameters, ST-DBSCAN needs four parameters namely Eps1 (distance parameter for spatial attributes such as latitude and longitude), Eps2 (distance parameter for non-spatial attributes), MinPts (minimum number of points within Eps1 and Eps2) and ∆ε (Threshold value).
The algorithm begins with the first point p in database D and recovers all points density-reachable from p with respect to Eps1 and Eps2. If p is a core object, a cluster is formed. If p is a border object, no points are density-reachable from p and the algorithm visits the next point of the database. This process is repeated until all of the points have been processed.
Able to discover the clusters on spatial-temporal data
Able to find noise objects when clusters of different densities exist
It solves the conflicts in border objects.
4.11
DDSC (A Density Differentiated
Spatial Clustering Technique)
There are only a few algorithms that can detect clusters with different densities, though many algorithms exist for finding clusters with different sizes and shapes. The basic density based clustering algorithms such as DBSCAN and DENCLUE treats clusters as regions of high densities separated by regions of low densities. So they can handle clusters of different sizes and shapes as well sorting out noise effectively. However the algorithms fail to recognize clusters with different densities except that the clusters are separated by sparse regions.
Even though the algorithms such as OPTICS, DENCLUE and SNN can give the solution for the above problem by detecting clusters of different densities, shapes and sizes, more execution time is required in OPTICS. Also, DENCLUE and SNN use several parameters. To overcome these, a new algorithm called DDSC is proposed by Borah et al. [18] as an alternative to the above algorithms.
The DDSC is an extension of DBSCAN algorithm to detect clusters with differing densities. Extracted clusters are non-overlapped spatial regions such that within a region the density is reasonably uniform. Adjoining regions are separated into different clusters if there is a considerable change in densities. The clusters may be contiguous i.e. not separated by any sparse region as needed by DBSCAN. Thus, the natural clusters in a dataset can be extracted.
The algorithm divides the given dataset into a set of spatial regions (clusters) such that the nearby regions radically vary in density. Smaller amount of local density variations exist within a cluster, however going from the present region to a neighboring region larger amount of local density variations will be noticed.
It begins a cluster with an identical core object and goes on expanding it by including other directly density reachable identical core objects until non-homogeneous core objects, that specify wide variation in densities, are detected.
The advantages of this algorithm are
It is less susceptible to the input parameters It is not very much order reliant
4.12
DVBSCAN (Density Variation Based
Spatial Clustering of Applications with
Noise)
Ram et al. [19] presents DVBSCAN, an extension of DBSCAN algorithm to handle the local density variation that exists within the cluster based on the concept that it starts the creation of the cluster by selecting core object. Then, it computes Cluster Density Mean (CDM) of the growing cluster before allowing the expansion of an unprocessed core object. Afterwards, it computes Cluster Density Variance (CDV) including the ε-neighborhood of the unprocessed core object. If the CDV of the growing cluster with respect to CDM is less than a specified threshold value α and the difference between the minimum and maximum objects lying in ε-neighborhood of the objects, which are the objects of
growing cluster, including the ε-neighborhood objects of unprocessed core object, is less than a specified threshold value λ then only an unprocessed core object is permitted for growth. If not, the object is just added into the cluster.
In addition to two global parameters used by DBSCAN, this DVBSCAN includes two more parameters namely α and λ, which are used to limit the amount of allowed local density variations within the cluster.
The main advantage of this algorithm is that it outperforms the DBSCAN, especially in case of density variation within the clusters. The detected clusters are not only separated by sparse region but also by the regions which have density variations.
4.13
DBSC (Density Based Spatial
Clustering)
To consider both spatial proximity and attribute similarity, a new algorithm called DBSC is proposed by Qiliang et al [20]. This algorithm involves two main processes: In the first process, it constructs spatial proximity relationships for irregularly distributed dataset. During the second process, it applies clustering to spatial objects with similar attributes. It needs two parameters namely β and T1. With the given attribute threshold T1, DBSC can be implemented in three steps:
1. Construction of spatial neighborhood, which involves three operations:
(i) For the spatial database of N objects, build the Delaunay triangulation.
(ii) According to Global_Distance_Constraint, delete the Global_Long_Edges from the Delaunay triangulation. (iii) According to Local_Distance_Constraint, remove the Local_Long_Edges from the Delaunay triangulation.
2. For each object, find out its density indicator, then sort the objects in downward order and determine the default value of T1.
3. Apply spatial clustering by the following operations: (i) Choose a spatial clustering core Pi, and rank the expanding cores in Neighbors(Pi) according to their density indicator. (ii) Add the expanding cores to Pi in downward order based on density indicator; they are supposed to be both spatial directly reachable and spatial reachable from Pi and initial cluster is created.
(iii) For each K-order neighbor of Pi (K ≥ 2), the first object to be added to the initial cluster is chosen. Then, iteratively objects can be added by operation (ii).
(iv) A spatial cluster is obtained, when no objects can be added to the cluster starting at Pi.
(v) Employ operations (i)-(iv) iteratively. When all of the objects have been determined, the clustering procedure is completed. Those objects that are not added to any of the clusters are recognized as noise.
The benefits of this algorithm are
Effectively find out clusters with arbitrary shape, clusters of uneven density, and clusters of different densities in existence of noise.
Objects in the same cluster are both proximal in spatial domain and similar in attribute domain.
4.14
DMDBSCAN (Dynamic Method
DBSCAN)
algorithm DMDBSCAN. The fundamental idea is that by some methods, find out suitable values of parameter Eps for different levels of densities according to k-dist plot, and then apply traditional DBSCAN algorithm to discover clusters. For each value of Eps, DBSCAN algorithm agrees to discover all the clusters with respect to the equivalent density level. In the next step, ignore all points which have been clustered. The final result will avoids marking both denser areas and sparser ones as single cluster.
The advantage of this algorithm is that it outperforms the DBSCAN and DVBSCAN by producing good quality results.
4.15
DCURS (Density Based Clustering
Using Representative Set)
The conventional DBSCAN algorithm demands large memory supports and high I/O costs. The DBRS algorithm increases the cluster efficiency, but it deteriorates the cluster accuracy. In order to overcome these problems, a new algorithm called DCURS has been proposed by Zhou et al. [22] which incorporates the principle of proximity and limited area to improve the cluster accuracy and stability.
The key idea is to look for Eps-neighborhood and expanded points by the parameters Eps without increasing time and space complexity. At the same instance, it chooses representative points from limited area (Eps, 2Eps) with the principle of proximity. The expanded points may be divided into four types namely core point with intersections, core point without intersections, non-core point with intersections, and non-core point without intersections based on the two conditions (i) whether it is core point itself (ii) whether the common points between Eps-neighborhood and
corresponding core point’s Eps-neighborhood exist. It then stores the expanded points into the set S in ascending order to their distances from corresponding core point. The first element is extracted from S to expand a cluster every time during clustering, and when S is empty a cluster generated.
The advantages are
It cuts down time complexity and improves cluster accuracy
The experimental result shows good clustering for sparse and uneven datasets.
5.
CONCLUSION
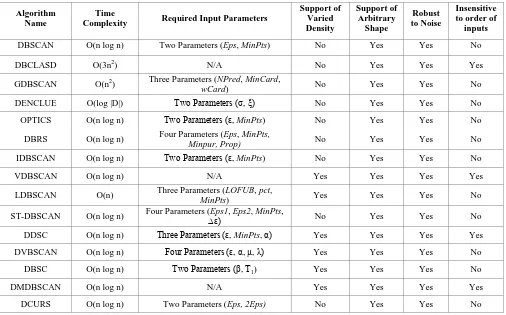
[image:7.595.49.555.445.760.2]Among the different types of available clustering techniques, the density based is best suitable for discovering arbitrary shaped clusters in large spatial databases. Various significant concepts related to spatial data mining and the basic classification of clustering methods are discussed. In this paper, fifteen density based clustering algorithms are discussed with their significances. These algorithms are analyzed based on the six important factors such as time complexity, required input parameters, support of varied density, support of arbitrary shape, handling of noise and insensitive to order of inputs. Each algorithm is unique with its own features. A comparison of these algorithms is given in Table 1. The cluster accuracy of these algorithms would be verified and improved with synthetic and real datasets in the future work.
Table 1. Comparison of Different Density Based Spatial Clustering Algorithms
Algorithm Name
Time
Complexity Required Input Parameters
Support of Varied Density
Support of Arbitrary
Shape
Robust to Noise
Insensitive to order of
inputs
DBSCAN O(n log n) Two Parameters (Eps, MinPts) No Yes Yes No
DBCLASD O(3n2) N/A No Yes Yes Yes
GDBSCAN O(n2) Three Parameters (NPred, MinCard,
wCard) No Yes Yes No
DENCLUE O(log |D|) Two Parameters (σ, ξ) No Yes Yes No
OPTICS O(n log n) Two Parameters (ε, MinPts) No Yes Yes No
DBRS O(n log n) Four Parameters (Eps, MinPts,
Minpur, Prop) No Yes Yes No
IDBSCAN O(n log n) Two Parameters (ε, MinPts) No Yes Yes No
VDBSCAN O(n log n) N/A Yes Yes Yes Yes
LDBSCAN O(n) Three Parameters (LOFUB, pct,
MinPts) Yes Yes Yes No
ST-DBSCAN O(n log n) Four Parameters (Eps1, Eps2, MinPts, ∆ε) No Yes Yes No
DDSC O(n log n) Three Parameters (ε, MinPts, α) Yes Yes Yes Yes
DVBSCAN O(n log n) Four Parameters (ε, α, µ, λ) Yes Yes Yes No
DBSC O(n log n) Two Parameters (β, T1) Yes Yes Yes No
DMDBSCAN O(n log n) N/A Yes Yes Yes Yes
6.
REFERENCES
[1] M.S Chen, J. Han, and P.S Yu, “Data mining, an overview from database perspective,” IEEE Transactions on Knowledge and Data Engineering, 1997.
[2] S.E Spielman and J.C Thill, “Social area analysis, data mining and GIS,” Computers Environment and Urban Systems, vol. 32, pp. 110-122, 2008.
[3] Shashi Shekhar, Pusheng Zhang, Yan Huang and Ranga Raju Vatsavai, “Research accomplishmets and issues on spatial data mining,” 2003.
[4] M. Ester, H-P. Kriegel, J. Sander, and X. Xu, “A Density-based algorithm for discovering clusters in large spatial databases with noise,” in Proc of 2nd Int. Conf. on
Knowledge Discovery and Data Mining (KDD-96), 1996.
[5] J. Han and M.Kamber, “Data mining concepts and techniques,” Morgan Kaufmann Publishers, 2006.
[6] X. Xu, M. Ester, H. P. Kriegel and J. Sander, “A distribution based Clustering algorithm for mining in large spatial databases, in Proc of 14th Int. Conf. on Data Engineering (ICDE-98), pp. 324-331, 1998.
[7] J. Sander, M. Ester, H-P Kriegel, and X. Xu, “Density-Based Clustering in Spatial Databases: The Algorithm GDBSCAN and Its Applications,” Data Mining and Knowledge Discovery, vol. 2, no. 2, pp. 169-194, 1998.
[8] A. Hinneburg, and Daniel A. Keim, “An efficient approach to clustering in large multimedia databases with noise,” in Proc of 4th Int. Conf. on Knowledge Discovery
and Data Mining (KDD-98), pp. 58-65, 1998.
[9] M. Ankerst, M. Breunig, H-P Kriegel, and J. Sander, “OPTICS: Ordering Points To Identify the Clustering Structure,” in Proc of ACM-SIGMOD Int. Conf. on Management of Data (SIGMOD-99), pp. 49-60, 1999.
[10]X. Wang, and H. J. Hamilton, “DBRS: A Density-Based Spatial Clustering Method with Random Sampling,” in Proc. PAKDD, pp. 563-575, 2003.
[11]B. Borah and D.K. Bhattacharyya, “An improved sampling-based DBSCAN for large spatial databases,” Int. Conf. on Intelligent Sensing, pp. 92-96, 2004.
[12]A.K. Jain and R.C Dubes, “Algorithms for clustering data,” Prentice-Hall, Inc., 1988.
[13]P. Liu, D. Zhou, and N. Wu, “Varied density based spatial clustering of applications with noise,” in Proc of IEEE Conference (ICSSSM-07), pp. 528-531, 2007.
[14]L. Duan, L. Xu, F. Guo, J. Lee and B. Yan, “A local-density based spatial clustering algorithm with noise,” Information Systems, vol. 32, pp. 978-986, 2007.
[15]M.M Breunig, H.-P. Kriegel, R.T. Ng, and J. Sander, “LOF: identifying density-based local outliers,” in Proc of ACM SIGMOD Int. Conf. on Management of Data, pp. 93-104, 2000.
[16]M. Halkidi, Y. Batistakis, and M. Vazirgiannis, “On clustering validation techniques,” Journal of Intelligent Information Systems, pp. 107-145, 2001.
[17]D. Birant and A. Kut, “ST-DBSCAN: An algorithm for clustering spatial-temporal data,” Data and Knowledge Engineering, pp. 208-221, 2007.
[18]B. Borah, and D.K. Bhattacharyya, “DDSC: A density differentiated spatial clustering technique,” Journal of Computers, vol. 3, no. 2, pp. 72-79, 2008.
[19]A. Ram, S. Jalal, Anand S. Jalal, and M. Kumar, “A Density based Algorithm for Discovering Density Varied Clusters in Large Spatial Databases,” Int. Journal of Computer Applications (IJCA), vol. 3, no. 6, 2010.
[20]Qiliang Liu, Min Deng, Yan Shi and Jiaqiu Wang, “A density-based spatial clustering algorithm considering both spatial proximity and attribute similarity,” Computers and Geosciences, Elsevier Ltd., vol. 46, pp. 296-309, 2012.
[21]Mohammed T.H. Elbatta and Wesam M. Ashour, “A Dynamic Method for Discovering Density Varied Clusters,” Int. Journal of Signal Processing, Image Processing and Pattern Recognition, vol. 6, no. 1, pp. 123-134, 2013.