Applied Minimized Matrix Size Algorithm on the
Transformed Images by DCT and DWT used for
Image Compression
Mohammed Mustafa Siddeq
Technical College,Software Engineering Dep., Kirkuk.
Ghadah Al-Khafaji, PhD.
Dept. of Computer Science, Baghdad University, College of Science.
ABSTRACT
In this paper a simple image compression scheme is proposed, it is based on using two transformation techniques in the frequency domain of DWT and DCT to decompose the image signal and then using Minimize-Matrix-Size algorithm to efficiently encode the compress information that reduces high-frequency matrix size, and makes it easy to be compressed by arithmetic coding. The test results of the suggested method are promising compared with JPEG and JPEG2000 international standards techniques.
General Terms
Dual transformation techniques with efficient coding architecture for lossy image compression.
Keywords
DWT, DCT, Minimize-Matrix-Size algorithm, SS-Algorithm.
1.
INTRODUCTION
Compression methods are being rapidly developed to compress large data files such as images, where data compression in multimedia applications has lately become more vital [1]. Today with the increasing growth of technology and the entrance into the digital age that has lead to the construction of universally accepted standard systems that play a key role in the development of compression systems. These combine efficiency, ease of use and speed with the ability to fulfil a variety of requirements, where JPEG (Joint Photographic Experts Group) represents the extremely useful and well known international standard image compression techniques that utilizes discrete cosine transform (DCT) that characterized by simplicity and reduction efficiency between 10 and 15 times the original image size, without visual degradation [2]-[4], that generally based on divide the image into segments due to the fact DCT was designed to work with periodic states, and each segment is then a subject of the transform, creating a series of frequency components that correspond with detail levels of the image [5]-[7].
A step beyond JPEG is the JPEG2000 that is based on wavelet transform [8,9] which is more efficient than its predecessor JPEG and overcomes its drawbacks [10]. Currently, there’s an increase role of utilization wavelet in image compressiondue to the fact that it provides high image quality with high compression ratios [11].
In this paper, a simple method for compressing gray images is introduced that bases on exploited the DWT and DCT for obtains more high-frequency and less DC-coefficients, and utilized minimize matrix size algorithm to reduce high frequency domains that efficiently improve compression
performance. The rest of paper organized as follows, section 2 contains comprehensive clarification of the proposed system; the results for the proposed system and the conclusions, is given in sections 3 and 4, respectively.
2.
THE PROPOSED SYSTEM
The main concerns in the proposed system:
Utilize wavelet transform that characterized by very good energy compaction capabilities, robustness under transmission, high compression ratio [9], due to exploits both the spatial and frequency correlation of data by contractions and translations of mother wavelet on the input data, supports the multi-resolution analysis of data and symmetric nature [1,12,13,14].
By incorporating the DCT on the approximation band (LL) which contains low variation part of the image data that significantly reduce the energy of the LL part that leads to increase the efficiency of the compression rates [8,11,15].
Minimize Matrix Size Algorithm is used to efficiently compressed the coded information along with arithmetic coding.
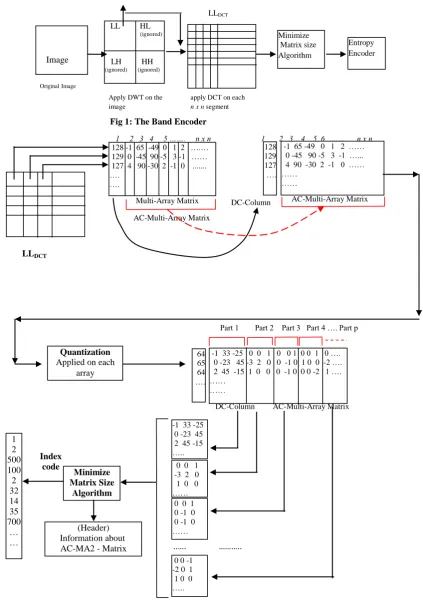
The proposed system shown in Figure 1 and the implementation is explained in the following steps:
Step 1: Load the input uncompressed image I of size N×N. Step 2: Perform wavelet transform that decompose image into approximation and detail sub bands (LL, LH, HL and HH), only the approximation sub-band (LL) utilized, since the details of the other sub-bands are very small they can be set to zero without significantly changing the image [6,8].
Step 3: Partition the LL subband into nonoverlapping blocks of fixed size n×n, and performs the DCT to the LL band blocks according to the equation (1) [16].
) 1 ( 2 ) 1 2 ( cos 2 ) 1 2 ( cos ) , ( ) ( ) ( ) , ( 1 0 1 0 n v y n u x y x I v C u C v u
T n t t
x n y t t t t Where 1 ) ( , ) ( 0 , for 2 1/ ) ( , ) ( otherwise v C u C v u v C u C t t t t t t
34 coefficients with small values can be discarded without
[image:2.595.335.479.461.569.2]significantly affecting image quality, for more details see [6,12].
Step 4: Applying Minimize Matrix Size Algorithm (as explained in Figure 2 is used, to encode the n×n blocks of DCs and ACs coefficients). To obtain high compression gain the following steps are applied:
1. Converts each block n×n from LLDCT into one dimensional array. These one dimensional arrays are collected as a matrix, this matrix are called Multi-Array-Matrix (Matrix), as shown in Figure 2. The first column from MA-Matrix is represents all DC-coefficients, and other columns are represents high-frequency coefficients. For example assume each block size 4×4, the array size will be contains 16 coefficients. The first position represents DC value, and others 15 are represents AC coefficients. MA-Matrix size depends on the number of blocks in LLDCT. Assume the size of LLDCT=64×64, partitioned into 4×4 blocks, MA-Matrix size is 256×16, which means MA-Matrix contains 256 arrays, and each array contains 16 data.
2. Perform quantization process for each array in MA-Matrix, such as: i Quality m i on
Quantizati ()[ ] (2) Where m is maximum value in LL sub-band and
i=1,2,3,…. n×n.
This quantization process represents dot division, which depends on the maximum value in LL sub-band, and Quality value of range limited {0.01- 0.1}, less value represents best image quality, and greater value represents low image quality. 3. Separates DC-coefficients column from MA-Matrix, where
the DC-Column represents low frequency values for LLDCT,
that characterized by all the values are positive and they are correlated. So, the differences between two neighbor values are required, in which the process is called Difference Between two Values (DBV), as illustrated in Figure 3.
DC(i)DC(i)DC(i1) (3)
Where i=1,2,3,…, k-1, k is size of DC.
[image:2.595.80.245.574.676.2]This technique makes the DC-Column values are uncorrelated, and help arithmetic coding to obtain more compression ratio.
Fig 3: The Difference between Two Values on DC-Column
4. The AC-MA-Matrix separated into different groups, in other words partitioned into p-parts; each part contains three columns (see Figure 2), the following steps are applied: a) Converting each array at AC-MA2-Matrix into one column contains positive integer values, by computing the
probabilities of occurrence for the arrays in AC-MA2-Matrix, and assigning index for each array, these indices are called Index-Code, as shown in Figure 4. Probabilities of the arrays are stored as a header of information, this operation is look like the Shannon coding [6,11], but the difference this approach not need to build minimum binary code for the higher probability.
b) Converts the Header -Information-Matrix for the AC-MA2-Matrix to array contains floating point value, by computing through multiplication operation between weight values and each Header-Matrix, where the weights values it is a random numbers between {0...1}and these numbers are limited within 4 digits after floating point, this column is called AC-Column, as shown in Figure 5. The basic idea for creating AC-Column it will be easy to convert it into stream of bits and encrypt it. This part may be useful for security, because just the AC-Column is represents important information about the transformed image. If the AC-Column values are damaged, the decompressed image will be degraded or damaged.
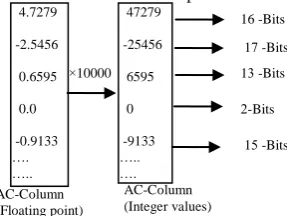
Step 5: Applying entropy encoder on the saving compressed information using the arithmetic coding techniques. The coded information composed of DC coefficients, Index-Code and AC-Column, where the DC coefficients, Index-Code can be coded directly using arithmetic coding to produce stream of bits. While the AC-Column coded using binary code after multiplying each value by 10000 to be an integer, because as shown in Figure 6 the values of this column are floating point values and the values are not repeated or correlated.
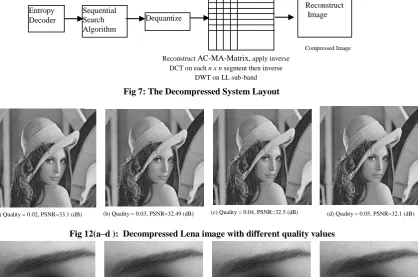
To reconstruct the decompressed image all the above steps will be reversed as explained in Figure 7 and the implementation is explained in the following steps:
Step 1: Apply arithmetic decoding to reconstruct Index-Code, DC-Column and AC- Column. The Index-Code reconstruct directly, while the DC-Column required to takes the last value at position k , add it to value at position k-1, then the total adds with the value at position k-2, this process will continue until reach at position 1, using the following equation, as illustrated in Figure 8.
) 4 ( ) ( ) 1 ( ) 1
(i DCi DCi
DC
Where i= k, (k-1), (k-2), (k-3),…,1
After apply DBV DC-Column
Apply Arithmetic Coding to produce stream of bits : 100010001111….etc 100 101 95 96 90 100 110 …. …. 1 6 -1 6 -10 -10 …. ….
Fig 5: Header-Information-Matrix converted into AC-Column
×
AC- Column = Weights Header Information Matrix 2 30 -1 -1 -20 1 1 -2 0 0 0 0 -1 0 00.9133 0.1269 0.9057 4.7279 -2.5456 0.6595 0.0 -0.9133
Fig 6: Example of converting AC-Column from floating point into integer values
The AC-Column are reconstructed by take each binary code convert it into an integer value, then divide each value by 10000 to obtains floating point values.
Step 2: Using Sequential Search Algorithm to:
a) Reconstruct Header-Information as floating point from binary code, as shown in Figure 9. This algorithm is designed to reconstruct original data of the Header-Information-Matrix, because the Header-Information-Matrix contains the original data for AC-MA2-Matrix. The SS-Algorithm used for searching the missing data within limited values of AC-Column corresponding to minimum and maximum value for each column in Header-Information-Matrix that represented as a one-dimensional array stored as minimum and maximum values.
The SS-Algorithm decompression concepts start from three values S1, S2 and S3, these values responsible for estimates;
column-1, column-2 and column-3 respectively in Header-Information-Matrix. S1, S2 and S3 are working as an digital
clock, starting from S1 to be increment by number 1, after
reach to the limit (i.e., maximum value), S1 will return to the
minimum value then S2 start to increment and so on, and this
means the S1 is represents inner loop and S2 is outer loop and
S3 is outer loop contains S2 and S1. At each iteration, the
SS-Algorithm compares the result of S1, S2 and S3 with
AC-Column. Where S1, S2 and S3 are represents estimated values
for each row in Header-Information-Matrix. The main reason to choose just three columns, because the SS-Algorithm finds the exact data much faster, if the number of columns are increased the SS-Algorithm will be more slower, and take more times to find exact data. This technique implemented using the following algorithm:
Sequential Search Algorithm (SS-Algorithm)
P=1; % pointing to first position in limits value
S1_Min= information[ P ].min; % minimum values for 1st column
S1_Max= information[P+1].max;% maximum values for 1st column S2_Min= information[P+2].min; % minimum values for 2nd column
S2_Max= information[P+3].max; % maximum values for 2nd column
S3_Min= information[P+4].min; % minimum values for 3rd column
S3_Max= information[P+5].max;% maximum values for 3rd column For k=1 to AC-Column size
S1 = S1_Min; S2 = S2_Min; S3 = S3_Min;
While ( Sum not equal to AC-Column[k] )
Sum = S1*W[1] +S2*W[2]+S3*W[3];% W : represent weight values
IF (Sum equal AC-Column[k]) Stop While – loop ELSE S1++; IF (S1 > S1_Max) S1=S1_Min; S2++ End;
IF (S2 > S2_Max) S2=S2_Min; S3++ End;
IF (S3 > S3_Max) S3=S3_Min; End;
End;
Header-Information[k][1]=S1;
Header-Information[k][2]=S2;
Header-Information[k][3]=S3;
End; End;
b) Reconstruct AC-MA2-Matrix
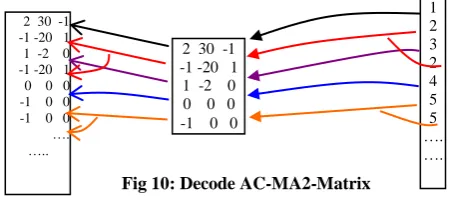
After the SS-Algorithm reconstructs Header-Information-Matrix, it will be easy to reconstructs AC-MA2-Matrix. The decode operation for AC-MA2-Matrix its look like Shannon decoding. The decoding depends on the Index-Code and Header-Information-Matrix. Figure 10 illustrates the decoding operation for AC-MA2-Matrix. The decoding takes each value from Index-Code, these values are represents locations in Header-Information-Matrix, then replace array contents for that location in reconstructed AC-MA2-Matrix. For example, in Fig.10, index-Code(4)=2, which means the 2nd row in Header-Information-Matrix[2][-1,-20,1] will be replaced at AC-MA2-Matrix[4][-1,-20,1]. Finally the AC-MA-Matrix reconstructed by partition the AC-MA2-Matrix to be p-parts, as shown before in Figure 5.
Step 3: Apply inverse quantization (dequantize) means dot multiplication between rows in AC-MA-Matrix and equation (2).
Step 4: Reconstruct Multi-Array-Matrix by combining the DC-Column with AC-MA-Matrix automatically where each row from Multi-Array-Matrix is represents n×n square at LLDCT.
Step 5: Apply Inverse DCT to each n×n block. The decoded image appeared after applied inverse DWT on the reconstructed LL sub-band.
3.
EXPERIMENTS AND RESULTS
[image:3.595.312.550.72.213.2]For testing the proposed system performance; it is applied on three types of images (see Figure 11 for an over view), all the images are gray of 256 gray levels (8bits/pixel) but with different sizes. The tests have been performed using Daubechies DWT (db3), the block sizes of LLDCT {4×4}, and the Quality parameter values = {0.02, 0.03, 0.04 and 0.05} are used to quantize each array in AC-MA-Matrix. The Fig 8: Index-Code and DC-Column constructed
by Arithmetic Decoding
Find Decoded DC-Column
Apply ABV Decode
Index-Code
Apply Arithmetic Decoding to the stream of bits : 100010001111….etc 100 101 95 96 90 100 110 …. …. 1 6 -1 6 -10 -10 …. …. 1 2 3 2 4 5 5 … . … .
Fig 9: SS-Algorithm applied on the AC-Column
Limit Values =[-1,2,0,30,-1,0]
Reconstructed Header-Information-Matrix Weights Values
AC-Column
[image:3.595.58.274.104.238.2]2 30 -1 -1 -20 1 1 -2 0 0 0 0 -1 0 0 0.9133 0.1269 0.9057 4.7279 -2.5456 0.6595 0.0 -0.9133 SS-Algorithm
Fig 10: Decode AC-MA2-Matrix
2 30 -1 -1 -20 1 1 -2 0 -1 -20 1 0 0 0 -1 0 0 -1 0 0 …. …..
2 30 -1 -1 -20 1 1 -2 0 0 0 0 -1 0 0
[image:3.595.313.540.427.530.2]compression ratio which is the ratio of the original image size to the compressed size along with the PSNR between the original image
I
and the decoded imageI
ˆ
was adopted as fidelity measure due to popularity and simplicity as in equation (5). The decompressed images with PSNR for each Quality status are shown in Figure(s) 12, 13 and 14 respectively.MSE
PSNR
2 10
255
log
10
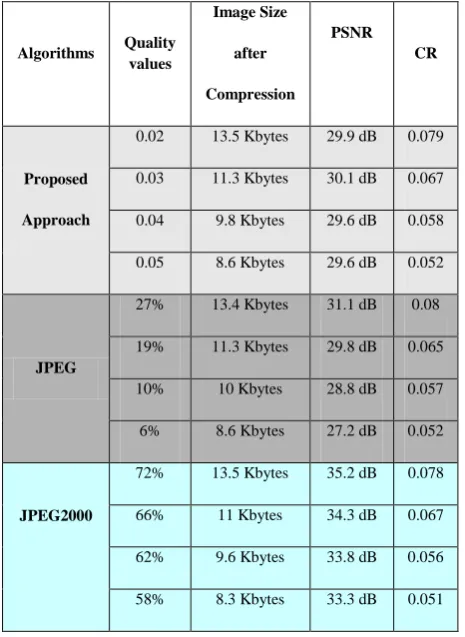
(5)The experimental results are listed in Table (s) 1, 2 and 3 compared with JPEG and JPEG2000 for the three tested images respectively, where for JPEG and JPEG2000 the Quality are different in which the value of this parameter between {1% - 100%} if the image Quality is increased forward 100%, the compression ratio is decreased and vice versa.
Table1. Comparison between methods for Lena image
Table2. Comparison between methods for Iris image
Algorithms
Quality
values
Image Size after
Compression
PSNR
CR
Proposed
Approach
0.02 19.5 Kbytes 33.1 dB 0.079
0.03 16.4 Kbytes 32.4 dB 0.067
0.04 14.3 Kbytes 32.5 dB 0.058
0.05 12.7 Kbytes 32.1 dB 0.052
JPEG
33% 19.6 Kbytes 33 dB 0.08
22% 16.1 Kbytes 32.6 dB 0.065
16% 14 Kbytes 31.5 dB 0.057
13% 12.8 Kbytes 30.7 dB 0.052
JPEG2000
79% 19.2 Kbytes 36.3 dB 0.078
76% 16.5 Kbytes 35.8 dB 0.067
72% 13.7 Kbytes 34.8 dB 0.056
70% 12.5 Kbytes 34.4 dB 0.051
Algorithms Quality value
Image Size after
Compression
PSNR CR
Proposed
Approach
0.02 14.6 Kbytes 36.1 dB 0.057
0.03 11.7 Kbytes 35.7 dB 0.045
0.04 9.8 Kbytes 34.7 dB 0.038
0.05 8.3 Kbytes 34.6 dB 0.032
JPEG
27% 14.5 Kbytes 35.6 dB 0.056
19% 11.8 Kbytes 34.1 dB 0.046
14% 10 Kbytes 32.9 dB 0.039
10% 8.5 Kbytes 31.6 dB 0.033
JPEG2000
72% 14.2 Kbytes 38.1 dB 0.055
67% 11.6 Kbytes 37.3 dB 0.045
61% 9.2 Kbytes 36.2 dB 0.035
59% 8.4 Kbytes 36 dB 0.032
c) X-ray image 500×522
[image:4.595.63.252.272.485.2]b) Iris image 512×512 a) Lena image 500×500
Table 3. Comparison between methods for X-ray image
4.
CONCLUSIONS
From the test results of the proposed system, the following remarks are stimulated:
1. Using two transformations, helps proposed approach to increases of high-frequency coefficients, and leads to increases compression ratio.
2. Minimize Matrix size algorithm, is used to reduce each three coefficients from AC-MA2-Matrix, to single integer value. This process converts a matrix into a column, and this leads to increases compression ratio, and in another hands keeps the quality of the high-frequency coefficients.
3. Daubechies DWT is used for zoom-out the images into the quarter size, and this helped proposed approach to obtain
higher compression ratio. For this reason the quality of the images are no less than 29 (dB).
4. Header-Information-Matrix are encrypted by using Random-Weights-Values, to convert these information about compressed image data into a column contains floating point values. This process increasing the security for the compressed image data. This encrypted data has small size, and higher security. Because these encrypted data are represents information about a compressed image.
5. The high-frequencies in DWT are ignored. This is because the Daubechies DWT family has the ability to zooming-in an image without need for the insignificant high-frequencies sub-bands.
6. SS-Algorithm is used to estimate Header-Information-Matrix; this is the core of the proposed decompression algorithm, which converts the encrypted data array into the Header-Information-Matrix. This algorithm is depending on the Random-Weights-Values, for reconstructs original values of the Header-Information-Matrix coefficients. 7. The proposed approach gives good visual image quality,
more than JPEG. This because our approach removing most of the squares that caused by JPEG.
Also this research has some limitations illustrated in the following steps:
1- JPEG2000 technique has some of the properties to keeps an image quality, more than the proposed approach, at the parameter Quality higher.
2- SS-Algorithm decompression technique takes more time for reconstruct Header-Information-Matrix. This is because the Limit value array has negative and positive values. The ranges between these values are big, and SS-Algorithm used to increment the pointers by 1 at each iteration, and this leads to takes more execution times to finding out the solution.
3- The Header-Information-Matrix are encrypted, if this header is damaged the decompressed image will be completely damaged.
5.
ACKNOWLEDGMENTS
Our thanks to the experts who have contributed towards development of the template.
Algorithms Quality values
Image Size
after
Compression
PSNR CR
Proposed
Approach
0.02 13.5 Kbytes 29.9 dB 0.079
0.03 11.3 Kbytes 30.1 dB 0.067
0.04 9.8 Kbytes 29.6 dB 0.058
0.05 8.6 Kbytes 29.6 dB 0.052
JPEG
27% 13.4 Kbytes 31.1 dB 0.08
19% 11.3 Kbytes 29.8 dB 0.065
10% 10 Kbytes 28.8 dB 0.057
6% 8.6 Kbytes 27.2 dB 0.052
JPEG2000
72% 13.5 Kbytes 35.2 dB 0.078
66% 11 Kbytes 34.3 dB 0.067
62% 9.6 Kbytes 33.8 dB 0.056
LLDCT
Image
LL HL
(ignored)
LH HH (ignored) (ignored)
……
Minimize Matrix size Algorithm
Entropy Encoder
Original Image
Apply DWT on the image
apply DCT on each
n x n segment
Fig 1: The Band Encoder
AC-Multi-Array Matrix
Multi-Array Matrix DC-Column AC-Multi-Array Matrix
1 2 3 4 5 ……. n x n 1 2 3 4 5 6 ……. n x n
Index code
DC-Column AC-Multi-Array Matrix Part 1 Part 2 Part 3 Part 4 …. Part p
……..
128 129 127 ….
-1 65 -49 0 1 2 …… 0 -45 90 -5 3 -1 …... 4 90 -30 2 -1 0 …… ……
…… 128 -1 65 -49 0 1 2 ….…
129 0 -45 90 -5 3 -1 …… 127 4 90 -30 2 -1 0 ... ….
….
Quantization Applied on each
array
-1 33 -25 0 0 1 0 0 1 0 0 1 0 …. 0 -23 45 -3 2 0 0 -1 0 1 0 0 -2 …. 2 45 -15 1 0 0 0 -1 0 0 0 -2 1 …. ……
…… 64 65 64 ….
-1 33 -25 0 -23 45 2 45 -15 ….. 0 0 1 -3 2 0 1 0 0 …… 0 0 1 0 -1 0 0 -1 0 ……
0 0 -1 -2 0 1 1 0 0 …..
..…. ………..
Minimize Matrix Size
Algorithm
(Header) Information about AC-MA2 - Matrix 1
2 500 100 2 32 14 35 700
… …
[image:6.595.85.509.69.681.2]LLDCT
6.
REFERENCES
[1] Sadashivappa, G. and Ananda Babu, K., 2008. Performance Analysis of Image Coding Using Wavelets. International Journal of Computer Science and Network Security, 8(10), 144-151.
[2] Westwater, R. and Furht, B. 1997. Real-Time Video Compression. Kluwar Academic Publisher, London.
[3] Ghanbari, M. 1999. Video Coding an Introduction to Standard Codecs. Institution of Electrical Engineers, London.
[4] Chen, W. H. and Pratt, W. K. 1984. Scene Adaptive Coder. IEEE. Transactions on Communications, 32(3), 225-232.
[5] Wallace, G. K. 1992. The JPEG Still Picture Compression Standard. IEEE Transactions on Image Processing, 38(1), xviii-xxxiv.
[6] Sayood, K. 2000. Introduction to Data Compression, 2nd ed., Academic Press, Morgan Kaufman Publishers.
[7] Christopoulos, C., Skodras, A. and Ebrahimi, T. 2000. The JPEG2000 Still Image XOSING System: an Overview. IEEE Transactions on Consumer Electronics, 46(4), 1103-1127.
Fig 12(a–d ): Decompressed Lena image with different quality values
(a) Quality = 0.02, PSNR=33.1 (dB) (b) Quality = 0.03, PSNR=32.49 (dB) (c) Quality = 0.04, PSNR=32.5 (dB) (d) Quality = 0.05, PSNR=32.1 (dB)
Fig 13(a–d ): Decompressed Iris image with different quality values
(a) Quality = 0.02, PSNR=36.1 (dB) (b) Quality = 0.03, PSNR=35.7 (dB) (c) Quality = 0.04, PSNR=34.7 (dB) (d) Quality = 0.05, PSNR=34.6 (dB)
Fig 14(a–d ): Decompressed X-ray image with different quality values
(a) Quality = 0.02, PSNR=29.8 (dB) (b) Quality = 0.03, PSNR=30.1 (dB) (c) Quality = 0.04, PSNR=29.6 (dB) (d) Quality = 0.05, PSNR=29.6 (dB)
Reconstruct AC-MA-Matrix, apply inverse DCT on each n x n segment then inverse
DWT on LL sub-band
Reconstruct Image
……
Sequential Search Algorithm Entropy
Decoder
Compressed Image Dequantize
[image:7.595.94.513.80.357.2][8] Tsai, M. and Hung H. 2005. DCT and DWT based Image Watermarking Using Sub sampling. in Proc. Of the 2005 IEEE Fourth Int. Conf. on Machine Learning and Cybernetics, 5308-5313,China, 2005.
[9] Grigorios D. , Zervas N., Sklavos N. and Costas E. 2008. Design Techniques and Implementation of Low Power High-Throughput Discrete Wavelet Transform Tilters for JPEG 2000 Standard. WASET , International Journal of Signal Processing 4(1), 36-43.
[10] Esakkirajan S., Veerakumar T., Senthil Murugan V. and Navaneethan P. 2008. Image Compression Using Multiwavelet and Multi-stage Vector Quantization. International Journal of Information & Communication Engineering, 4(4), 246-253.
[11]Gonzalez, R. C. and Woods, R. E. 2001. Digital Image Processing. Addison Wesley publishing company.
[12]Ali Al-Haj, 2007. Combined DWT-DCT Digital Image Watermarking, Science Publications, Journal of Computer Science 3 (9), 740-746.
[13]Antonini M., Barlaud M., Mathieu P. and Daubechies I. 1992. Image Coding using Wavelet Transform. IEEE Trans. on Image Processing, 1(2), 205–220.
[14]Christopoulos C., Askelof J. and Larsson M. 2000. Efficient Methods for Encoding Regions of Interest in the Upcoming JPEG 2000 Still Image Coding Standard,” IEEE Signal Processing Letters, 7( 9), 247-249.
[15]Rao K. and Yip P. 1990. Discrete Cosine Transform: Algorithms, Advantages, Applications. Academic Press,San Diego, CA, 1990.