http://dx.doi.org/10.4236/msa.2013.412107
Improved Cellulose by Ionic Liquid Mixture with Solid
Acid Catalysis and Its Application in Polyethylene Glycol
Liquefaction
Qiyu Chen, Qingyue Wang*, Naoki Mitsumura, Hiroki Niida
Department of Environmental Science and Technology, Graduate School of Science and Engineering, Saitama University, Saitama City, Japan.
Email: *[email protected], [email protected]
Received October 12,2013; revised November 22, 2013; accepted December 9, 2013
Copyright © 2013 QiyuChen et al. This is an open access article distributed under the Creative Commons Attribution License, which permits unrestricted use, distribution, and reproduction in any medium, provided the original work is properly cited.
ABSTRACT
Ionic liquid (IL), [BMIM]Cl-water was applied in cellulose pretreatment process and the pretreated cellulose was used in subsequent polyethylene glycol liquefaction process as a new application method. Cellulose recovery rate and mo- lecular weight value of pretreated cellulose were investigated to understand the influence of IL-water mixtures by add- ing the different amount of catalysis on cellulose crystalline structure. Gel permeation chromatograph, X-ray diffraction, Fourier transform infrared spectrometer and thermo gravimetric/differential thermal analysis were used to clarify the changes of pretreated cellulose. The results showed that the pretreated cellulose was improved in crystalline structure, molecular weight distribution and thermal stability. The liquefied residues from untreated cellulose and pretreated cel- lulose were considered as a significant index to determine the effect of IL-water mixture on cellulose. It suggested that the lower molecular weight of cellulose was obtained, the crystalline structure was disrupted and less order was formed. The liquefied residues result suggested that the lower residues at the latter stages of the reaction from the pretreated cellulose were observed.
Keywords: Ionic Liquids Mixture; Solid Acid Catalysts; Cellulose; Polyethylene Glycol; Liquefaction
1. Introduction
Liquefaction technology can convert the chemical com- ponent of biomass to polymer liquid material, which can be used in the production of adhesives, foamed material [1]. The wastes bioresource can be converted into mate- rials with high additional values. Polyurethane foams are widely used in many applications. With the increasing concern on fossil fuel depletion and environmental foot- print, a rising global interest appears in preparation of biomass-based materials such as biomass-based polyure- thane foams [2,3].
Meanwhile, the biomass-based polymers materials haven’t been widely applicable of a commercial manu- facture due to some problems. First, it is needed to drive the research to overcome the problems with drawbacks of physical and mechanical properties of resin products [4]. Moreover, it was inefficient to liquefy biomass with a longer reaction time such as bamboo which contains
higher crystalline structure in cellulose [5]. This long reaction time considerably increases the product cost of biomass-based products and consequently hinders future commercialization efforts. Kobayashi et al. reported that the part of cellulose powder was decomposed by ozone pretreatment. It was observed that the pretreated cellu- lose liquefied more efficiency than untreated cellulose did [6]. However, ozone treatment method would cause new pollution.
Recently, Ionic liquids (ILs), which were claimed as “green solvents”, were used in cellulose pretreatment processing. It has been found that the ILs need to contain anions such as chloride in order to be able to solubilise cellulose. The pretreated cellulose was more conducive to the subsequent application of enzymatic reaction and saccharification [7,8]. However, the high cost is not suitable for large-scale application. Adding water to IL systems can reduce the process cost; however, water also decreases the solubility of cellulose [9], thus, the pre-treatment effectiveness is compromised. The improved
ILs-water mixture as pretreatment solvent/liquor was discussed. Developing the effectiveness and environ- ment-friendly IL-water mixture has the potential to im- pact pretreatment of lignocellulosic biomass [10].
Solid acid resins functionalized with sulfonic group (-SO3H) are powerful catalysts for the depolymerization
of cellulose dissolved in ionic liquids. These sulfonated resins are commercially available, low-cost, and stable catalysts, which are employed in many large industrial plants. Therefore, the solid acid resins Nafion®NR50 was used in ILs-water mixture system, which was considered to improve the pH environment in mixture. The change of crystalline structure and the overall structure in cellu-lose was considered to evaluate the effect of solid acid catalyst on cellulose. Therefore, the adding different amount of solid acid catalyst as a majority variable was discussed. Then, the pretreated cellulose as improved raw material was liquefied in polyethylene glycol (PEG400) solvent in order to evaluate the cellulose decomposition performance in acid catalysis and explore a new applica- tion.
In this study, cellulose was pretreated by ionic liquids, 1-butyl-3-methylimidazolium chloride, [BMIM]Cl-water mixture with the different amount of solid acid catalysis. Then, the pretreated cellulose was liquefied in subse- quent PEG400 liquefaction process. The effect of ILs- water on cellulose was characterized by Fourier trans-form infrared spectroscopy, X-ray diffraction, gel per-meation chromatography and thermo gravimetric/dif- ferential thermal analyzer. The liquefied residue content from the liquefied cellulose and pretreated cellulose has been discussed in liquefaction process. This study was aimed to explore the characteristic of cellulose pretreated by ILs-water mixture with solid acid catalysis and observe its liquefaction behavior in polyethylene glycol solvent.
2. Experimental and Methods
2.1. Materials and Chemicals
Microcrystalline Cellulose powder was supplied by Sigma-Aldrich, Co. Ltd. The cellulose powder was dried in oven at 105˚C for 24 hours before using. 1-butyl-3- methylimidazolium chloride (C8H15ClN2, [BMIM]Cl)
was purchased from Wako (Pure Chemical Industries, Ltd, Japan). Solid acid catalysis Nafion® NR50 (NR50) was purchased from Sigma-Aldrich, Co. Ltd. Polyethyl- ene glycol (PEG 400) and Sulfuric acid (95%) (SA) was purchased from Wako (Pure Chemical Industries, Ltd, Japan). All chemicals in this study were reagent grade without further purification.
2.2. Pretreatment of Cellulose
About 0.2 g cellulose powder was added into a flask
containing amount of ionic liquids and deionized water with or without solid acid (ratio of cellulose/ILs/NR50, 1/10/0.5-4, w/w; ILs/water, 1/10, moler ratio). The pre- treatment process was heated and stirred in flask by oil bath at 100˚C for 1 h. All the samples were washed by methanol and deionized water three times after pretreat- ment process, respectively. The pretreated cellulose was filtered on a No. 40 filter paper (Whatman G.E., Co. Ltd.) and dried in oven at 105˚C for 24 h. The solubility of cellulose in ionic liquid-water mixture was calculated as :
Cellulose recovery rate wt% W Wp i100
where
Wi: the weight of dried cellulose before pretreatment;
Wp: the weight of pretreated cellulose after dried in oven.
2.3. Liquefaction of Cellulose
The liquefaction process was performed in a 20 ml round bottle. The neck flask was equipped with refluxing con- denser. The flask was immersed in an oil bath at 130˚C and magnetic stirring was used at 1500 rmp to stir. The addition ratio of raw materials, PEG400 solvent, glycerin and sulfuric acid (SA) and were set to 1/5/0.5/0.5. The liquefied residue was dried in an oven at 105˚C for 24 h and the liquefied residue ratio was calculated as follows:
Liquefied residue ratio wt% W Wr i100
where
Wi: the weight of cellulose before liquefaction;
Wr: the weight of liquefied residue after dried in oven.
2.4. Gel Permeation Chromatography (GPC) The nitrocellulose was prepared to evaluate the molecu- lar weight. Then, the nitrocellulose was dissolved in tet- rahydrofuran with the ratio of 0.1% (w/v) and filtered through a 0.45 μm membrane. The molecular weight distribution was determined by a gel permeation chro- matography system equipped with KD-806L gel columns (Shodex, Showa Denko K.K. Co. Ltd., Japan) at 40˚C. The average molecular weight (Mw) of the samples was calculated by Jasco-Borwin software and using a calibra- tion curve of monodisperse polystyrene standards. The flow rate was 1.0 ml/min.
2.5. X-Ray Diffraction (XRD)
lite height 002 (I002) and amorphous height (Iam) were
used to calculate the crystalline index (Cr.I.) and was calculated as follows:
002 am
002Cr.I. I I I 100
The apparent crystallite size L of the refection of plane was calculated from the Scherrer equation based on the width of the diffraction patterns.
Crystallite size L K cos
where,
K, the Scherrer constant of value 0.94;
λ, the X-ray wavelength (0.1542 nm);
β, the half-height width of the diffraction band;
θ, the Bragg angle corresponding to the planes.
The surface chains occupy a layer approximimately 0.57 nm thick so the proportion of crystallite interior chains and the interlayer distances d was calculated as follows:
2 2Crystallite interior chains L2h L
where,
L, the crystallite size for the refection of plane;
h, the layer thichkness of the surface chain is 0.57 nm. Interlayer distances d
2sin
where,
λ, the X-ray wavelength (0.1542 nm);
θ, the Bragg angle corresponding to the planes.
2.6. Fourier Transform Infrared Spectrometer The sample was analyzed by Fourier transform infrared (FT-IR) spectrometer (Model IR-6100, Jasco Co. Ltd., Japan). The ratio of samples and spectroscopic grade KBr was 1:100; all of the infrared spectra were recorded in absorbance units within the range of 4000 ~ 400 cm−1.
The peak shift was detected by the Spectrum Manager Ver.2 software (Jason Corporation).
2.7. Thermo Gravimetric/Differential Thermal Analysis
The untreated sample and pretreated sample were ana- lyzed by the thermo gravimetric/differential thermal analysis (TG-DTA) (Model DTG-60, Shimadzu Co. Ltd., Japan) under the following conditions: about 20 mg of samples were heated at a rate of 10˚C min−1 starting from
room temperature until 900˚C.
3. Results and Discussion
3.1. Effect of Solid Acid Catalysis on Global Cellulose in ILs-Water Mixture System The pretreatment of lignocelluloses for subsequent ap-
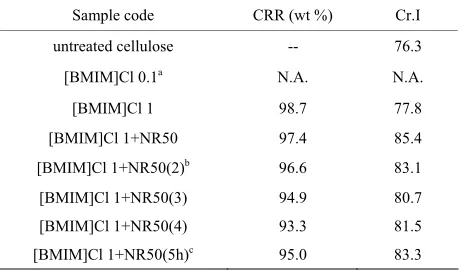
plications process can be attributed to the variation of solubility, surface structure, crystalline structure, degree of polymerization (DP) and particle size. In this study, the pretreated cellulose, as an object of study, was evalu- ated by means of cellulose recovery rate (CRR) instead of solubility. The CRR value of pretreated cellulose by [BMIM]Cl-water mixture with solid acid catalyst was 93.3 wt% when the addition ratio of NR50 to cellulose was 4, which was lowest CRR value comparing other pretreatment condition in Table 1. Rogers group have demonstrated that ionic liquid were capable to dissolve the cellulose and could enhance the dissolution efficiency with the assistance of microwave heating [11]. However, the amount of water was affect of ionic liquid solubility. The more concentrated of cellulose in ionic liquid solu- tion was obtained than that from the sample treated with water [9]. On the other hand, the high CRR value was not a reasonable evaluation method without evaluation of the impact on the global cellulose structure at pretreatment step. The apparent degree of cellulose crystalline index (apparent Cr.I) is one of the important crystalline struc- ture parameters. The rigidity of cellulose fibers increases and their flexibility decreases with increasing ratio of crystalline to amorphous regions.
3.2. Change in Cellulose Molecular Weight Distribution
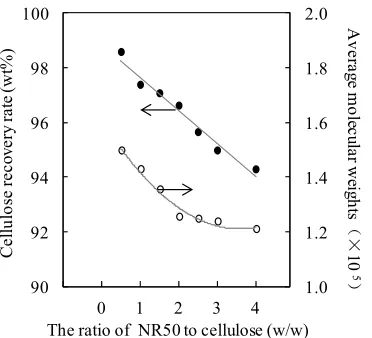
In order to determine the effect of solid acid catalysis on the cellulose crystalline structure, different amount of catalysis were used. The results for the CRR value and average molecular weight (Mw) value of pretreated sam-
ples are presented in Figure 1. The [BMIM]Cl-water mixture pretreated sample has the lower CRR value and Mw value with the increasing of amount of catalysis. This
[image:3.595.309.539.581.716.2]result suggested that addition of solid acid catalyst
Table 1. Characteristic of ionic liquid pretreated cellulose with different pretreatment condition: cellulose/ILs/NR50: 1/10/0-4 (w/w); ILs/water: 1/1-10 (molar ratio) in 1 hour at 100˚C.
Sample code CRR (wt %) Cr.I
untreated cellulose -- 76.3
[BMIM]Cl 0.1a N.A. N.A.
[BMIM]Cl 1 98.7 77.8
[BMIM]Cl 1+NR50 97.4 85.4
[BMIM]Cl 1+NR50(2)b 96.6 83.1
[BMIM]Cl 1+NR50(3) 94.9 80.7
[BMIM]Cl 1+NR50(4) 93.3 81.5
[BMIM]Cl 1+NR50(5h)c 95.0 83.3
aIL/water: 1/1 (molar ratio), bCellulose/IL/NR50, 1/10/2 (w/w), cReaction
1.0 1.2 1.4 1.6 1.8 2.0
90 92 94 96 98 100
-1 0 1 2 3 4
Ce
llu
lo
se
re
co
ve
ry
ra
te
(w
t%
)
A
ve
ra
ge
m
ole
cu
la
r w
eig
hts
(×
10
5
)
[image:4.595.82.268.93.262.2]The ratio of NR50 to cellulose (w/w)
Figure 1. Changes of cellulose recovery rate and average molecular weights relative to the amount ratio of NR50 to cellulose.
(NR50) was led the pretreated cellulose obtain the lower Mw value of pretreated cellulose. Dissolution of cellulose
requires breaking the hydrogen bonds. Therefore, the pretreatment process with solid catalysts could be the most important contributor to cleave the hydrogen bonds.
Meanwhile, nitrocellulose was considered could dis- solved in Tetrahydrofuran solvent. The nitrocellulose was prepared for evaluate the molecular weight of the pretreated cellulose. The molecular weight distribution of pretreated cellulose was shown in Figure 2. Molecular weight distribution of pretreated sample was shift to left (lower molecular weight region) with the increasing of amount of catalysis. This result suggests that the mo- lecular weight of global cellulose was lower than un- treated cellulose. The ratio of [BMIM]Cl to [H+]
(—SO3H + [BMIM]Cl → —SO3┄[BMIM]++ Cl− + H+)
affected the protons released because of the ion-exchange with [BMIM]+ [12]. [H+] possesses the ability to hydro-
lyze cellulose, and then reduce average molecular weight due to cleave the hydrogen bonds.
3.3. Change in Cellulose Crystalline Structural and Size
The XRD has been widely used to evaluate the physic- chemical properties of cellulose. The apparent Cr.I was calculated from the ratio of the 002 peak (I002) height and
the minimum (Iam) height. In Figure 3, a clear shallow
shoulder peak suggested that the arrangement of cellu- lose chains were disturbed within the hydrogen-banded sheets. Although the reaction was occurred in water con- taining mixture system, the result of Nafion®NR50 used
sample suggested that the raw sample was distorted and transformed into a less ordered intermediate structure.
The interlayer distance and crystalline size of pre- treated sample were dropped corresponding to amor-
0 0.2 0.4 0.6 0.8 1
1000 10000 100000 1000000
Untreated cellulose [BMIM]Cl 1+NR50 [BMIM]Cl 1+NR50(2) [BMIM]Cl 1+NR50(4)
D
if
fe
re
ntia
l.M
W
D
Molecular weight distribution
Figure 2. Molecular weight distribution of cellulose and pretreated cellulose (prepared by nitrocellulose) with dif- ferent amount ratio of NR50 to cellulose.
0 500 1000 1500 2000 2500 3000 3500
10 15 20 25 30 35 40
Untreated cellulose [BMIM]Cl 1 + NR50 [BMIM]Cl 1 + NR50(2) [BMIM]Cl 1 + NR50(3) [BMIM]Cl 1 + NR50(4)
C
ount
s pe
r s
ec
ond
2θ(°) 002 reflection
[image:4.595.326.517.96.269.2]101 reflection 101 reflection
Figure 3. The XRD result of effects of different amount of catalysts on cellulose crystalline structure in ILs-water mixture.
phous cellulose regions diminished, as presented in Ta- ble 2. These results suggested that pretreated sample contain a less ordered cellulose crystalline structure than untreated one [13]. The X value was used as estimates of the fraction of cellulose chains contained in the interior of crystalline. The pretreated sample showed lower value confirms that cellulose chains in a highly organized form in the interior of crystallite were decreased after pre- treatment process. This result leads to lower hydrogen bond intensity among neighboring cellulose chains.
[image:4.595.320.525.322.483.2]Table 2. Parameters obtained from the XRD analysis of pretreated samples related to amount of solid acid. Χ and L parameters were calculated from refection of 002 planes.
Sample code d002 (Å) Χ L (nm)
untreated cellulose 4.03 0.42 3.21
[BMIM]Cl 1 + NR50 4.02 0.22 2.16
[BMIM]Cl 1 + NR50 (2) 3.99 0.19 2.01
[BMIM]Cl 1 + NR50 (3) 3.99 0.17 1.93
[BMIM]Cl 1 + NR50 (4) 4.00 0.23 2.19
-5 -4 -3 -2 -1 0 1 2 3 4 5
0 1 2 3 4
C-OH out of plane (668 )
C-O-C,C-C-H at C5 and C6 (898 )
C-O at C6 (1033 )
C-O at C3 (1059 )
C-OH at C6 (1235 )
C-OH at C2 or C3 (1341 )
The ratio of NR50 to cellulose (w/w)
Δν
(c
m
-1)
cm -1
cm -1
cm -1
cm -1
cm -1
[image:5.595.327.517.409.575.2]cm -1
Figure 4. Peak shift of pretreated cellulose related the ratio to the amount ratio of NR50 to cellulose from the result of FT-IR, the wave number of band belong to untreated cellu- lose.
1341 cm−1 and 1235 cm−1 assigned as C-OH in plane at
C2 or C3 and C-OH in plane at C6 [14,15] are shifted to different wave numbers such as 1338 cm−1 and 1236
cm−1, respectively. The band at 1059 cm−1 and 1033 cm−1,
assigned as C-O at C3 and C6, respectively, [15,16], is shifted to strength wave number such as 1063 cm−1 and
1035 cm−1 at higher solid acid concentration. The band at
898 cm−1 assigned as C-O-C stretching at the β-(1→4)-
glycosidic linkage or C-O-C, C-C-H at C5 and C6 [17] has no move. Moreover, the absorbance change assigned as intra-molecular hydrogen bonds for O(3)H-O(5) and O(2)H-O(6), and the inter-molecular hydrogen bands for O(6)H-O(3') in pretreated sample is often decreased by pretreatment. The variation of bending shift was related
the concentration of solid acid in mixture system. The FT-IR absorbance change and peak shift of these bending, which arises by changing the environment at inter- and intra-molecular hydrogen bands.
The cellulose molecule is a very long polymer of glu- cose units. The thermal decomposition was tested in or- der to analyze the thermal stability of pretreated samples. The untreated cellulose, [BMIM]Cl 1 + NR50 and [BMIM]Cl 1 + NR50(4) samples was analyzed. The weight loose percentage of the pretreated cellulose with increasing temperature and the rates of degradation was shown in Figure 5.
It was observed that maximum rate of mass loss of sample [BMIM]Cl 1 + NR50 and [BMIM]Cl 1 + NR50(4) exhibited temperature at 369˚C and 365˚C, respectively, compared that of untreated cellulose sample at 345˚C, was present in Table 3. It was observed that the char left after degradation was 13.8% for untreated cellulose, 16.9% for [BMIM]Cl 1+NR50 and 19.2% for [BMIM]Cl 1 + NR50(4) at 800˚C. The [BMIM]Cl 1 + NR50 sample has more char than that in untreated cellulose. It might be attributed to the fine crystallite size sample in pretreated samples. This result suggested that smaller crystallite size in [BMIM]Cl 1 + NR50 sample than that in un- treated cellulose [18,19]. As a result, a less amount of
0 20 40 60 80 100
200 300 400 500 600
untreated cellulose [BMIM]Cl 1 + NR50 [BMIM]Cl 1 + NR50(4)
Pe
rc
en
ta
ge
o
f w
eig
ht
lo
ss
(w
t %
)
Temperature(Temperature (°˚C) C)
[image:5.595.310.538.653.725.2]Figure 5. The TG-DTA result of cellulose sample, sample [BMIM]Cl 1+NR50 and [BMIM]Cl 1+NR50 (4).
Table 3. Pyrolysis characteristic parameters of untreated cellulose, [BMIM]Cl 1 + NR50 and [BMIM]Cl 1 + NR50 (4) sample.
Δw/%a (˚C) Sample code
400 600 800
TDTGmax
(˚C)b
untreated cellulose 18.4 16.9 13.8 345
[BMIM]Cl 1 + NR50 24.2 18.5 16.9 369
[BMIM]Cl 1 + NR50(4) 26.6 20.9 19.2 365
hydrogen bond between neighboring cellulose chains resulted from a less order cellulose structure which could lead to lower thermal stability, as observed in case of IL-water mixture pretreated sample.
3.4. Behavior of Pretreated Cellulose in PEG400 Liquefaction Process
In phenol or PEG/glycerin solvent liquefaction, some studies were discussed the condensation reactions of liq- uefied components [20]. In this experiment, liquefaction reaction speed was relatively slow in Figure 6 and avoiding the condensation reactions occurred (ratio of cellulose/PEG400 less than 1:4).
In our previous study, it was found that the liquefied residue content from pretreated sample was lower than that in untreated sample by phenol solvent liquefaction. In this study, the [BMIM]Cl 1+ NR50 has lower residue content when the reaction time was reach to 30 mins, and the [BMIM]Cl 1+ NR50(4) sample has no superiority in the result of liquefied residue content. Therefore, the liquefaction process was discussed by divided into 2 parts. First, the pretreated sample was become to lump state samples after separating from IL-water mixture. The bigger size in lump state samples was hindering ef- fects in liquefaction. Thus, the [BMIM]Cl 1+ NR50(4) sample has more residue content in Figure 6 condition due to the physical influences. On the other hand, the powder has large contact area in PEG solvent; as a result, the untreated cellulose has lower residue content in the initial stage of the reaction. It is interesting that the [BMIM]Cl 1+ NR50 has lower residue content after 30 mins until the end of liquefaction process. The 30 min liquefied residue of untreated cellulose and pretreated cellulose were analyzed by XRD. The result in Figure 7
suggested that the residue from [BMIM]Cl 1+ NR50 has the lower degree of crystallinity than that in untreated cellulose. The lower degree of crystallinity was condu- cive to cellulose decomposition reaction by acid catalysis [6]. Therefore, it was confirmed that the pretreated cel- lulose also has the efficiency liquefaction performance in PEG solvent, however, the excessive use of the catalyst may not contribute to subsequent application due to a physical state change.
4. Conclusion
The degree of polymerization value and average mo- lecular weight of pretreated cellulose were decreased after pretreatment by ILs-water mixture. The pretreated cellu-lose was distorted and transformed into a less ordered intermediate structure due to the changing in inter- and intra-molecular hydrogen bands. The pretreated cellulose has the efficiency liquefaction performance in PEG sol-
0 10 20 30 40 50 60 70 80
0 20 40 60 80 100 120
untreated cellulose [BMIM]Cl 1 + NR50 [BMIM]Cl 1 + NR50(4)
Liq
ue
fie
d r
es
id
ue
ra
tio
(w
t
%
)
[image:6.595.322.520.98.260.2]Reaction time (min)
Figure 6. Effect of untreated cellulose and pretreated cellu- lose liquefied in PEG400 solvent.
0 500 1000 1500 2000 2500 3000 3500 4000
10 15 20 25 30 35 40
MCC [B]Cl+NR50 MCC (2 min) [B]Cl+NR50 (2 min)
C
oun
ts
p
er
s
ec
ond
2θ(°) untreated cellulose [BMIM]Cl 1 + NR50 untreated cellulose (30 min) [BMIM]Cl 1 + NR50 (30 min)
Amorphous 2θ
Figure 7. XRD analysis of the 30 min liquefied residue of untreated cellulose and pretreated cellulose.
vent; however, the excessive use of the catalyst may not contribute to subsequent application due to a physical state change.
5. Acknowledgements
Some works of this study were supported by the special funds for Basic Researches (B) (No. 22303022) of Grant-in-Aid Scientific Research of the Japanese Minis- try of Education, Culture, Sports, Science and Technol- ogy (MEXT), Japan.
REFERENCES
[image:6.595.327.520.302.481.2]“Network Structures and Thermal Properties of Polyure- thane Films Prepared from Liquefied Wood,” Biore- source Technology, Vol. 77, No. 1, 2001, pp. 33-40. http://dx.doi.org/10.1016/S0960-8524(00)00136-X [3] H. Wang and H. Z. Chen, “A Novel Method of Utilizing
the Biomass Resource: Rapid Liquefaction of Wheat Straw and Preparation of Biodegradable Polyurethane Foam (PUF),” Journal of the Chinese Institute of Chemi- cal Engineers, Vol. 38, No. 2, 2007, pp. 95-102. http://dx.doi.org/10.1016/j.jcice.2006.10.004
[4] M. Niu, G. Zhao and M. H. Alma, “Polycondensation Reaction and Its Mechanism during Lignocellulosic Liq- uefaction by an Acid Catalyst,” Forestry Studies in China, Vol. 13, No. 1, 2011, pp. 71-79.
http://dx.doi.org/10.1007/s11632-011-0109-7
[5] J. Yip, M. Chen, Y. S. Szeto and S. Yan, “Comparative Study of Liquefaction Process and Liquefied Products from Bamboo Using Different Organic Solvents,” Biore- source Technology, Vol. 100, No. 12, 2009, pp. 6674- 6678. http://dx.doi.org/10.1016/j.biortech.2009.07.045 [6] M. Kobayashi, T. Asano, M. Kajiyama and B. Tomita,
“Effect of Ozone Treatment of Wood on Its Liquefac- tion,” Journal of Wood Science, Vol. 51, No. 4, 2005, pp. 348-356. http://dx.doi.org/10.1007/s10086-004-0664-9 [7] S. H. Lee, T. V. Doherty, R. J. Linhardt and J. S. Dordick,
“Ionic Liquid-Mediated Selective Extraction of Lignin from Wood Leading to Enhanced Enzymatic Cellulose Hydrolysis,” Biotechnology and Bioengineering, Vol. 102, No. 5, 2009, pp. 1368-1376.
http://dx.doi.org/10.1002/bit.22179
[8] S. H. Ha, N. L. Mai, G. An and Y. M. Koo, “Micro- wave-Assisted Pretreatment of Cellulose in Ionic Liquid for Accelerated Enzymatic Hydrolysis,” Bioresource Technology, Vol. 102, No. 2, 2011, pp. 1214-1219. http://dx.doi.org/10.1016/j.biortech.2010.07.108
[9] M. Mazza, D. A. Catana, C. Vaca-Garcia and C. Cecutti, “Influence of Water on the Dissolution of Cellulose in Selected Ionic Liquids,” Cellulose, Vol. 16, No. 2, 2009, pp. 207-215.
http://dx.doi.org/10.1007/s10570-008-9257-x
[10] Z. Y. Zhang, I. M. O’Haraab and W. O. S. Doherty, “Ef-fects of pH on Pretreatment of Sugarcane Bagasse Using Aqueous Imidazolium Ionic Liquids,” Green Chemistry, Vol. 15, 2013, pp. 431-438.
http://dx.doi.org/10.1039/c2gc36084e
[11] R. P. Swatloski, S. K. Spear, J. D. Holbery and R. D. Rogers, “Dissolution of Cellulose with Ionic Liquids,” Journal of the American Chemical Society, Vol. 124, No. 18, 2002, pp. 4974-4975.
http://dx.doi.org/10.1021/ja025790m
[12] A. A. Dwiatmoko, J. W. Choi, D. J. Suh, Y. W. Suh and H. H. Kung, “Understanding the Role of Halogen-Con- taining Ionic Liquids in the Hydrolysis of Cellobiose Catalyzed by Acid Resins,” Applied Catalysis A: General, Vol. 387, No. 1-2, 2010, pp. 209-214.
http://dx.doi.org/10.1016/j.apcata.2010.08.032
[13] M. M. Zhang, S. C.Wu, W. Zhou and B. Q. Xu, “Imaging and Measuring Single-Molecule Interaction between a Carbohydrate-Binding Module and Natural Plant Cell Wall Cellulose,” Journal of Physical Chemistry B, Vol. 116, No. 33, 2012, pp. 10049-10054.
http://dx.doi.org/10.1021/jp304686q
[14] J. J. Cael, K. H. Gardner, J. L. Koenig and J. Blackwell, “Infrared and Raman Spectroscopy of Carbohydrates. Paper V. Normal Coordinate Analysis of Cellulose I,” Journal of the Chemical Society, Vol. 62, 1975, pp. 1145- 1153. http://dx.doi.org/10.1063/1.430558
[15] X. Colom and F. Carrillo, “Crystallinity Changes in Lyo- cell and Viscose-Type Fibres by Caustic Treatment,” European Polymer Journal, Vol. 38, No. 11, 2002, pp. 2225-2230.
http://dx.doi.org/10.1016/S0014-3057(02)00132-5 [16] M. Kačuráková, A. C. Smith, M. J. Gidley and R. H. Wil-
son, “Molecular Interactions in Bacterial Cellulose Com- posites Studied by 1D FT-IR and Dynamic 2D FT-IR Spectroscopy,” Carbohydrate Research, Vol. 337, No. 12, 2002, pp. 1145-1153.
http://dx.doi.org/10.1016/S0008-6215(02)00102-7 [17] D. Ruan, L. Zhang, Y. Mao, M. Zheng and X. Li, “Mi-
croporous Membranes Prepared from Cellulose in NaOH/ Thiourea Aqueous Solution,” Journal of Membrane Sci- ence, Vol. 241, No. 2, 2004, pp. 265-274.
http://dx.doi.org/10.1016/j.memsci.2004.05.019
[18] K. Das, D. Ray, N. R. Bandyopadhyay and S. Sengupta, “Study of the Properties of Microcrystalline Cellulose Particles from Different Renewable Resources by XRD, FTIR, Nanoindentation, TGA and SEM,” Journal of Polymers and the Environment, Vol. 18, No. 4, 2010, pp. 532-538. http://dx.doi.org/10.1007/s10924-010-0167-2 [19] M. Poletto, V. Pistor, M. Zeni and A. J. Zattera, “Cry-
stalline Properties and Decomposition Kinetics of Cellu- lose Fibers in Wood Pulp Obtained by Two Pulping Processes,” Polymer Degradation and Stability, Vol. 96, 2010, pp. 679-685.
http://dx.doi.org/10.1016/j.polymdegradstab.2010.12.007 [20] Y. C. Zhang, A. Ikeda, N. Hori, A. Takemura, H. Ono