Munich Personal RePEc Archive
A Meta-Analysis of the Relationship
between Debt and Growth
Moore, Winston and Thomas, Chrystol
Department of Economics, University of the West Indies, Cave Hill
Campus, Barbados
28 April 2008
Online at
https://mpra.ub.uni-muenchen.de/21474/
A Meta-Analysis of the Relationship between Debt and Growth
Winston Moore
1and Chrystol Thomas
Department of Economics, University of the West Indies, Cave Hill Campus,
Bridgetown, BB11000, Barbados
April 2008
1
Corresponding author: W. Moore, Department of Economics, University of the West Indies, Cave Hill Campus, Bridgetown, BB11000, Barbados. Tel.: +246-4174275; Fax:+246-4174260; Email:
A Meta-Analysis of the Relationship between Debt and Growth
Abstract
Can debt be used to finance growth? This question has stimulated a number of research papers,
seminars and conferences. To date, however, no clear answer to the question is available. This
paper attempts to answer the question using meta-analysis. Meta-analysis allows researchers to
combine the results from both published and un-published research to gain insights regarding the
directional and statistical significance of the relationship between the two variables. The results
from the study should be of interest to policymakers and academics.
JEL Classification: H63; O4; C1
1. Introduction
The relatively high level of indebtedness2 of many small open economies has prompted
numerous discussions regarding its impact on economic growth. Figure 1 shows that the ratio of
public and publicly guaranteed debt in the poorest countries has risen from 15 percent in the
1970s to just under 50 percent of gross national income in the 1990s. This level of debt was
almost twice that of any other single group of countries.
Conceptually, poorer countries should be expected to borrow more than relatively richer
countries due to financing constraints and the need for capacity building. However, rising levels
of debt implies more funds must be diverted from public capital formation to interest and
amortisation payments. Therefore, borrowing, either locally or abroad, can have either positive
or negative effects on economic growth. On the positive side, debt accumulation provides
financing for capacity building projects that can enhance the nation’s productive capacity. In
Modigliani’s (1961) aggregate model, debt accumulation can have a positive impact on growth if
the increase in debt is accompanied by government expenditure on productive public capital
formation (those that raise the real income of future generations). For example, the negative
effects of a recession on private capital formation can be offset by the government incurring
additional expenditure, and thus debt, to maintain the full-employment rate of capital formation.
Building on Modigliani (1961), Diamond (1965) presents a neoclassical growth model where
decisions are made at the microeconomic level and the government issues debt and levies taxes to
2
finance interest payments. In this framework, a capital scarce country benefits from capital
accumulation if the marginal product of capital exceeds the world interest rate.
However, if a country accumulates debt to a level that hampers its ability to repay past loans this
can have negative effects on the country, also known as debt overhang. The returns from
investing in the domestic economy are taxed away by foreign creditors, reducing both domestic
and foreign investment demand, and consequently economic growth (Krugman, 1988).
Clements, et al. (2004) also note that a high level of external debt can act as a disincentive to
carry out structural and fiscal reforms, due to pressures to repay foreign creditors, and thereby
reduce long run economic growth. Debt overhang can also reduce investment due to uncertainty
(Serven, 1997) and lead to capital flight (Oks and van Wijnbergen, 1995) both of which have
adverse effects on economic growth.
The empirical results in relation to debt and growth, to date, have yielded inconclusive results.
Most studies either look at domestic or external public debt. Looney and Frederiksen (1986)
report the results from a simple model of economic growth with defence expenditures and
external debt included as explanatory variables. The results presented in the paper suggest that
there is a positive and statistically significant link between external debt accumulation and
growth in GDP per capita. These results may, however, have been affected by model
misspecification as many of the other possible determinants of growth were excluded from the
regression. Abbas and Christense (2007) obtain similar results in relation to domestic public
Weeks (2000) estimate a cross-country growth regression using data on 18 Latin American
countries and data averaged over five-year intervals for the period 1970 to 1994. The study,
however, in contrast to those reported earlier finds that external indebtedness had a large and
negative impact on GDP growth, with a 1 percent rise in foreign debt service lower long term
growth by 1.6 percent. Hepp (2005), using a wider cross-section of 122 developing countries,
also obtain a negative coefficient, however, this result was not robust to changes in model
specification and country groupings. Similar negative but inconclusive results are also obtained
by Scott (1995) for Sub-Saharan Africa.
A number of recent empirical studies have also reported a non-linear relationship between debt
and growth, i.e. debt has a positive impact on growth up to a certain level, thereafter it acts as a
drag on economic growth. Elbadawi, et al. (1997) use a quadratic specification to model the debt
growth relationship, the authors find that debt has a positive impact on growth up until it reaches
97 percent of GDP. Using a panel threshold regression model, Pattillo, et al. (2002) also report
non-linear effects in the relationship between debt and growth but obtain a significantly lower
estimate of between 35 and 40 percent of GDP.
Both the empirical and theoretical literature is unable to provide policymakers with any clear-cut
advice on the link between debt and growth. Moreover, comparing the results from studies is
often difficult as the model specification often varies from one paper to the next. This paper,
through the use of meta-analysis, attempts to identify how much of the differences in results
between the papers are due to differences in model specification or country-specific experiences.
debt and provide academics with suggestions to avoid the pit-falls experienced by previous
papers.
The remainder of the paper is structured as follows. Section 2 describes how the papers were
selected to be included in the meta-analysis as well as a description of the papers. Section 3
outlines the methodological approach, while section 4 provides the estimated results. Section 5
summarises the main findings of the paper as well as provides the key policy implications of the
meta-analysis for decision-makers.
2. Description of Sample
The meta-analysis employs data on 17 studies, 12 of which are published in peer-reviewed
academic journals. The papers are obtained from searches of JSTOR, EBSCO and ProQuest for
key words ‘debt growth’.3
A search was also conducted of working paper series via working
paper databases via Google Scholar as well as the references of the papers obtain from the
sources listed above. Of the papers, 7 used observations for Highly Indebted Poor Countries
(HIPC). Some of the papers reported had different regression specifications and samples, as a
result, multiple results are included in the sample for some papers. For example, Pattillo, et al.
(2004), Hepp (2005), Patillio, et al. (2002) and Ali-Abbas and Chirstensen (2007) all had
multiple model specifications in the study. Therefore, a total of 62 observations were used in the
meta-analysis.
3
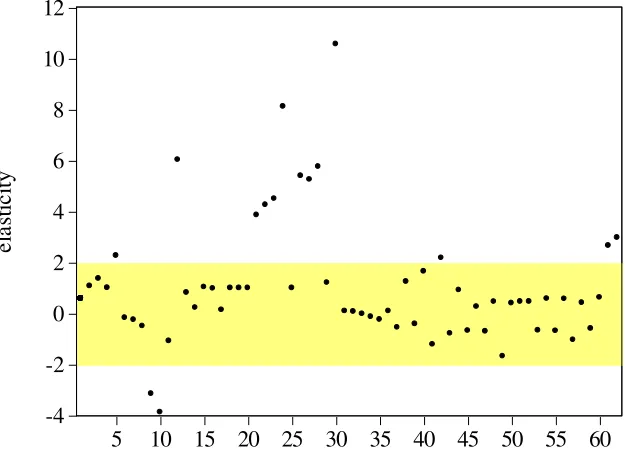
For all the papers, the elasticity of growth with respect to debt is calculated from the reported
coefficients and descriptive statistics. The authors convert the coefficient estimates to elasticities
given the differences in model specifications and to provide a basis of comparison across studies.
For some papers, the descriptive statistics were not available, making the calculation of the
elasticity estimate impossible; these studies are excluded. The elasticity estimates for the
included studies are plotted in Figure 2. The figure shows that most of the elasticity estimates are
concentrated in the -2 to +2 range. However, no clear picture emerges regarding the directional
relationship
3. Methodology
According to Stanley (2001), meta-analysis is a body of statistical methods that are used to
review and evaluate published and unpublised empirical research. It can be used to examine
results from independent studies that have a similar focus, thus allowing the researcher to gain
better insights and predictive power. Meta-regression analysis is slowly becoming more preferred
to the customary literature review as much more information can be deduced. In addition,
meta-regression analysis eliminates any such bias in choosing which studies to include in the literature
review.
In most meta-regression analysis, the dependent variable is normally characterised by a summary
statistic from each of the study (for example, the t-statistic), whereas the independent variables
include characteristics of the methodology, design and data used in the studies. The
0 1, 2, ,
j k jk j
Y Z j N (1)
where Yj is the t-statistic in model 1 and the estimated elasticity in model 2 in study j from a
total of N studies, and Zjk are meta-independent variables which represent characteristics of the
empirical studies in the sample so as to explain the variation in Yj across studies.
The t-statistic and the estimated elasticity were both used as dependent variables. Stanley and
Jarrell (1989) outlined two reasons for using the t-statistic. First, varying measurements may have
been used in each study that would affect the magnitude of the coefficient, they noted that the
t-statistic corrects for this since it is a dimensionless variable: including both positive and negative
values. Second, the t-statistic can be used as a standardised measure of the effect of
meta-independent variables on the dependent variable and therefore allows a cross-study comparison to
be undertaken.
To evaluate the robustness of the results, the elasticity of growth with respect to debt is also
employed. The estimated elasticity is also considered as it provides a standard interpretation of
the coefficient for each study despite the functional form used. Where the elasticity was not
given in the study, it was derived by multiplying the coefficient of debt (or debt ratio) by its
mean. While the elasticity is also dimensionless, it also allows the researcher to evaluate the
magnitude of the relationship between debt and growth.
Since the t-statistics and elasticities are obtained from different studies, there is the possibility
Breusch-Godfrey Lagrange Multiplier test for serial correlation and the Breusch-Pagan-Breusch-Godfrey LM test
for heteroskedasticity are considered.
The meta-variables obtained from the papers are given in Table 2. There is no accepted
economic guideline for choosing the meta-independent variables. In addition, one is faced with
the challenge of deciding which variables to include, as adding too many explanatory variables
reduces the degrees of freedom for estimation. To obtain a parsimonious model, a
general-to-specific approach was employed, where the most insignificant variable was iteratively removed
from the regression, while checking for model misspecification.
4 Empirical Results
4.1 Publication Bias
According to Begg and Berlin (1988), publication bias arises when academic journals publish
papers whose findings are ‘statistically significant’, that is, the absolute value of the t-statistic is
greater than 2. This section of the paper therefore investigates whether the papers selected in the
study are more likely to be published if they report a statistically significant relationship between
economic growth and debt.
The approach employed is similar to that utilised by Card and Krueger (1995). It is known that
time-series that have been aggregated are more likely to show dependence between the
correlation. To test for publication bias, the authors therefore examined the relationship between
the value of the t-ratio and the sample size: when the sample size increases, the t-ratio should also
rise. Therefore, early studies should have statistically insignificant results because the length of
the time series at that time was small due to unavailability of data. While recent studies should
have significant results as the sample size would have increased. Thus, in theory, there should be
a positive relationship between the absolute t-ratio and the sample size. Hence, the coefficient in
consideration should be equal to one. For publication bias, therefore, no meaningful relationship
should exist between the two variables.
Analogously to Card and Krueger (1995), the absolute t-ratio and the square root of the degree of
freedom (srdf) for each paper are employed to test for publication bias. In Figure 3, the
regression line indicates a negative correlation of -0.062 (t-ratio = -2.04). Excluding an outlier to
the extreme top, left hand corner of the graph, most of the other studies are clustered fairly close
to each other. A new regression was therefore run without this outlier. The result was identical
except that the estimate became statistically insignificant. Card and Krueger (1995) also
suggested that the log of absolute t-ratio and the log of srdf could be used to control for other
characteristics that may be correlated with the sample size. The result was, nevertheless, similar
to that found earlier. These findings suggest that there was some evidence of publication bias
amongst the papers examined.
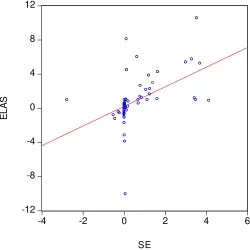
Another way to test for publication bias as indicated is via the magnitude of the coefficient in
consideration and the standard error (s.e). One drawback of this approach, however, is that
different papers may have used varying functional forms. The interpretation of the coefficient
are used to control for the variation. If publication bias exists, the relationship should be positive
or the absolute value of the t-ratio should exceed 2. The scatter diagram in figure 4 as well as the
statistically significant of the correlation between the two variables therefore agrees with the
earlier findings of publication bias. To account for this bias, the year of publication, number of
observations and whether or not the paper was published are included in the meta-regression as
control variables.
4.2 Meta-Regression
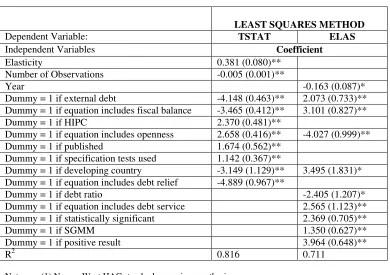
The coefficient estimates for the meta-independent variables are provided in Table 3. Looking
first at the test statistics, both regressions are able to explain more than 70 percent of the
differences in results between the various studies. The Breusch-Godfrey Lagrange Multiplier
test accepts the null hypothesis of no heteroskedasticity at the 5 percent level of testing for both
models. However, while the null of no heteroskedasticity could not be rejected for the TSTAT
regression, the test indicated the presence of heteroskedasticity in the ELAS regression. As a
result, herteroskedastic robust standard errors are obtained from the Newey-West covariance
matrix.
Given the model provides an adequate representation of the fluctuations in the t-stat and the
elasticity, the study therefore provides an analysis of the coefficient estimates from the
regression. A positive coefficient of the meta-independent variables indicates that a 1-unit
coefficient amount. Therefore, papers that include variables that have a positive coefficient
would most likely find that there is a positive correlation between debt and economic growth.
The positive coefficient on the elasticity variable may be indicative that there is stronger
relationship between debt and growth for those papers reporting a positive debt-growth elasticity
estimate. Based on these findings, it therefore appears that debt can play an important role in
spurring economic growth. Studies that consider the effects of debt on growth in HIPC, more
open countries, were published and reported specification tests also had more statistically
significant results. HIPC countries, by definition, are characterised by unsustainable debt levels.
As a result, even marginal reductions in the stock of debt provide additional funds that can be
directed towards boosting growth in the short- and long-run. The positive and statistically
significant coefficient on the openness variable implies that including openness in the regression
model increases the strength of association between debt and economic growth. Openness could
be important in influencing the debt-growth relationship as countries that are more open provide
economic agents access to low cost capital goods, best practice technology and ideas and the
opportunity to exploit comparative advantages. The final two dummy variables – whether or not
the paper is published and if specification test are used – are both positively related to the
significance of the debt variable in growth regressions. The positive coefficient on the
publication variable could be symptomatic of publication bias (this hypothesis is evaluated
further in the following section). The coefficient on the specification dummy, on the other hand,
could suggest that studies evaluating the robustness of results are more likely to find a positive
A negative coefficient of the meta-independent variables indicates that the inclusion or use of the
variables in the study reduces the strength of association between debt and growth. Studies
including debt relief in the regression model reduced the strength of association between the two
variables of interest. Relieving a country of its debt may encourage a ‘dependency syndrome’
and possible mismanagement of the funds. As a result, debt may negatively affect economic
growth. The addition of fiscal balance in the regression also results in a negative relationship
between debt and economic growth, as a higher fiscal balance leads to a faster accumulation of
debt. The negative coefficient on the external debt and developing countries dummy variables
reveal that the accumulation of debt in developing countries as well as high levels of external
debt weakens the link between debt and growth. The inverse relationship between these variables
and the t-ratio indicates that the inclusion of these variables would reduce the strength of
association between debt and growth.
The previous regression, investigates the factors that influence the strength of association
between debt and growth. However, it is also of interest to evaluate the factors that influence the
elasticity of growth with respect to debt. The positive coefficient on the external debt variable
implies that a moderate accumulation of external debt can improve the returns from debt
accumulation, as it reduces any constraints that may exists in resource scarce countries. In
addition, when governments seek finance outside the country, it reduces the likelihood of
crowding-out domestic investment. Including the fiscal balance as well as a developing country
dummy and utilising robust estimation techniques, such as system GMM, positively affected the
growth-debt elasticity. The inclusion of debt service in the regression model also had a positive
impact on the elasticity of growth with respect to debt. This could suggest that provided the
economic growth. Only three variables were negatively related to the elasticity of debt: the
dummy for including openness in the regression model, the number of observations and the
dummy for using the debt ratio. While the last two variables relate to model specification, the
coefficient on the openness variable could reflect the disciplinary effect of liberalisation.
Countries that are more open are penalised for high debt stocks through capital outflows that
might significantly reduce the returns of debt accumulation.
5. Conclusions
The relationship between debt and growth is a contentious issue: over the years published
research has often provided contradictory results. This paper examines how model selection,
design and data affect the reported results on the relationship between economic growth and debt.
The study uses 62 observations from 17 independent studies. The estimated results from 11 of
the 17 studies suggest that there exists a positive relationship between debt and economic growth,
especially in relation to external debt. This result also held for both non-linear and linear
specifications of the growth equation. However, the finding was not very robust, as more than
half of the studies with positive debt-growth relationships reported insignificant t-statistics.
The paper therefore employed meta-analysis to provide a statistical analysis of the factors that
or not the study was published and whether or not specification tests are employed had a
statistically significant impact on the statistically significance of the debt variable in the growth
regression. In contrast, the inclusion of external debt, the fiscal balance, debt relief and the use of
a database of developing countries weakened the statistical association between debt and growth.
The study provides a basis for future researchers analysing the relationship of debt on economic
growth. Researchers need to be conscious of the effect that model specification can have on the
results of their studies. In terms of policy implications, the findings suggest that on average debt
contributes positively to the economic growth of a nation. Capital growth can be achieved from
the additional finance available to the country, thus stimulating economic activity through
investment. A country can therefore be better off by seeking assistance to invest in sectors of the
economy that would generate revenue. Governments, however, need to be careful not to
accumulate too high levels of debt as interest and amortization payments can be a burden on the
References
Ali Abbas, S.M. and Christensen, J.E. 2007. The role of domestic debt markets in economic
growth: an empirical investigation for low-income countries and emerging markets.
International Monetary Fund Working Paper No. 07/127, Washington.
Clements, B., Bhattacharya, R. and Nguyen, T.Q. 2004. External debt, public investment, and
growth in low-income countries. In Gupta, S., Clements, B. and Inchauste, G., eds.,
Helping countries develop: the role of fiscal policy. International Monetary Fund:
External Relations Department, 105-129.
Diamond, P.A. 1965. National debt in a neoclassical growth model. American Economic Review,
55(5): 1126-1150.
Koray, F. 1987. Government debt, economic activity, and transmission of economic disturbances.
Journal of Money, Credit and Banking, 19(3): 361-375.
Krugman, P. 1988. Financing vs. forgiving a debt overhang: some analytical issues. Journal of
Development Economics, 29(3):253-268.
Looney, R.E. and Frederisksen, P.C. 1986. Defence expenditures, external public debt and
growth in developing countries, Journal of Peace Research, 23(4): 329-338.
Modigliani, F. 1961. Long-run implications of alternative fiscal policies and the burden of the
national debt. Economic Journal, 71(4): 730-755.
Oks, D. and van Wijnbergen, S. 1995. Mexico after the debt crisis: Is growth sustainable?
Journal of Development Economics, 47(1): 155-178.
Scott, G. 1995. Foreign debt service and economic growth. Atlantic Economic Journal, 23(2):
Serven, L. 1997. Uncertainty, instability, and irreversible investment: theory, evidence and
lessons for Africa. World Bank Policy Research Paper No. 1722, Washington.
Weeks, J. 2000. Latin America and the high performing Asian economies: growth and debt.
Table 1: Papers on Debt and Growth included in the Study
Authors of Study Result Year t-stat Non-Linear
Specification
Panel obs HIPIC External Debt Published
Table 2: Meta-independent Variables
η = the elasticity of the estimate. t = the t-statistic
Year = Year in which the paper was released. R2 = R-squared given for each test used.
Obs = the number of observations considered for each test. D* = 1 if the study used the debt ratio.
OLS = 1 if the study used the Ordinary Least Square method. IV = 1 if the study used Instrumental Variables for estimation. FE = 1 if the study used Fixed Effects for estimation.
RE = 1 if the study used Random Effects for estimation.
DGMM = 1 if the study used Differenced General Method of Moments. SGMM = 1 if the study used Systems General Methods of Moments. GLS = 1 if the study used General Least Square method of estimation. P = 1 if the study used panel data.
Sig = 1 if the t statistic is significant.
Dev = 1 if the study considered developing countries. Spec = 1 if the study used specification test.
HIPC = 1 if study included Highly Indebted Poor Countries. ExtD = 1 if the study considered external debt.
Pub = 1 if the study was published.
Pos = 1 if the relationship between economic growth and debt was positive. O = 1 if the equation includes openness.
Table 3: Results of Meta-regression
LEAST SQUARES METHOD
Dependent Variable: TSTAT ELAS
Independent Variables Coefficient
Elasticity 0.381 (0.080)** Number of Observations -0.005 (0.001)**
Year -0.163 (0.087)*
Dummy = 1 if external debt -4.148 (0.463)** 2.073 (0.733)** Dummy = 1 if equation includes fiscal balance -3.465 (0.412)** 3.101 (0.827)** Dummy = 1 if HIPC 2.370 (0.481)**
Dummy = 1 if equation includes openness 2.658 (0.416)** -4.027 (0.999)** Dummy = 1 if published 1.674 (0.562)**
Dummy = 1 if specification tests used 1.142 (0.367)**
Dummy = 1 if developing country -3.149 (1.129)** 3.495 (1.831)* Dummy = 1 if equation includes debt relief -4.889 (0.967)**
Dummy = 1 if debt ratio -2.405 (1.207)* Dummy = 1 if equation includes debt service 2.565 (1.123)** Dummy = 1 if statistically significant 2.369 (0.705)** Dummy = 1 if SGMM 1.350 (0.627)** Dummy = 1 if positive result 3.964 (0.648)**
R2 0.816 0.711
Notes: (1) Newey-West HAC standard errors in parenthesis.
(2) ** and * denote estimate significant at the 5% and 10% level of significance respectively.
0.0 10.0 20.0 30.0 40.0 50.0 60.0
Low & middle income
Low income Lower middle income
Middle income Upper middle income %
Figure 2: Debt-Growth Elasticity for the Sample of Studies
-4 -2 0 2 4 6 8 10 12
5 10 15 20 25 30 35 40 45 50 55 60
e
la
st
ic
it
Figure 4: Relation of estimated elasticity and standard error
-12 -8 -4 0 4 8 12
-4 -2 0 2 4 6
SE
E
L
A