International Research Journal of Marketing and Economics
Vol. 3, Issue 12, December 2016 Impact Factor- 5.671 ISSN: (2349-0314)
© Associated Asia Research Foundation (AARF)
Website: www.aarf.asia Email : [email protected], [email protected]
EFFECT OF SPATIAL PATTERN AND NITROGEN SCHEDULING ON
ECONOMIC INDICES AND PARTIAL BUDGETING IN MAIZE
(
ZEA MAYS
L)
Selvakumar Dharmalingam1, Velayudham Kumaran2 And Thavaprakaash Nallasamy3 1,2
Department of Agronomy, Tamil Nadu Agricultural University,
Coimbatore (641 003), India.
3
Krishi Vigyan Kendra, Tamil Nadu Agricultural University, Thirupathisaram, India.
ABSTRACT
Field experiments were conducted at Agricultural College and Research Institute,
Coimbatore to study the economic viability of various altered spatial pattern and nitrogen
scheduling approaches adopted in maize. The experiments were laid out in split plot design
and replicated thrice. Spatial pattern allotted to main plots with six levels viz., M1- 60 x 25,
30 x 30, 35 x 35, 40 x 40, 45 x 45 and 50 x 50 cm. Three nitrogen scheduling approaches N1-
Recommended dose of nitrogen (RDN) @ 150 kg ha-1 in 3 splits, N2- RDN @ 150 kg ha-1 in 4
splits and N3- Leaf Colour Chart (LCC) based N scheduling were assigned to sub plots.
Profitability analysis indicated that square planting of 35 x 35 cm with LCC based N
scheduling (M3N3) fetched higher gross return (` 110462 and 159074 ha-1) net income (`
70290 and 114180 ha-1) and BCR (2.75 and 3.54) and reduced total variable cost compared to
conventional approach. Partial budgeting analysis revealed that among proposed changes M3N3
treatment combination increased added returns, reduced cost and gave maximum net gain of
22.1 and 18.6% more than recommended practice during the course of study. Based on the
results 35 x 35 cm and LCC based N management could sustain the productivity and profitability
in maize.
1. INTRODUCTION
Maize (Zea mays L.) is the third most important cereal, next to rice and wheat in the
world as well as in India. It is one of the most versatile crops and can be grown under diverse
environmental conditions and also diversified uses as human food (17%), animal feed (61%)
and source of large number of industrial products (22%) viz., starch, ethanol, oil, alcoholic
beverages, food sweeteners, pharma and cosmetics, etc. [1]. Maize grains have greater nutritional
value as it contains 72 % starch, 10% protein, 4.8% oil, 8.5% fibre, 3.0% sugar and 1.7% ash [2]
With increased demand for maize as food, feed and industrial products, it could become an
important cereal in terms of area and production in the next few decades. It is predicted that
by 2025, the total global maize demand will exceed the demand for rice and wheat and in
India the demand will touch 42 million tones. It is the crop of future as mentioned by the
father of the green revolution, renowned nobel laureate Dr. Norman E. Borlaug.
Spatial pattern is important agronomic attribute, wider and closer pattern affected the
yield performance and reduced economic returns. Optimum planting pattern is essential for
higher productivity and profitability. The yield increase due to N fertilization was substantial
(92%) in maize compared to rice (47%) and wheat (50%) [3]. Application of higher level of
N fertilizer is very common among Indian farmers, who attribute maize crop greenness and
growth response to N application. Hence, farmers tend to apply more nitrogenous fertilizers
and which in turn increase the cost incurred for fertilizers. The LCC based real time N
management beneficial in terms of productivity and profitability [4]. The economic impact of
proposed changes can be evaluated using partial budgeting tool. Hence the economic analysis
of various planting pattern and N scheduling approaches were calculated. The analysis was
made to assess the net profitability of proposed changes in maize.
2. MATERIALS AND METHODS
Field experiments were conducted at the Department of Agronomy, Agricultural
College and Research Institute, Coimbatore. The region is characterized as semi-arid tropical
(SAT) climate, located at 110 8’ N latitude and 770 8’ E longitude. The mean annual rainfall
(52 years) at Coimbatore is 713 mm distributed over about 47 rainy days with a 30 % annual
coefficient of variation. The experiment was laid out in a split plot design and the treatments
were replicated thrice. Single cross maize hybrid NK 6240 was used as test crop. The details
2.1.Treatments
Main plot: Spatial pattern
M1 : 60 × 25 cm
M2 : 30 × 30 cm
M3 : 35 × 35 cm
M4 : 40 × 40 cm
M5 : 45 × 45 cm
M6 : 50 × 50 cm
Sub plot: Nitrogen scheduling
N1 : Recommended dose of nitrogen (RDN) @ 150 kg ha-1 in 3 splits as 25, 50
and 25% at basal, 25 and 45 DAS, respectively (control)
N2 : RDN @ 150 kg ha-1 in 4 splits each 25% at basal, 15, 30 and 45 DAS
N3 : Leaf colour chart (LCC) based nitrogen scheduling (whenever LCC critical
value falls below 5, top dressing of N @ 30 kg ha-1)
2.2. Economic Indicators
2.2.1. Total variable cost (TVC)
The cost incurred from field preparation to harvest including the cost of other inputs
was worked out for each treatment of the study and expressed as ` ha-1.
2.2.2. Gross returns
The grain and stover yield was computed per hectare and the total income (` ha-1) worked
out based on the market rate prevalent during the period of study.
2.2.3. Net returns
Net return was obtained by subtracting TVC from gross return as detailed below and
expressed as ` ha-1.
Net returns (` ha-1) = Gross returns (` ha-1) – Total variable cost (` ha-1)
2.2.4. Benefit-cost ratio (BCR)
BCR was calculated based on gross return and variable cost of cultivation as given
below.
Gross returns (` ha-1)
BCR =
Total variable costs (` ha-1)
2.3. Partial Budgeting
This refers to estimating the outcome or returns for a part of the business, i.e., on or
few activities. A partial budget is used to calculate the expected change in profit for a
proposed change in the farm activities. A partial budget contains only those income and
expense items which will change if the proposed modification in the treatment is
implemented. Only the changes in income and expenses are included and not the total values.
The final result is an estimate of the increase or decrease in profit.
3. RESULTS AND DISCUSSION
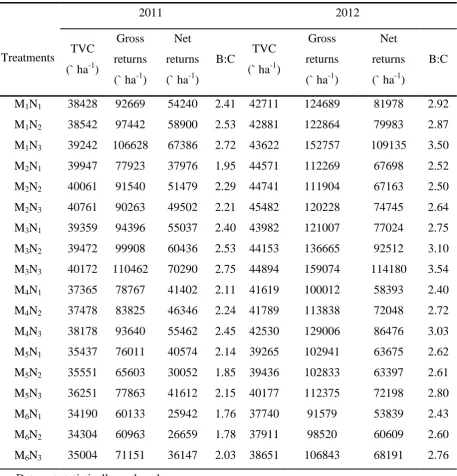
3.1. Economic Indices
The economic analysis of different treatments revealed large variations in cost of
cultivation, gross return and net return in maize (Table 1). The cost of cultivation was the
highest (` 40761 and 45482 ha-1) during 2011 and 2012, respectively under treatment
combination of M2N3 (30 × 30 cm with LCC based N application). When the spacing was
narrowed down, the cost of cultivation increased proportionately. In any investment
economics, net returns as well as BC ratio are more important to compare the profitability of
the system as well as to identify input technologies to improve the same. Perusal of data
showed that highest gross income (` 110462 and 159074 ha-1), Net income (` 70290 and
114180 ha-1) and BCR (2.75 and 3.54) during 2011 and 2012, respectively were recorded
with optimum spacing of 35 × 35 cm with maize nourished through LCC based N (M3N3).
Higher yield levels under M3N3 positively influenced the gross return. Due to higher gross
returns of the above treatment and little variation of TVC has substantially increased the net
income. Similarly, BC ratio was also higher with M3N3 due to higher gross returns with
reduced or same cost invested. Planting density of 83,333 plants ha-1 with LCC based N
application recorded higher economic indices over recommended practices in maize [4].
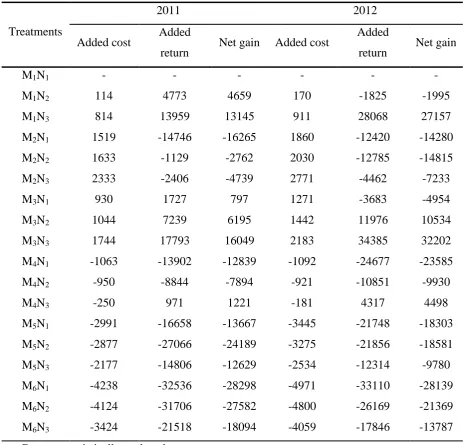
3.2. Partial Budgeting
The computed mean data on partial budgeting (` ha-1) due to various treatment
observed higher added cost (` 2333 and 2771 ha-1 during 2011 and 2012, respectively).
Whereas, wider spacing of 50 × 50 cm and RDN @ 150 kg ha-1 in 3 splits (M6N1) observed
the total reduced cost (`4238 and 4971 ha-1 during 2011 and 2012, respectively).
The added return was more (`17793 and 34385 ha-1) during 2011 and 2012
respectively under M3N3 (35 × 35 cm and LCC based N scheduling). However, M6N1 showed
reduced return (` 32536 and 33110 ha-1). The more net gain (16049 and 32202 during 2011
and 2012, respectively) was observed under the treatment combination of M3N3 and it was
followed by M1N3 (60 × 25 cm with LCC based N management) than other combinations. All
of the wider spacing combinations showed negative values. The percentage increase over
M1N3 (60 × 25 cm with LCC based N scheduling) was 22.1 and 18.6 during 2011 and 2012,
respectively. This might be due to higher yield and economic return with more or less same cost
of cultivation which lead to more net gain. The profit increase over change in current practice (55,
555 plants ha-1) into optimum (88,888 plants ha-1) recorded higher net gain than 1, 11,111 plants
ha-1 were documented by [5] and [6] in maize. Economic benefits of LCC based N management
[7] and [8] was also reported earlier.
4. CONCLUSIONS
The results showed that square planting with LCC based N management fetched
higher gross return, net return and BCR with reduced TVC. Partial budgeting analysis
indicated that altering spatial from rectangular to square pattern increased added cost
marginally and LCC based N scheduling resulted N saving which reflected in reduced cost.
Added return and reduced cost under this practice gave higher net gain in maize.
REFERENCES
1. Anonymous, Maize Statistics, In: Nuziveedu seeds Bulletin, 2013.
2. A.R.Chaudhry, Maize in Pakistan. Punjab Agri. Co-ordination Board, Univ. Agri.,
Faisalabad, 1983.
3. R.Prasad, Nitrogen and food grain production in India, Indian Journal of Fertilizers, 7(12),
66-76.
4.D.P.Biradar, Y.R. Aladakatti, D.Shivamurthy, T.Satyanarayana, and K.Majumdar,
Managing fertilizer nitrogen to optimize yield and economics of maize-wheat
5. M.A.P.W.K. Malaviarachchi, K.M. Karunarathne, and S.N. Jayawardane, Influence of plant
density on yield of hybrid maize (Zea mays L.) under supplementary irrigation,
Journal of Agricultural Science, 3(2), 2007, 59-66.
6. S.S.J.Buah, L.N.Abatania, and G.K.S. Aflakpui, Quality protein maize response to
nitrogen rate and plant density in the Guinea Savanna zone of Ghana, West African
Journal of Applied Ecology, 16, 2009, 9-21.
7. T.Jayanthi, S.K. Gali, V.P. Chimmad, and V.V.Angadi, Yield and economics of leaf colour
chart based nitrogen management in rainfed rice, Karnataka Journal of Agricultural
Sciences, 20(2), 2007, 391-393.
8. S.A.Gaddanakeri, D.P.Biradar, N.S.Kambar, and V.B.Nyamgouda, Productivity and
economics of sugarcane as influenced by leaf colour chart based nitrogen
Table 1. Economics of maize influenced by Spatial pattern and Nitrogen Scheduling
approaches
Treatments
2011 2012
TVC
(` ha-1)
Gross
returns
(` ha-1)
Net
returns
(` ha-1)
B:C TVC
(` ha-1)
Gross
returns
(` ha-1)
Net
returns
(` ha-1)
B:C
M1N1 38428 92669 54240 2.41 42711 124689 81978 2.92
M1N2 38542 97442 58900 2.53 42881 122864 79983 2.87
M1N3 39242 106628 67386 2.72 43622 152757 109135 3.50
M2N1 39947 77923 37976 1.95 44571 112269 67698 2.52
M2N2 40061 91540 51479 2.29 44741 111904 67163 2.50
M2N3 40761 90263 49502 2.21 45482 120228 74745 2.64
M3N1 39359 94396 55037 2.40 43982 121007 77024 2.75
M3N2 39472 99908 60436 2.53 44153 136665 92512 3.10
M3N3 40172 110462 70290 2.75 44894 159074 114180 3.54
M4N1 37365 78767 41402 2.11 41619 100012 58393 2.40
M4N2 37478 83825 46346 2.24 41789 113838 72048 2.72
M4N3 38178 93640 55462 2.45 42530 129006 86476 3.03
M5N1 35437 76011 40574 2.14 39265 102941 63675 2.62
M5N2 35551 65603 30052 1.85 39436 102833 63397 2.61
M5N3 36251 77863 41612 2.15 40177 112375 72198 2.80
M6N1 34190 60133 25942 1.76 37740 91579 53839 2.43
M6N2 34304 60963 26659 1.78 37911 98520 60609 2.60
M6N3 35004 71151 36147 2.03 38651 106843 68191 2.76
Data not statistically analyzed
Table 2: Effect of Spatial Pattern and Nitrogen Scheduling on Partial Budgeting (` ha-1)
Treatments
2011 2012
Added cost Added
return Net gain Added cost
Added
return Net gain
M1N1 - - - -
M1N2 114 4773 4659 170 -1825 -1995
M1N3 814 13959 13145 911 28068 27157
M2N1 1519 -14746 -16265 1860 -12420 -14280
M2N2 1633 -1129 -2762 2030 -12785 -14815
M2N3 2333 -2406 -4739 2771 -4462 -7233
M3N1 930 1727 797 1271 -3683 -4954
M3N2 1044 7239 6195 1442 11976 10534
M3N3 1744 17793 16049 2183 34385 32202
M4N1 -1063 -13902 -12839 -1092 -24677 -23585
M4N2 -950 -8844 -7894 -921 -10851 -9930
M4N3 -250 971 1221 -181 4317 4498
M5N1 -2991 -16658 -13667 -3445 -21748 -18303
M5N2 -2877 -27066 -24189 -3275 -21856 -18581
M5N3 -2177 -14806 -12629 -2534 -12314 -9780
M6N1 -4238 -32536 -28298 -4971 -33110 -28139
M6N2 -4124 -31706 -27582 -4800 -26169 -21369
M6N3 -3424 -21518 -18094 -4059 -17846 -13787
![Poly[[di μ3 nicotinato hemi μ4 oxalato hemi μ2 oxalato neodymium(III)silver(I)] dihydrate]](data:image/gif;base64,R0lGODlhAQABAIAAAP///wAAACH5BAEAAAAALAAAAAABAAEAAAICRAEAOw==)