Image Compression using a New Adaptive
Standard Deviation Thresholding Estimation at
the Wavelet Details Subbands
N.S.A.M Taujuddin
Faculty of Electrical and ElectronicEngineering, Universiti Tun Hussein Onn
Malaysia,
86400 Parit Raja, Batu Pahat, Johor, Malaysia.
Rosziati Ibrahim
Faculty of Computer Science andInformation Technology, Universiti Tun Hussein Onn
Malaysia,
86400 Parit Raja, Batu Pahat, Johor, Malaysia.
Suhaila Sari
Faculty of Electrical and Electronic Engineering,
Universiti Tun Hussein Onn Malaysia,
86400 Parit Raja, Batu Pahat, Johor, Malaysia.
Abstract—The process before quantization stage in compression process is a very crucial stage espeacially in application that require a high compression ratios. So, in this paper, we propose a new method of image compression that is based on reducing the wavelet coefficients in wavelet details subbands. It is based on the concept of local subband wavelet coefficients minimization to find the optimum threshold value for wavelet coefficients in each detail subbands. The proposed method decomposed the image into LL (low resolution approximate image), HL (intensity variation along column, horizontal edge), LH (intensity variation along row, vertical edge) and HH (intensity variation along diagonal). The coefficients in details subband retrived from the decomposition process is then manipulated in such a way that the nearly zero coefficient is discarded while the rest is remained. This process will reduce the unsignificant wavelet coefficient that leads to a great compression ratio while preserving the informative data to produce a good image quality as can be seen in the experiment done.
Keywords— Wavelet Coefficients, Details subbands, Thresholding, Discrete Wavelet Transform (DWT)
I. INTRODUCTION
In recent years, digital image has rising popularity and has been becoming increasingly important. With a huge number of image application available online and mobile, it require a huge storage space that also burden the network capability [1]. Compressing an image is one of the promising solution that can reduce the amount of redundant data[2]. Besides, it will decrease the storage space, transmission time, bandwidth utilization and enable rapid browsing and retrieval of images from database [3], [4].
II. WAVELET IN IMAGE COMPRESSION
Wavelet is one of the promising tools in image compression. There are three main properties of wavelets;
(a) separability,scability and translability (b) multiresolution compatibility (c) orthogonallity
With these properties, wavelet works well in image processing in such a way like the human vision do. It provides a much more precise analysis in digital image, movies and signal. It also has widely been used in data compression, fingerprint encoding and also image processing.
Wavelet is a ‘small’ wave that zeroing the value outside the fixed interval time or space. It can be shifted or scaled to decompose a signal into different scales of resolution.
Wavelet has special features in which it has flexible window size to determine accurately either time or frequency. It uses narrower window at high frequency for a better resolution while using wider window at low frequency for better frequency resolution. The behavior of wavelet has some similarity with the human DNA behavior: duplicating the essential unit, shift into different permutations providing a varied range different properties.
Typically, wavelet uses two filters, namely analysis filter and synthesis filter. The analysis filter is used to split the original signal to several spectral components called subband. The signal is first will passed a low pass filter for approximation coefficients outputs that resulting a smooth effect. Then, it will passed through the high pass filter for the detail coefficients that enhance the details.
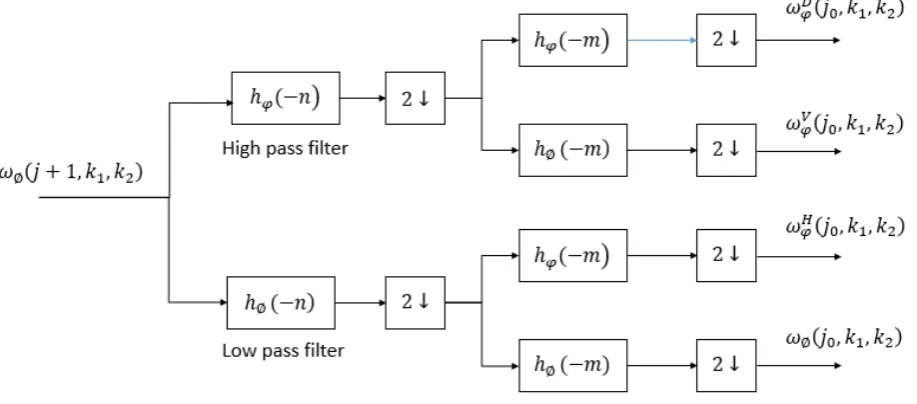
In the analysis filter, some points need to be eliminated. This operation is called downsamping, usually illustrated as
↓2. The process is done to maximize the amount of necessitate details and ignoring ‘not-so-wanted’ details. Here, some coefficient value for pixel in image are discarded or set to zero. This is called as the thresholding process and it will give some smoothing effect to the image.
Fig. 1. Discrete Wavelet Transform downsampling process
Lets’ an image with the size of N1 x N2 be expressed in image function as S(n1,n2). By applying the DWT scaling function filter to the image function, it will generate the wavelet coefficients of an approximate subband.
(1)
Where;
j0 is the wavelet scale;
k1 and k2 are the index written from n1 and n2 respectively; is the scaling function filter.
While, by applying the wavelet filter to the signal function, the wavelet coefficients of 3 details subband will be generated.
(2)
(3)
(4)
Where;
carries the diagonal wavelet coefficients details;
carries the vertical wavelet coefficients details;
carries the horizontal wavelet coefficients details;
is the wavelet filter.
Wavelet coefficients have good time resolution at higher frequency to capture the image and good frequency resolution at lower frequency to capture image background. Human eyes are less sensitive to high frequency but very sensitive to low frequency [5].
The approximate coefficients are commonly called as LL (low resolution approximate image) while the details coefficients are called as HL (intensity variation along column, horizontal edge), LH (intensity variation along row, vertical edge) and HH (intensity variation along diagonal).
In inverse of analysis bank, the synthesis bank will do the upsampling (represented as ↑2) to reconstruct the original fine scale coefficients by combining the scale and wavelet coefficients at lower coarser scale. During upsampling, the value of zero will be inserted between 2 coefficients because during the downsampling, every second coefficient is thrown away.
III. PROPOSED METHODOLOGY
Wavelet algorithm enables the computer to decompose an image into various levels with different value resolution. The apparent advantage is it capable to isolate and manipulate data with specific properties.
For example, more vertical details are keep instead of keeping all the horizontal, diagonal detail when the image has more vertical aspect. This will allow some unwanted value of horizontal and diagonal detail without degrading the quality of image in human perception.
performance to effective wavelet coefficients removal is based on the selection of its threshold(s) [6].
In this paper, we are proposing a method that can eliminate the unwanted or unsignificant wavelet coefficients value effectively by proposing a prediction scheme on threshold level based on the characteristic of each details subband of an image.
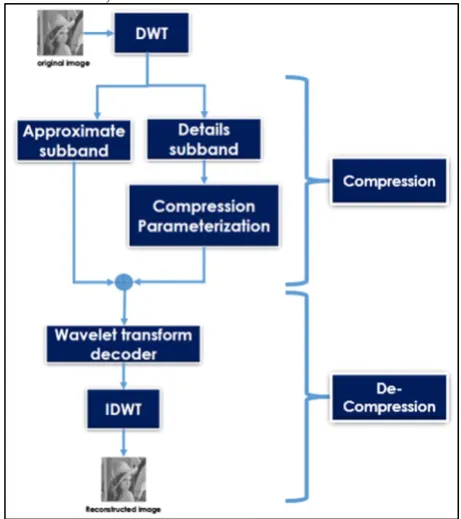
[image:3.595.49.280.183.443.2]As can be seen in Fig.2, first, the original image is transformed using the DWT. During the DWT, the original image is decomposed into 4 set of wavelet coefficients that represent the approximation subband, diagonal subband, vertical subband, and horizontal subband.
Fig. 2. The proposed compression framework
The approximate subband wavelet coefficients show the common trend of pixel values, while the three detail subbands wavelet coefficients show the horizontal, vertical and diagonal details or changes in the image.
In this project, we are proposing a method where the value in approximate subband is retained unchanged, while the unwanted or unsignificant wavelet coefficients value in detail subbands will be eliminated by using our new proposed thresholding technique. We call this process as compression parameterization.
Defining the threshold value is a very crucial task because if the value is set too high, it will eliminate the significant wavelet coefficients. On the other hand, if the threshold value is set too low, it will not reduce the image size which is the main objective in image compression task. Previously, the researchers suggest to use a fixed threshold value [7], while other suggesting the usage of a fixed percentage of wavelet coefficient to zeroed [8]. These techniques however limit the performance of compression because it create frontier where the coefficients cannot be reduced higher than the permanent limit. Arya in her paper [9] proposing a technique which predicting the wavelet coefficient based on the past neigbouring sample. Yet, this
technique just works well for images which made of smooth region separately by smooth boundary.
So, in this project we are proposing a new threshold estimation based on the standard deviation concept. For each detail subband, the individual threshold value λ, is calculated and then it is applied to details coefficients value respectively. The retained coefficients carries only significant value that sufficient enough to reconstruct a good quality image.
The standard deviation can be defined as:
(5)
where,
(6)
In this case, n is defined as the amount of wavelet coefficients in subband, while is the respective wavelet coefficient value.
In order to calculate the new diagonal details threshold value, , the horizontal detail coefficients is adapted to standard deviation concept:
(7)
where,
(8)
Here, the thresholding process is applied, where each coefficient value that is lower than the will be discarded while the rest are remained. So, the new remaining horizontal detail coefficients can be expressed as:
(9)
Equations derived in (7) till (9) can effectively discard the near zero wavelet coefficients, while keeping the significant coefficients unchanged by considering the characteristic of each wavelet coefficient value in respective subband. Each details subband actually carrying its own characteristic, so specific λ need to be derived for each specific detail subbands.
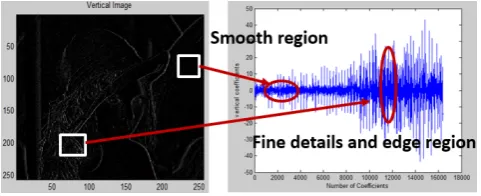
This technique implements a process where the unsignificant coefficient value is discarded to reduce the coefficient number. Reducing the near zero coefficient value will not harming the image quality because it represents the smooth region area where modification at this area are actually not easily been detected by Human Visual System (HSV). From the preliminary test, we found that the near zero coefficients are representing the smooth region. While the high value coefficients are representing the fine details and edges region (refer to Fig. 3).
Fig. 3. Smooth and fine details and edges region representation in edgemap and wavelet coefficients.
This technique is also inspired from the fact that the total energy after applying wavelet transform is not changed [10]. This characteristic allows the near-zero coefficients to be considered as zero and keep only the significant one.
The reason why the approximate subband is keep unchanged is because the modification in approximate subband will destroy a large amount of significant coefficients that may lead to lossy compression [11]. The details subband that consist of a large amount of near zero-coefficients can be ignored because it will not harming the image quality.
IV. RESULT AND ANALYSIS
This section will reveals the result up until the compression stage only. The analysis is perform to evaluate the transformation process of an image using our proposed compression method up to the construction on edgemap of an image.
This experiment was carried out on Matlab R2012a platform by using various standard test images. But as example, we just reveal two of them, namely Lena and Mandrill that representing large smooth region image and large hard region image respectively [12]. The size of size image is 512x512 and Symlet 5 (Sym5) is used as the filter. The level of decomposition is set to 3 because the performance archive its best at level 3 while level 4 and above the value is stagnant as at level 3.
[image:4.595.36.277.168.266.2]For instance, Fig. 4 shows the original wavelet coefficients representation of Lena on detail subbands (horizontal, vertical and diagonal) and its edgemap representation after the DWT process.
Fig. 4. The detail subband (horizontal, vertical and diagonal) representation based on original wavelet coefficients.
By applying our proposed equation to horizontal, vertical and diagonal details respectively, the unsignificant wavelet coefficients are discarded while keeping the significant one. Fig. 5 shows the example of eliminating the undesired coefficients value at Lenas’ diagonal subband using our designated threshold value, .
(a) (b)
Fig. 5. (a)The estimation of the threshold value, λD, on diagonal detail by
using the proposed method (b)The wavelet coefficient reprerentation after the thresholding process.
It is clearly can be seen that by using our efficient proposed technique, only the unsignificant near-zero coefficient is discarded, while the significant coefficients that carry the fine details and edges is preserve.
[image:4.595.317.569.336.444.2]TABLE1. THE COMPARISON OF COEFFICIENT AMOUNT BETWEEN ORIGINAL DWT AND THE PROPOSED METHOD
Image Subband DWT
(Coefficients) (Coefficients) Proposed Coefficients Reduced
Lena Horizontal 262144 31443 88.01%
Vertical 262144 35974 86.28%
Diagonal 262144 34843 86.71%
Mandrill Horizontal 262144 56834 78.32%
Vertical 262144 61854 76.40% Diagonal 262144 56197 78.56%
This degradation amount of wavelet coefficient is however doesn’t degrade the image quality. As can be seen in Table 2, only the smooth area region that carrying the non-details effected. As Human Visual System (HVS) is just concern on the hard region which contain the fine edge and details, lost value at smooth region is acceptable.
TABLE2. THE EDGEMAP REPRESENTATION OF (A) ORIGINAL WAVELET COEFFICIENTS (B) WAVELET COEFFICIENTS USING OUR PROPOSED METHOD
V. CONCLUSION
In this work, we have proposed a new efficient threshold value estimation for each detail subbands. By adapting the standard deviation rules, we propose our own λ based on the characteristic of each subband. By using this method, each wavelet coefficient in subband is considered, resulting an effective estimation. According to the experiment, we can observed that the quality of edgemap of the image is superior without harming the significant fine details and edges.
Our futher work will continue with the decompression process to produce the compressed reconstructed image.
ACKNOWLEDGMENT
The authors would like to thank the Universiti Tun Hussein Onn Malaysia (UTHM), Research, Innovation, Commercialization and Consultancy Management (ORICC) office and Malaysian Ministry of Education for facilitating this research activity under Research Supporting Grant Scheme (RSGS) Vot U109.
REFERENCES
[1] N. S. A. M. Taujuddin and R. Ibrahim, “Medical Image Compression by using Threshold Predicting Wavelet-Based Algorithm,” Lect. Notes Electr. Eng, Adv. Comput. Commun. Technol. Springer, vol. 315, pp. 755–765, 2014.
[2] S. . Subramanya, “Image compression,” IEEE Potentials, vol. 20, no. March, pp. 19–23, 2001.
[3] S. Burak, G. Carlo, T. Bernd, and G. Chris, “Medical Image Compression Based on Region of Interest, With Application to Colon CT Images,” in 23rd Annual EMBS International Conference, 2001, pp. 2453–2456.
[4] S. Hashemi-berenjabad, A. Mahloojifar, and A. Akhavan, “Threshold Based Lossy Compression of Medical Ultrasound Images Using Contourlet Transform,” 18th Iran. Conf. Biomed. Eng., no. December, pp. 14–16, 2011.
[5] R. Loganathan and Y. S. Kumaraswamy, “Active Contour Based Medical Image Segmentation and Compression Using Biorthogonal Wavelet and Embedded Zerotree,” Indian J. Sci. Technol., vol. 6, no. April, pp. 4390–4395, 2013.
[6] P. C. Tay, S. T. Acton, and J. A. Hossack, “Computerized Medical Imaging and Graphics A wavelet thresholding method to reduce ultrasound artifacts,” Comput. Med. Imaging Graph., vol. 35, no. 1, pp. 42–50, 2011.
[7] V. P. Baligar, “Low complexity , and high fidelity image
compression using fixed threshold method,” vol. 176, pp. 664–675, 2006.
[8] F. Halstead, J. Underhill, and M. Harper, “Fixed percentage of wavelet coefficients to be zeroed for ECG compression,” Electron. Lett., vol. 39, no. I, pp. 830–831, 2003.
[9] P. S. A. Devi and M. G. Mini, “Compression of Computed Radiographic Images Using Linear Prediction on Wavelet Coefficients,” in 2012 International Conference on Advances in Computing and Communications (IEEE Conference Publication), 2012, no. 1, pp. 130–133.
[10] M. Abo-Zahhad, A. F. Al-Ajlouni, S. M. Ahmed, and R. J. Schilling, “A new algorithm for the compression of ECG signals based on mother wavelet parameterization and best-threshold levels selection,” Digit. Signal Process., vol. 23, no. 3, pp. 1002–1011, May 2013.
[11] L. E. U. Sánchez, H. M. P. Meana, M. N. Miyatake, A. Santa, A. No, C. San, F. Culhuacan, and D. Coyoacán, “Wavelet Image
Compression Using Universal Coefficients Matrix Detail Estimation,” IEEE Comput. Soc., 2004.