International Journal of Emerging Technology and Advanced Engineering
Website: www.ijetae.com (ISSN 2250-2459,ISO 9001:2008 Certified Journal, Volume 3, Issue 3, March 2013)
645
Analysis of Energy Detection based Spectrum Sensing over
Wireless Fading Channels in Cognitive Radio Network
Omkar S. Vaidya
1, Vijaya M. Kulkarni
21M. E. (Communication Engineering), M.I.T., Aurangabad 2Associate Professor (E & C Dept.), M.I.T., Aurangabad
Abstract— The rapid growth of wireless communications has made the problem of under utilization of spectrum. Cognitive Radio technology has come out to solve this problem by allowing unlicensed user to use licensed spectrum bands opportunistically without affecting their performance. To sense existence of licensed user, Energy Detection based spectrum sensing technique is used over different wireless fading channels. Performance metrics like probability of false alarm, probability of detection and signal to noise ratio are evaluated by analyzing receiver operating characteristics. This paper presents a simulation comparison among different wireless fading channels. The results show that probability of detection is improved in all fading channels and Nakagami-m fading channels gives more improved performance than other fading channels by using Energy Detection Spectrum Sensing Technique.
Keywords— Cognitive Radio Network, Energy Detection, Fading Channels, Receiver Operating Characteristics (ROC) Curve, Spectrum Sensing.
I. INTRODUCTION
[image:1.612.326.565.221.383.2]Traditional wireless networks use fixed spectrum allocation policies for licensed users. Recent studies on the measurement of the spectrum show that by conventional spectrum an allocation policy, the average utilization of the spectrum is low as illustrated in Figure 1 [1], [2]. And this underutilization is due to the fact that a licensed user may not fully utilize the spectrum at all times in all locations. Hence to meet the increasing spectrum demands for wireless applications, needs of flexible spectrum management technique are arises in order to improve efficiency of spectrum. Dynamic Spectrum access is proposed to solve these current inefficiency problems and hence Cognitive Radio (CR) is the key enabling technology which will enable the user to determine which portion of spectrum is available and detect presence of licensed users when user is operated in licensed band (i.e. Spectrum Sensing). CR detect unused spectrum and share spectrum without harmful interference with other users. To sense the existence of licensed user, Spectrum Sensing techniques are used. This paper is aimed to discuss Energy detection based Spectrum Sensing Technique over different Wireless Fading Channel and analyze improvement in signal detection capability.
Figure 1 Spectrum under-utilization [1]
International Journal of Emerging Technology and Advanced Engineering
Website: www.ijetae.com (ISSN 2250-2459,ISO 9001:2008 Certified Journal, Volume 3, Issue 3, March 2013)
646
In addition, the results have revealed that, in comparison with the conventional energy detector, the studied frequency domain technique yields significant performance enhancement in the form of reduced probability of false alarm. The performance of energy detector is characterized by Receiver Operating curves usually. S. Atapattu et al. [5] used AOC (Area under the Receiver Operating curves) to analyze the performance of the energy detector method over Nakagami fading channels. Results showed that a higher value of fading parameter leads to larger average AUC, and thus, higher overall detection capability. This is because the average AUC converges to unity faster when the average SNR and the fading index increase Also, amongst the average SNR and the fading parameter, the average SNR is shown to be the dominant factor in determining the detection capability, particularly in the low-SNR region. Mohammad Hossain
et.al. [6] analyzed the performance of cooperative spectrum sensing for different number of Cognitive Radio users in Cognitive Radio. Performance of cooperative spectrum sensing over Rayleigh and Nakagami fading are presented and compared. It has been found that probability of missed detection is decreased by using different number of CR users. It is observed that OR rule gives better performance than AND and MAJORITY rule in various channels. Also it is observed that spectrum sensing for different number of CR users is harder in presence of Rayleigh and Nakagami fading and performance of energy detection degrades more in Nakagami channels than Rayleigh channel. In [7], the performance of energy detection based spectrum sensing in multipath fading environment is analyzed using OFDM multiplexing technique. A predetermined value of probability of detection and probability of false Alarm is used in order to calculate the optimum threshold value. That threshold value is used to evaluate the performance in the sense of probability of detection Vs SNR. This is known as Constant detection rates (CDR) and Constant False Alarm rates (CFAR). In real time scenarios the noise variance is unknown therefore both known and unknown noise variance cases are also discussed.
The main objective of this Paper is to study and evaluate closed form expressions for probability of detection for various fading channels like additive white Gaussian noise (AWGN), Rayleigh and Nakagami. Also this paper gives primitive objective is to study and analyze performance of energy detection based spectrum sensing technique using receiver operating characteristics curve (ROC).
The paper is organized as follows: Section II explains System Modeling for Energy detection based Spectrum Sensing in which closed form expressions for Probability of Detection for various Fading Channels are evaluated.
Simulation results for different fading channels are presented in Section III. Finally the report is concluded in Section IV that highlights the applications that merit attention in future scope for development.
II. SYSTEM MODELING
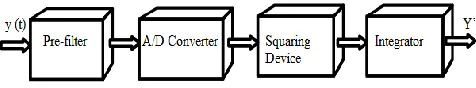
[image:2.612.325.563.349.393.2]Energy detection is the most popular spectrum sensing method since it is simple to implement and does not require any prior information about the primary signal [8]. An energy detector (ED) simply treats the primary signal as noise and decides on the presence or absence of the primary signal based on the energy of the observed signal. Since it does not need any a priori knowledge of the primary signal, the ED is robust to the variation of the primary signal. Moreover, the ED does not involve complicated signal processing and has low complexity. In practice, energy detection is especially suitable for wide-band spectrum sensing [9]. Energy detector is composed of four main blocks as shown in Figure 2 [10].
Figure 2 Block Diagram of Energy Detection Based Spectrum Sensing
The output that comes out of the integrator is energy of the filtered received signal over the time interval T and this output is considered as the test statistic to test the two hypotheses H0 and H1 [3]. H0: corresponds to the absence of the signal and presence of only noise. H1: corresponds to the presence of both signal and noise.
Thus for the two state hypotheses numbers of important cases are:-
a) H1 turns out to be TRUE in case of presence of primary user i.e. P (H1 / H1) is known as Probability of Detection (Pd).
b) H0 turns out to be TRUE in case of presence of primary user i.e. P (H0 / H1) is known as Probability of Missed-Detection (Pm).
c) H1 turns out to be TRUE in case of absence of primary user i.e. P (H1 / H0) is known as Probability of False Alarm (Pf).
A. Decision Statistic
International Journal of Emerging Technology and Advanced Engineering
Website: www.ijetae.com (ISSN 2250-2459,ISO 9001:2008 Certified Journal, Volume 3, Issue 3, March 2013)
647
The received signal y (t) is filtered by a pre-filter which is a b a n d - p a s s filter. The filtered signal is then passed through A/D converter i.e. converted to samples. Decision statistic can be Y or any quantity which is monotonic with Y. Taking Y’ as decision statistic [3].
' 2 0 0 1
( )
T
Y y t dt
N
(1)Decision statistic Y’ under H1 has a non-central chi-square distributed [11] with 2BNT degrees of freedom and
non-centrality parameter λ given by
0
s
E
N [3]. Now, defining
Signal to Noise Ratio (SNR), γ in terms of non-centrality parameter as in [12],
0 2 2 s s E E N N
(2)
B. Probability of detection for AWGN Channel
Probability of detection Pd and false alarm Pf can be evaluated respectively by [12],
Pd = P(Y’ > Λ|H1) (3)
Pf = P(Y’ > Λ|H0) (4)
Where Λ is decision threshold, Also, Pf can be written in terms of Probability density function as [13],
Pf fY'( )y dy
(5) From (4), we get:
1 1 2
2 ( )
y d
f d
P y e dy
d
(6)Dividing and multiplying the RHS of above equation by
2d-1, we get,
1 2
1 2
2 ( )
d y
f
y
P e dy
d
(7)Substituting ,
2 2
y dy
t dt
and changing the limits of
integration to ,
2
, we get,
1 ( )
/ 2
1
2 ( )
d t
f
P t e dt
d
(8)or ( , / 2)
( ) f d P d
(9)
Where, Γ (.) is the incomplete gamma function [14]. Now, probability of detection can be written by making use of cumulative distribution function [13].
Pd = 1 – FY’ (Λ) (10)
The cumulative distribution function (CDF) of Y’ can be obtained (for an even number of degrees of freedom which is 2d in this case) as [11],
FY'( )y 1 Qd( , ) (11)
Therefore using (10) and (11), probability of detection Pd for AWGN channel is [12],
Pd Qd( , ) (12)
Using (2) Pd Qd( 2 , ) (13)
Where, Qd(.,.) is the generalized Marcum-Q function and thus, probability of detection for AWGN channel can be evaluated using above expression.
C. Probability of detection for Rayleigh Channel
Probability density function for Rayleigh channel is [15],
) 1exp 0
γ γ
f(γ , γ γ
(14)
Probability of detection for Rayleigh Channel is obtained by averaging their probability density function over Probability of detection for AWGN Channel [12],
,
0
( )
d R d
P P f d
(15)Where Pd,R is the probability of detection for Rayleigh Channel. With (13), (14) and (15) becomes:
,
0 1
( 2 , ) exp
d R d
P Q d
(16)Now substituting x, x d2, 2xdx in (16), we get, 2 , 0 2
. ( 2 , ) exp
x
d R d
P x Q x dx
International Journal of Emerging Technology and Advanced Engineering
Website: www.ijetae.com (ISSN 2250-2459,ISO 9001:2008 Certified Journal, Volume 3, Issue 3, March 2013)
648
Considering result in [16],
2 2 2
2 2 2 2 1 2 2 2 2 2 2 0
2 2 2
2 2 . 2 2 2 0 0 1
. .exp ( , ) .exp .
1 1
exp .
! 2 ! 2
M
p x b
M
b a n n
M M
p a
n n
p a
dx x Q ax b
p a
b a b
n p a n
(18) Comparing (17) and (18),2 2
, 2 , and
p a b M d
.
Thus, using (18) Probability of detection for Rayleigh Channel can be expressed as [12],
2 ( / 2) ,
0
2
2(1 ) 2
0
1 ! 2
1 1
exp exp
! 2(1 )
n d d R n n d n P e n n
(19)The above expression gives the probability of detection for Energy detection based spectrum sensing over Rayleigh Channel.
D. Probability of detection for Nakagami-m Fading Channel
The Nakagami distribution is often used for the following reasons. First, the Nakagami distribution can model fading conditions that are either more or less severe than Rayleigh fading. When m=1, the Nakagami distribution becomes the Rayleigh distribution, when m=1/2, it becomes a one-sided Gaussian distribution, and when m=∞ the distribution becomes an impulse (no fading). Second, the Rice distribution can be closely approximated by using the following relation between the Rice factor K and the Nakagami shape factor m;
2
2 1
m m
K , m
m m m
(20)
2 ( 1) (2 1) K m K
(21)
Since the Rice distribution contains a Bessel function while the Nakagami distribution does not, the Nakagami distribution often leads to convenient closed form analytical expressions that are otherwise unattainable.
Using the alternative representation of Marcum-Q function given in [17], can be written as
1 2
0 0
( 2 , )
! ! 2
k
n n u
d n k e e Q n k
(22)If the signal amplitude follows a Nakagami distribution, then the PDF of γ follows a gamma PDF given by,
1 1
exp 0
m
m
m mγ
f(γ) γ , γ
Γ(m) γ γ
(23)
Where, m is the Nakagami parameter. The average Pd in case of Nakagami Channels Pd Nakcan now be obtained by averaging (13) over (23) and then using again the change of variable x 2 yielding,
2
2 2 1
0
exp ( , )
mx
m
d Nak d
P a x Q x dx
(24)where, 1 1 ( )2 m m m a
m
(25)
In this case, a closed form formula of Nakagami channels can be given by,
1 1
1 1 1
( / 2)
; 1;
2( !) 2
u
d Nak
n
P a G F m n
n m
(26)Where, 1F1(.;.;.) is the confluent hypergeometric function [18].
2 / 2
( ) m m e m
(27)
and 2 2 2 1 1 0
exp ( , )
mx m
d
G x Q x dx
(28)Where Q(.,.) is the first order Marcum Q-function. G1 can be evaluated for inter m with aid of [14].
-1
-1 (- / 2).
1 -1
-2
0
2 ( -1)!
1 -2 -2 m m m m m m n m n n
m m m
G e L
m m m
m m L m m
(29)International Journal of Emerging Technology and Advanced Engineering
Website: www.ijetae.com (ISSN 2250-2459,ISO 9001:2008 Certified Journal, Volume 3, Issue 3, March 2013)
649
III. SIMULATION RESULT
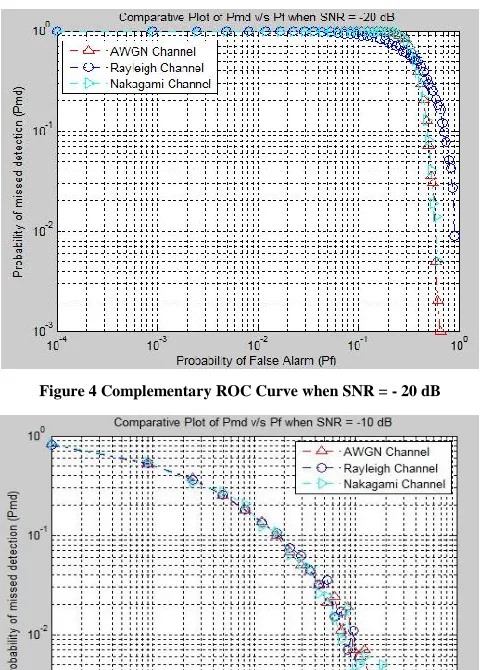
Detection probability (Pd), False alarm probability (Pf) and missed detection probability (Pmd = 1 - Pd) are the key measurement metrics that are used to analyze the performance of spectrum sensing techniques. The performance of a spectrum sensing technique is illustrated by the receiver operating characteristics (ROC) curve which is a plot of Pd versus Pf or Pmd versus Pf. All simulation was done on MATLAB version 7.10.0 (R2010a) over three different fading channels viz. AWGN, Rayleigh and Nakagami Channels. Monte-Carlo method is used for
simulation. We described receiver through it
complimentary ROC curves for a different values of probability of false alarm, probability of detection and signal to noise ratio.
[image:5.612.324.564.117.452.2]From Figure 3-5, it is clearly seen that, for vey less probability of false alarm values, probability of missed detection is very high. But, as Pf values are getting increased, Pmd values are going to reduce drastically. Thus, it improves performance of energy detector at low SNR values. Table I show that values of probability of false alarm increases; there is drastic decrease in probability of missed detection. Similarly, as values of SNR are varying there is still decrease in values of probability of missed detection.
Figure 3 Complementary ROC Curve when SNR = - 30 dB
Figure 4 Complementary ROC Curve when SNR = - 20 dB
[image:5.612.48.289.419.594.2]International Journal of Emerging Technology and Advanced Engineering
Website: www.ijetae.com (ISSN 2250-2459,ISO 9001:2008 Certified Journal, Volume 3, Issue 3, March 2013)
650
TABLE I
COMPARISON OF PROBABILITY OF MISSED DETECTION VERSUS PROBABILITY OF FALSE ALARM WHEN SIGNAL TO NOISE RATIO IS VARYING OVER DIFFERENT WIRELESS FADING CHANNELS
Value of Pf
AWGN Rayleigh Nakagami
Probability of missed detection Probability of missed detection Probability of missed detection SNR =
-30dB
SNR = -20dB
SNR = -10dB
SNR = -30dB
SNR = -20dB
SNR = -10dB
SNR = -30dB
SNR = -20dB
SNR = -10dB
0.0001 1 1 0.821 1 1 0.804 1 1 0.826
0.1521 1 0.999 0.002 0.92 0.852 0.001 1 0.999 0.002
0.3969 0.999 0.393 0 0.623 0.496 0 0.999 0.381 0
0.4761 0.593 0.125 0 0.505 0.333 0 0.583 0.13 0
0.5329 0.051 0.035 0 0.441 0.271 0 0.062 0.041 0
TABLE II
COMPARISON OF PROBABILITY OF DETECTION VERSUS PROBABILITY OF FALSE ALARM WHEN SIGNAL TO NOISE RATIO IS VARYING OVER DIFFERENT WIRELESS FADING CHANNELS
Value of Pf
AWGN Rayleigh Nakagami
Probability of detection Probability of detection Probability of detection SNR =
-30dB
SNR = -20dB
SNR = -10dB
SNR = -30dB
SNR = -20dB
SNR = -10dB
SNR = -30dB
SNR = -20dB
SNR = -10dB
0.0049 0.004 0.139 0.754 0.026 0.178 0.768 0.003 0.147 0.747
0.0225 0.055 0.46 0.944 0.153 0.498 0.931 0.056 0.508 0.925
0.0625 0.28 0.767 0.978 0.336 0.735 0.984 0.296 0.767 0.983
0.1369 0.624 0.922 0.998 0.572 0.895 0.999 0.607 0.92 0.996
0.2401 0.873 0.982 0.999 0.751 0.96 1 0.889 0.984 0.998
TABLE III
COMPARISON OF PROBABILITY OF DETECTION VERSUS SIGNAL TO NOISE RATIO WHEN PROBABILITY OF FALSE ALARM IS VARYING OVER DIFFERENT WIRELESS FADING CHANNELS
Value of SNR (in dB)
AWGN Rayleigh Nakagami
Probability of detection Probability of detection Probability of detection Pf =
0.001
Pf = 0.003
Pf = 0.005
Pf = 0.001
Pf = 0.003
Pf = 0.005
Pf = 0.001
Pf = 0.003
Pf = 0.005
- 15 0 0.017 0.057 0.0339 0.11 0.183 0 0 0
- 14 0.016 0.101 0.227 0.072 0.198 0.278 0 0 0
- 13 0.101 0.295 0.442 0.144 0.345 0.481 0 0 0
- 12 0.283 0.555 0.721 0.329 0.507 0.673 0 1 1
- 11 0.55 0.804 0.894 0.575 0.786 0.864 1 1 1
- 10 0.844 0.957 0.978 0.86 0.937 0.874 1 1 1
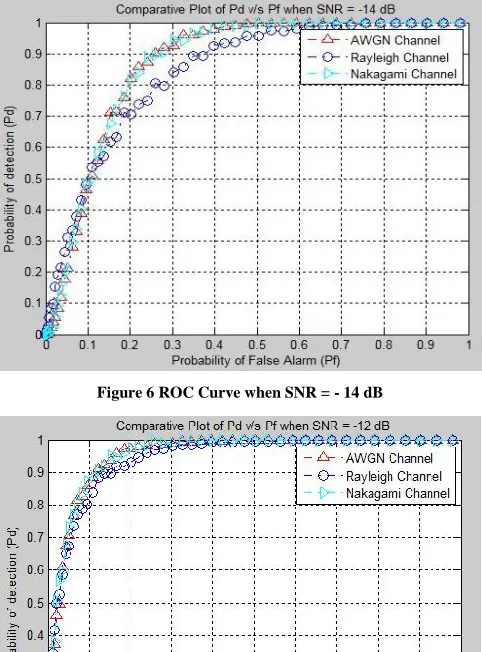
From Figure 6-8 and table II, it is depicted that as values of probability of false alarm increases, values for probability of detection also increases. When values of SNR are increased, then there is dramatically increase observed in probability of detection at very few values of probability of false alarm. As SNR values vary from -14 dB to -12 dB, probability of detection improves by 1.77 times in AWGN channel, by 1.95 times in Rayleigh Channel and by 1.84 times in case of Nakagami Channel.
International Journal of Emerging Technology and Advanced Engineering
Website: www.ijetae.com (ISSN 2250-2459,ISO 9001:2008 Certified Journal, Volume 3, Issue 3, March 2013)
651
Thus, by Monte-Carlo simulation method, it is observed that performance of energy detection based spectrum sensing is boosted up in Nakagami Channel compared with others.
IV. CONCLUSION
In this paper, dynamic spectrum management techniques like Cognitive Radio Technology have been discussed. Performance of Energy detection based Spectrum Sensing is implemented over Wireless Fading channels viz. AWGN, Rayleigh and Nakagami – m fading channels. Closed form expressions for probability of detection and false alarm over different wireless fading channels are evaluated. Three performance metrics such as probability of detection, probability of false alarm and signal to noise ratio are considered for analysis for energy detection based spectrum sensing technique. Various ROC (Receiver Operating Characteristics) curves i.e. plot of Pd versus Pf or Pmd versus Pf has been plotted over fading channels. Monte-Carlo technique is used for simulation in MATLAB version 7.10.0.499 (R2010a) as a software platform.
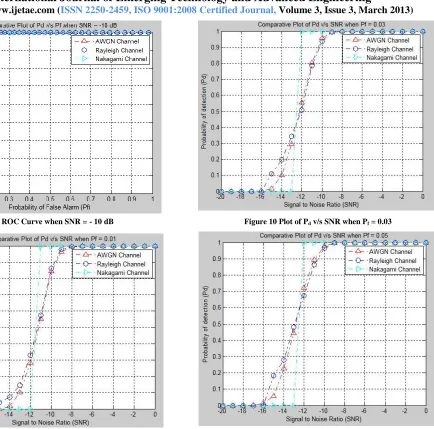
As values of SNR vary from -30 dB to -10 dB, probability of detection improves by 1.77 times in AWGN Channel, 1.95 times in Rayleigh Channel and 1.84 times in Nakagami-m fading channels. Also, when probability of false alarm increases from 0.01 to 0.05, there is drastic improvement observed in probability of detection by 6.4 times in AWGN Channel, 5.7 times in Rayleigh Channel and 7.86 times in case of Nakagami –m fading channels. Thus in Cognitive Radio Network, it is observed that with low computational complexities, detection of presence of primary user signal is easiest job by using Energy detection based Spectrum sensing technique. From comparative plot, it is clearly observed that, among various fading channels Nakagami–m fading channels gives more improvement in probability of detection than Rayleigh and AWGN fading
channels.
[image:7.612.324.565.122.448.2]In future, performance analysis can be done over other wireless fading channels like Rician, Suzuki etc. Also, cooperative spectrum sensing method can be used to achieve still better sensing performance in detector of Cognitive Radio Network.
[image:7.612.323.566.303.521.2]Figure 6 ROC Curve when SNR = - 14 dB
International Journal of Emerging Technology and Advanced Engineering
Website: www.ijetae.com (ISSN 2250-2459,ISO 9001:2008 Certified Journal, Volume 3, Issue 3, March 2013)
[image:8.612.126.560.101.530.2]652
Figure 8 ROC Curve when SNR = - 10 dB
[image:8.612.50.290.109.530.2]Figure 9 Plot of Pd v/s SNR when Pf = 0.01
Figure 10 Plot of Pd v/s SNR when Pf = 0.03
[image:8.612.320.565.116.503.2]International Journal of Emerging Technology and Advanced Engineering
Website: www.ijetae.com (ISSN 2250-2459,ISO 9001:2008 Certified Journal, Volume 3, Issue 3, March 2013)
653
REFERENCES
[1 ] M. McHenry, ―Frequency agile spectrum access Technologies,‖ in Proc. of FCC Workshop on Cognitive Radio, May 2003.
[2 ] G. Staple and K. Werbach, ―The end of spectrum scarcity,‖ IEEE Spectrum, vol. 41, pp. 48–52, March 2004.
[3 ] H. Urkowitz, ―Energy detection of unknown deterministic signals,‖ Proc. IEEE, vol. 55, no. 4, pp. 523–531, Apr. 1967.
[4 ] Ebtihal Haider Gismalla and Emad Alsusa, ―Performance Analysis of the Periodogram-Based Energy Detector in Fading Channels‖, IEEE Transaction on Signal Prpcessing, vol. 59, no.8, pp. 3712-3721, August 2011.
[5 ] S. Atapattu, C. Tellambura and H. Jiang, ―Analysis of Area under ROC curve of energy detection‖ IEEE Transactions On Wireless Communications, Vol. 9, No.3, pp. 1216-1225, 2010.
[6 ] Mohammad Hossain, Shahoreare Ahmed, Md. Shamim Hossain, Md. Ibrahim Abdullah, ―Performance of Cooperative Spectrum Sensing for different numbers of CR users in Cognitive Radio‖, International Journal of Science and Research, vol. 1, issue 3, pp. 145-149, December 2012.
[7 ] Saqib Saleem and Khurram Shahzad, ―Performance Evaluation of Energy Detection Based Spectrum Sensing Technique for Wireless Channel‖, International Journal of Multidisciplinary Sciences and Engineering, Vol. 3, no. 5, pp. 31-34, May 2012.
[8 ] N. Reisi, M. Ahmadian and S. Salari, ―Performance Analysis of Energy Detection- based Spectrum Sensing over Fading Channels‖, 6th International Conference on Wireless Communications Networking and mobile Computing, No. 9, pp. 1-4,
[9 ] J. Ma, G. Y. Li and B. H. Juang, ―Signal Processing in Cognitive Radio‖, Proceedings of IEEE, Vol.97, No. 5, pp.805-823, 2009. [10 ]J. Segura and X. Wang,― GLRT Based Spectrum Sensing for
Cognitive Radio with Prior Information‖, IEEE Transactions on Communications, Vol. 58, No.7, pp.2137- 2146, 2010.
[11 ]J. G. Proakis, Digital Communications, New York: McGraw-Hill, ed. 4th, 2001.
[12 ]F.F. Digham, M.S. Alouini and M.K. Simon, ―Energy Detection of unknown signals over fading channels‖, IEEE Transactions on Communications, Vol. 5, No.1, pp. 21- 24, 2007.
[13 ]A. Papoulis and S. U. Pillai, Probability, Random Variables, and Stochastic Processes, New York: McGraw-Hill, ed. 4th, 2002. [14 ]I.S. Gradshteyn and I.M. Ryzhik. Table of Integrals, Series, and
Products, New York: Academic Press, ed. 7th, 2007.
[15 ]Z. Han, R. Fan and H. Jiang, ―Replacement of Spectrum Sensing in Cognitive Radio‖, IEEE Transactions on Wireless Communications, Vol. 8, No.6, pp. 2819- 2826, 2009.
[16 ]A. H. Nuttall, ―Some integrals involving Q-M functions (Corresp.)‖, IEEE Transactions on Information Theory, Vol.21, No. 1, pp. 95-96, 1975.
[17 ]M. Nakagami, ―The m distribution; a general formula of intensity distribution of rapid fading,‖ Statistical Methods in Radio Wave Propagation, W.G. Hoffman, ed., pp. 3–36, 1960.
![Figure 1 Spectrum under-utilization [1]](https://thumb-us.123doks.com/thumbv2/123dok_us/8731957.887187/1.612.326.565.221.383/figure-spectrum-under-utilization.webp)