Testing the Reliability of Sketch Maps for Multi-sited
Design Studies
Hope Hui Rising
School of Design and Construction, Washington State University, USA
Copyright©2016 by authors, all rights reserved. Authors agree that this article remains permanently open access under the terms of the Creative Commons Attribution License 4.0 International License
Abstract Most design research studies using sketch
maps as a data source [2, 7, 17] have not produced generalizable design principles possibly due to the lack of a reliable multi-sited evaluative framework. The author proposed a sketch map assessment rubric based on the speculated development of spatial knowledge from declarative, procedural, hierarchical, topological, configurational, to projective [12, 17, 22]. The rubric postulated these 6 stages as parallels of landmark, path, edge, district, pattern, and diagram. A pattern here denotes a gestalt-like network comprising landmarks, paths, edges, and districts in Lynch’s [17] terms. A diagram refers to an abstraction of a pattern. Two raters scored 55 sketch maps sampled by the author from 8 cities to test the rubric’s inter-rater reliability. To generate rubric-based coherence indicators, the author recoded their ratings according to 3 scoring schemes: Scheme A hypothesized that all stages were distinctly different; scheme B posited no distinction among topological, configurational, and projective types when participants’ graphic representational capacities were not significantly different; scheme C postulated that all types beyond declarative and procedural components belonged to the overarching category of survey knowledge characterized by relations of spatial components. To validate these indicators as identifiability measures, the investigator used internal consistency reliability tests to triangulate them with other measures produced by 2 other raters based on the identifiability of 55 sketch maps. The results suggested that topological, configurational, and projective knowledge types were not significantly different. Graphic production skill differences could thus be ignored in this sample. This study demonstrated the feasibility of using behavioral geography and design theories to generate reliable and valid coherence indicators from sketch maps as a reliable data source. This approach could potentially enable researchers to quantify the coherence of sketch maps for multi-sited design studies.Keywords Sketch Map Coherence, Assessment Rubric,
Multi-sited Design Research, Spatial Knowledge, Imageability, Identifiability, Reliability1. Introduction
1.1. Imageability Due to Coherent Spatial Composition
In The Image of the City, Lynch [17 p13] speculated that
Venice and Dutch polder cites are probably imageable environments; specifically, he pointed out that Dutch urban designers often created polder cities as “a total scene” that made it easy for users to “identify its parts” and “structure the whole.” This statement suggests that a systematic integration of urban fabrics with waterscapes is possibly the main contributor to the aesthetic coherence of water-centric cities. Coherence is likely a spatial organization quality that makes the city represented by a sketch map identifiable. In other words, the identifiability of sketch maps may suggest imageability as an expected attribute of the urban composition they represent. The use of sketch maps from multiple cities with similar characteristics, such as the profuse use of water in their urban fabrics, could potentially be a feasible way to derive generalizable urban design principles.
recommendations were not generalizable beyond the studied city of Ciudad Guayana. His sketch map rubric was not based on spatial cognition theories, and the rubric was not tested for its validity and reliability. Instead, he used a data-driven approach to derive his rubric from observations of the major typologies in the sketch maps he collected from only the studied city.
1.3. Study Goal and Objectives
This study intended to demonstrate the feasibility to use sketch maps as a reliable data source to produce generalizable measures for multi-sited studies interested in analyzing externalized expressions of spatial knowledge. To this end, the author aimed to test whether evaluative rubrics derived from the literature in behavioral geography could be used to assess sketch map coherence as a reliable and valid construct for measuring the identifiability of sketch maps collected from cities known for their water-centric urban fabrics.
1.4. Definition of Terms
To operationalize coherence as a sketch map quality that makes the city it represented identifiable, the author proposed sketch map evaluative rubrics based on the following 6 spatial knowledge types distilled from behavioral geography literature: declarative, procedural, hierarchical, topological, configurational, and projective.
Declarative: Golledge and Stimson [11] used declarative to refer to an ability to recognize salient objects or scenes and ascertain their meanings. This landmark knowledge is the first stage for the development of spatial knowledge in new environments [30]. The author postulates that the declarative component is similar to landmark as an element of imageability proposed by Lynch [17].
Procedural: Consistent with Golledge and Stimson [11], procedural knowledge alludes to the rules that link declarative components or landmarks to develop route knowledge as a sequence of eye-level views or egocentric images of landmarks together with movement directions [9]. The author postulates that procedural knowledge has parallels to path as an element of imageability [9] and declarative relations, as path structure, cognitively instigate the element of node for imageability [9].
Hierarchical: Gollege and Stimson [11] employed hierarchical ideas to depict the mechanism underlying the development of survey knowledge as the spatial concept of a sequence of proximities to spatial anchors of different importance levels. The investigator posits that hierarchical components can be wayside landmarks along a path or landmarks around a node to form an edge as an element of imageability [9]. In addition, hierarchical relations among spatial anchors of sequential orders spatially expand this linear spillover effect to suggest systems of landmarks as declarative relations.
Topological: Golledge and Stimson [11] used topological
to describe spatial properties unaltered under elastic deformation by continuous planes, including proximity and separation, openness and enclosure, and dispersion and clustering. Piaget and Inhelder [25] used topological to describe a transitional phase between egocentric and allocentric spatial knowledge. According to Lynch [17], the district as an element of imageability is an aerial concept defined by the edge. Topological is thus construed here as a cognitively integrating ability to perceive urban districts based on the following assumptions: 1) The clustering of landmarks in proximity to a path potentially creates a sense of enclosure to form cognitive edges; 2) these edges help delineate open areas as districts in cognitive maps due to the edges’ contrast with separated elements in dispersion; 3) edges can also be perceived due to the presence of linear spatial anchors, such as canals or rivers, or through sequencing wayside spatial anchors into a continuous boundary; and 4) a district can also be formed by clustering hierarchical knowledge in the form of a series of proximities spread from spatial anchors.
Configurational: Many have posited configurational abilities as a general term to describe the allocentric or top-down view of cognitive images with survey knowledge [11, 15]. Similar to Merriam-Webster Dictionary’s definition of configuration, Kaplan [14] describes the cognitive map as a gestalt-like network of elements that act as a whole rather than as a mere assortment of elements. This study thus uses configurational to characterize the ultimate stage of allocentric or survey knowledge, where the wholeness of a figure or pattern becomes identifiable as more than a collection of declarative, procedural, hierarchical, and topological components and relations as elements of imageability.
Projective: This study adopts the Merriam-Webster Dictionary’s definition for projective as “relating to, produced by, or involving geometric projection” because it is in line with Kuipers’ [16] and Montello’s [21] use of cognitive projective to describe abstract survey knowledge with inferred spatial components or relations.
1.5. Influences of Graphic Representational Capacities on Sketch-map Coherence
hierarchical/topological, 3) configurational/projective, and 4) metric.
Egocentric, typological, projective, and metric knowledge types dominate the environmental cognition of the sensory-motor, preoperational, concrete operational, and formal operational development stages proposed by Piaget and Inhelder [25]. Egocentric knowledge is embedded within the declarative and procedural categories for the proposed rubrics. While Golledge and Stimson [11] used configurational cognition as a generic term to refer to allocentric knowledge, Kuipers [16] and Montello [21] repurposed this term as a transitional phase between qualitative (typological) to quantitative (metric) spatial knowledge. As this study is not concerned with the quantitative accuracy of sketch maps, metric cognition was not investigated.
1.6. Hypotheses for Scoring Schemes
Scoring Scheme A: Assuming the presence of significantly different graphic representational capacities among participants, scoring scheme A used configurational to denote a distinct stage between the topological and projective categories. Configurational refers to the most common allocentric knowledge as concrete relations of actual elements, rather than as an abstraction of inferred relationships that characterize projective.
Scoring Scheme B: Topological is a kind of configurational knowledge when it refers to a transitional phase between egocentric and allocentric [11, 25]. Configurational and projective knowledge types may be reflections of different graphic representation skill levels when the same spatial knowledge type is externally expressed on sketch maps [22]. Scoring scheme B posited no significant difference for participants’ graphic representational capacities and therefore no distinction among topological, configurational, and projective knowledge types. These knowledge types were then consolidated as allocentric knowledge, while egocentric knowledge alluded to declarative and procedural knowledge. These delimitations of allocentric and egocentric knowledge led to the positioning of hierarchical as an intermediate stage between egocentric and allocentric knowledge.
Scoring Scheme C: In contrast, scoring scheme C hypothesized that all spatial knowledge types beyond declarative and procedural components belonged to the overarching category of survey knowledge characterized by relations. Declarative relations refer to systems of landmarks as regional patterns of interrelationships between salient features, such as buildings, movements, or bridges. Procedural relations denoted path structures in the sense of interconnections of route knowledge for sequencing landmarks. Hierarchical components described ordered immediacies around landmarks or paths as spatial anchors versus a sequence of proximities around systems of landmarks or path structures for hierarchical relations.
2. Methods
The investigator first had 2 raters score sketch maps to improve the reliability of a literature-derived rubric using inter-rater reliability tests. Then, their ratings from the reliable rubric were recorded using 3 scoring schemes to generate rubric-based coherence indicators. The author conducted internal consistency tests to triangulate these rubric-based coherence indicators with other coherence measures produced from 2 other raters based on the identifiability of sketch maps.
2.1. Selection of Water Cities
Google search indicated that 12 cities have been referred to as “Venice of the North” because of their water-based appeal to visitors and residents. Wikipedia provides a list of 10 such cities: Amsterdam, Bruges, Copenhagen, Giethoorn, Hamburg, Henningsvær, Manchester,’s-Hertogenbosch, Saint Petersburg, and Stockholm. Berlin [18] and Ghent [28] have also been compared to Venice. Among this shortlist of alluring water cities, the author chose 6 as study sites based on precipitation pattern similarity and geographical proximity for cost of sampling as selection criteria. The 6 cities chosen are Amsterdam and Giethoorn in the Netherlands, Ghent and Bruges in Belgium, and Berlin and Hamburg in Germany. Only Amsterdam and Hamburg are coastal water cities while the other four are inland water cities. The author added Rotterdam, the second largest Dutch city, and Almere, the fastest growing city in Europe, to the selection of study sites because, similar to Amsterdam and Hamburg, these two Dutch polder cities are also appealing coastal water cities.
2.2. Field Data Collection
The author conveniently sampled 60 participants from these 8 cities. In order to ensure sufficient variations in the sample of sketch maps, the investigator endeavored to recruit tourists and residents from different backgrounds in each city. The investigator used a randomized order to sequence the 8 cities. Each city’s 9 sampling sites always included major entry points (such as airports, inter-city train stations, and bus stations), city halls, and tourist bureaus, and various hotels, cafés, ethnic stores, and universities. Each participant was instructed to draw a sketch map of the city where they were sampled. As 5 participants could not draw a map from memory, this sample of 60 participants resulted in 55 sketch maps.
2.3. Sketch Map Evaluation Protocol for Rubric-based Coherence Indicators
exposure to either the study or the 8 cities were recruited for 2 evaluations of the 55 sketch maps using different rubrics and pre-survey briefing materials. These 55 maps were presented in a randomized sequence for each rubric in Qualtrics. To control potential data entry errors and collect insights for improving rubric 1, the investigator instructed the 2 raters to keep track of their ratings in Qualtrics using a paper scoring sheet, and to provide one sentence describing their reasons for each rubric category.
Table 1. Proposed rubric 1 for sketch map evaluation Please select one statement that best describes the sketch map. This sketch map appears to…
1. Show randomly distributed landmarks/nodes with few path connections or an impressionist sketch of landmark characteristics. 2. Illustrate an interrelated system of landmarks and nodes with few path connections.
3. Display few path segments to connect nodes and landmarks as if drawn from turn-by-turn navigation instructions.
4. Exhibit a network of interrelated paths, making route improvisation possible.
5. Reveal distinct landmark/node clusters around anchor points (major landmarks).
6. Demonstrate a nested hierarchy of landmark/node clusters around anchor points.
7. Delineate districts by continuous edges or the clustering of landmarks/nodes.
8. Show a nested hierarchy of multiple districts.
9. Indicate a distinct form that resembles only a small part of the city center.
10. Capture the city structure as an identifiable configuration that can be easily recalled without looking at the map.
11. Conjecture abstract components from known topological or configurational components.
12. Infer abstract relationships from known topological or configurational relationships.
Survey 1 with raters 1 and 2 using rubric 1: For the first sketch map survey, the investigator provided raters 1 and 2 rubric 1 (Table 1) and pre-survey briefing readings that included the following: 1) Lynch’s [17 p46-49] explanations for landmark, path, node, edge, and district excerpted from The Image of the City; 2) a verbatim passage of the anchor-point theory from Spatial Behavior [11 p167], and 3) the Merriam-Webster Dictionary definitions of topological and configurational. Raters 1 and 2 had difficulty discerning the extent to which a sketch map covers the entire city and the differences between projective versus concrete spatial components and relations. Based on the raters’ written explanations for their rubric 1 ratings, both raters had difficulty discriminating components from relations within each of the rubric’s 6 implicit spatial knowledge categories: declarative, procedural, hierarchical, topological, configurational, and projective.
Survey 2 with raters 1 and 2 using rubric 2: To address these 2 observations from survey 1 results, the investigator added 8 city maps in the pre-survey briefing materials for survey 2 and used the raters’ verbal explanations from survey 1 to revise rubric 1 into rubric 2 (Table 2). Rubric 2 made explicit the 6 spatial knowledge types as components and relations. In addition, the author added the definitions of
these spatial knowledge types, as shown in Section 1.4, to the revised pre-survey briefing materials.
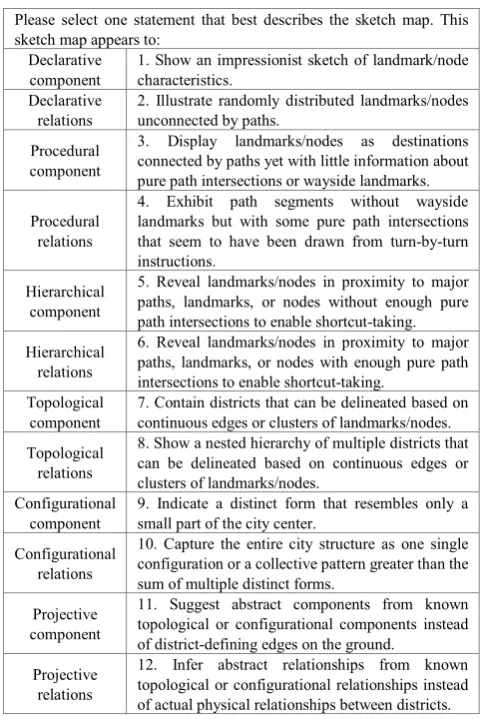
Table 2. Proposed rubric 2 for sketch map evaluation Please select one statement that best describes the sketch map. This sketch map appears to:
Declarative
component 1. Show an impressionist sketch of landmark/node characteristics. Declarative
relations 2. Illustrate randomly distributed landmarks/nodes unconnected by paths. Procedural
component
3. Display landmarks/nodes as destinations connected by paths yet with little information about pure path intersections or wayside landmarks.
Procedural relations
4. Exhibit path segments without wayside landmarks but with some pure path intersections that seem to have been drawn from turn-by-turn instructions.
Hierarchical component
5. Reveal landmarks/nodes in proximity to major paths, landmarks, or nodes without enough pure path intersections to enable shortcut-taking. Hierarchical
relations
6. Reveal landmarks/nodes in proximity to major paths, landmarks, or nodes with enough pure path intersections to enable shortcut-taking.
Topological
component 7. Contain districts that can be delineated based on continuous edges or clusters of landmarks/nodes. Topological
relations
8. Show a nested hierarchy of multiple districts that can be delineated based on continuous edges or clusters of landmarks/nodes.
Configurational
component 9. Indicate a distinct form that resembles only a small part of the city center. Configurational
relations
10. Capture the entire city structure as one single configuration or a collective pattern greater than the sum of multiple distinct forms.
Projective component
11. Suggest abstract components from known topological or configurational components instead of district-defining edges on the ground.
Projective relations
12. Infer abstract relationships from known topological or configurational relationships instead of actual physical relationships between districts.
2.4. Sketch Map Evaluation Protocol for Identifiability-based Coherence Indicators
The investigator also collected data for generating identifiability-based coherence indicators as criteria for assessing the validity of rubric-based coherence indicators. During the second survey, after raters 1 and 2 selected a rubric description for each sketch map, they were instructed to glance at the 8 city maps for no longer than 10 seconds to determine whether they could recognize the city represented by each sketch map (item 1 in Table 3). The author assigned a code of 1 or 0 to this item when each sketch map was identified successfully or not, respectively, to generate the measure of uncolored allocentric coherence (UAC) based on the identifiability of uncolored sketch maps.
[image:4.595.63.297.204.467.2]identifiability-based coherence indicators, the investigator colored the water elements in the 55 sketch maps in blue before presenting them at random to raters 3 and 4, who had no previous exposure to the study or briefing materials. For each sketch map, the investigator provided written instructions, asking the raters to choose the best-fitting rubric category and then scan 8 city maps for no longer than 10 seconds to identify the city associated with each colored sketch map (item 2 in Table 3). The author then assigned a code of 1 for correct and 0 for incorrect and unsure identification of each sketch map to generate the measure for the variable of colored allocentric coherence (CAC) based on the identifiability of colored sketch maps from a top-down perspective.
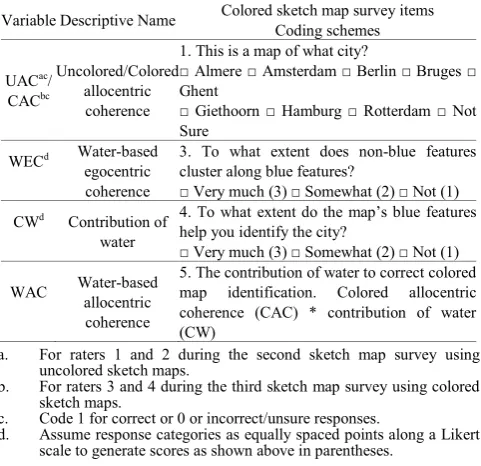
Table 3. Survey questions and coding schemes for non-rubric-based coherence measures
Variable Descriptive Name Colored sketch map survey items Coding schemes
UACac/ CACbc
Uncolored/Colored allocentric coherence
1. This is a map of what city?
□ Almere □ Amsterdam □ Berlin □ Bruges □
Ghent
□ Giethoorn □ Hamburg □ Rotterdam □ Not
Sure WECd Water-based
egocentric coherence
3. To what extent does non-blue features cluster along blue features?
□ Very much (3) □ Somewhat (2) □ Not (1)
CWd Contribution of water
4. To what extent do the map’s blue features help you identify the city?
□ Very much (3) □ Somewhat (2) □ Not (1)
WAC Water-based allocentric coherence
5. The contribution of water to correct colored map identification. Colored allocentric coherence (CAC) * contribution of water (CW)
a. For raters 1 and 2 during the second sketch map survey using uncolored sketch maps.
b. For raters 3 and 4 during the third sketch map survey using colored sketch maps.
c. Code 1 for correct or 0 or incorrect/unsure responses.
d. Assume response categories as equally spaced points along a Likert scale to generate scores as shown above in parentheses.
Water-based coherence measures: Survey 3 asked raters 3 and 4 to evaluate the extent to which non-blue features cluster along blue features as perceived from an eye-level perspective (item 3 in Table 3) and the contribution of blue features to the identifiability of each map from a top-down perspective (item 4 in Table 3). Both items assumed their 3 response categories as equally spaced points along a 3-point Likert scale to generate scores for water-based egocentric (eye-level) coherence (WEC) and contribution of water (CW), respectively. The measure for water-based allocentric (top-down) coherence (WAC) was generated by multiplying colored allocentric coherence (CAC) with the contribution of water (CW).
2.5. Sketch Map Coding Schemes Based on Numbers of Spatial Knowledge Stages
The investigator generated 7 rubric-based coherence measures (3 dual-perspective coherence and 4 allocentric coherence measures) in Table 4 by coding the ratings from
[image:5.595.313.550.340.443.2]survey 2 with the 7 scoring schemes in Table 5. Twelve-stage coherence (12C) was produced from coding rubric 2 ratings with scheme A, which hypothesized that all knowledge types were distinct developmental stages of spatial cognition as represented by a Likert scale of 12 equally spaced points. Using an 8-point Likert scale, scheme B posited that topological, configurational, and projective were interchangeable terms for describing the most advanced qualitative state of a sketch map, while declarative, procedural, and hierarchical were distinct categories along a gradient for the development of spatial knowledge. Coding rubric 2 ratings with scheme B created scores for 8-stage coherence (8C). Finally, with a 3-point Likert scale, scheme C postulated that differences were found only among 3 gradually more elaborated states of spatial comprehension as declarative, procedural, and survey knowledge, which referred to all spatial knowledge types beyond declarative and procedural categories. The investigator used scheme C to code rubric 2 ratings to derive values for 3-stage coherence (3C).
Table 4. Coding schemes for rubric-based coherence measures Dual-perspective
coherence Scheme Allocentric coherence Scheme 12-stage
coherence (12C) A coherence (PC) Projective D 8-stage
coherence (8C) B Configurational coherence (CC) E 3-stage
coherence (3C) C coherence (TC) Topological F Hierarchical
coherence (HC) G Table 5. Coding schemes for the proposed sketch map evaluation rubric knowledge type
A B C D E F G 1. Declarative component 1 1 1 0 0 0 0 2. Declarative relations 2 2 3 0 0 0 0 3. Procedural component 3 3 2 0 0 0 0 4. Procedural relations 4 4 3 0 0 0 0 5. Hierarchical component 5 5 3 0 0 0 1 6. Hierarchical relations 6 6 3 0 0 0 1 7. Topological component 7 7 3 0 0 1 1 8. Topological relations 8 8 3 0 0 1 1 9. Configurational
component 9 7 3 0 1 1 1
10. Configurational
relations 10 8 3 0 1 1 1
11. Projective component 11 7 3 1 1 1 1 12. Projective relations 12 8 3 1 1 1 1
2.6. Coding Schemes for Allocentric Coherence Based on Sketch Map Identifiability
[image:5.595.312.554.472.642.2]allocentric coherence (UAC and CAC) in Table 3. Among the 4 coding schemes for allocentric coherence measures in Table 4, scheme D for projective coherence (PC) assumed that only projective knowledge contributed to allocentric coherence, that is, map identifiability, by assigning a dummy code of 1 to projective components and relations, and 0 to other spatial knowledge types. Scheme E for configurational coherence (CC) hypothesized that allocentric coherence required at least configurational knowledge by dummy-coding configurational and projective components and relations as 1 and other categories as 0. Scheme F for topological coherence (TC) assigned 1 as a dummy code to topological, configurational, and projective components and relations and 0 to other classifications based on the assumption that allocentric coherence necessitated no less than topological knowledge. Finally, scheme G for hierarchical coherence (HC) postulated that allocentric coherence was attributed to hierarchical knowledge as a bare minimum via allocating 1 to hierarchical, topological, configurational, and projective components and relations and 0 to other states of spatial cognition.
2.7. Data Analysis
The investigator calculated the intra-class correlation coefficients (ICCs) of all coherence measures in Tables 3 and 4 in SPSS 22 using a 2-way mixed model and an absolute agreement definition, as suggested by McGraw and Wong [19], to assess their reliabilities between raters and measures. Along with the Cronbach’s alpha as a commonly used inter-rater and internal consistency reliability indicator, SPSS provided the ICC average measure to assess the proportion of a variance attributable to judges for the average ratings of 2 independent raters.
ICC values between 0.60 and 0.74 are commonly cited as cutoffs for good inter-rater reliability [5, 12]. Several studies used 0.6 as an acceptable ICC threshold [3, 24] and as an acceptable threshold for determining internal consistency reliability with Cronbach’s alpha [13]. As the lower bound of a reliability coefficient, Cronbach’s alpha does not require measures of precision, such as confidence intervals [6]. This study used 0.6 as the cut-off value for both ICC and Cronbach’s alpha to qualify reliability between raters and measures.
3. Results
3.1. Inter-rater Reliability
With 0.6 as an acceptable threshold for Cronbach’s alpha and ICC average measure [19], the 12-stage coherence (12C) and 8-stage coherence (8C) from rubric 1 ratings did not have sufficient inter-rater reliability (α12C =.3<.6, ICC12C =.3<.6, p12C>.05; α8C =.2<.6, ICC8C =.3<.6, p8C>.05). Although the 3-stage coherence (3C) for rubric 1 was reliable (α3C =.7>.6, ICC3C =.7>.6, p3C<.001), it was
excluded due to the aforementioned flaws of rubric 1. The first 2 raters’ written descriptions indicated that rubric 2 and the revised briefing materials enabled adequate differentiation of the 6 spatial knowledge categories and their respective components and relations. Table 6 summarizes the results of inter-rater reliability test for the second and third sketch map surveys.
Table 6. Inter-rater reliability of sketch map coherence measures. 12C 8C 3C PC CC TC HC UAC CAC WAC WEC
α b .7*** .6*** .4* .6** .6** .7*** .4 .7*** .7*** .7*** .7*** ICCc .6*** .6*** .4* .6** .5** .7*** .4 .7*** .7*** .7*** .6*** a. *p<.05; **p<.01; ***p<.001.
b. Cronbach’s Alpha
c. Intra-class Correlation Coefficient based on 2-way mixed effects, absolute agreement definition, and the assumption of zero interaction effect.
The author chose 12-stage coherence (12C), 8-stage coherence (8C), projective coherence (PC), and topological coherence (TC) as possible coherence measures, which were derived from coding the rubric 2 average ratings with scoring schemes A, B, D, and F. This was because the Cronbach’s Alpha and ICC average measures for these four indicators were significantly greater or equal to 0.6 (α12C =.7>.6, ICC12C=.6, p12C<.001; α8C =.6, ICC8C =.6, p8C<.001;
αPC =.6, ICCPC =.6, pPC<.001; αTC =.7>.6, ICCTC =.6,
pTC<.001). Both map identifiability measures, uncolored allocentric coherence (UAC) and colored allocentric coherence (CAC), were reliable (αUAC =.7>.6, ICCUAC=.7>.6, pUAC<.001; αCAC =.7>.6,ICCCAC =.7>.6,
pCAC<.001). Acceptable inter-reliability was also observed for water-based allocentric coherence (WAC) and water-based egocentric coherence (WEC) (αWAC =.7>.6, ICCWAC=.7>.6, pWAC<.001; αWEC =.7>.6, ICCWEC =.6,
pWEC<.001).
3.2. Internal Consistency Reliability
Table 7 summarizes the results of internal consistency reliability test using 0.6 as an acceptable threshold for Cronbach's Alpha and ICC Average Measure (McGraw & Wong, 1996). The 2-measure internal consistency reliability test showed that uncolored allocentric coherence (UAC) and colored allocentric coherence (CAC) were not significantly different (αUAC/CAC =.8>.6, ICC UAC/CAC=.8>.6
UAC/CAC<.001).The author triangulated these 2 measures
with projective coherence (PC) and topological coherence (TC), respectively, in 3-measure internal consistency reliability tests. Projective coherence (PC), that is, the identification of projective components and relations alone, exhibited an acceptable level of internal consistency reliability with the 2 map-identifiability-based allocentric coherence measures (α UAC/CAC/PC=.7>.6, ICCUAC/CAC/PC=.6,
pUAC/CAC/PC<.001). Topological coherence (TC), which
(UAC) and colored allocentric coherence (CAC) based on the ICC average measure (αUAC/CAC/TC =.7>.6, ICCUAC/CAC/TC=.7>.6, p UAC/CAC/TC<.001). Water-based
allocentric coherence (WAC) (αUAC/WAC/TC =.6=.6, ICCUAC/WAC/TC=.5<.6, p UAC/WAC/TC<.001) and water-based
egocentric coherence (WEC) (αUAC/WEC/TC =.5<.6, ICCUAC/WEC/TC=.2<.6, p UAC/WEC/TC<.01) were significantly different from uncolored allocentric coherence (UAC) and topological coherence (TC). According to Bonett [4], optimal sample size can be determined by the size of ICC and the number of ratings per subject, as well as the desired significant level (alpha) and desired width (w) of the confidence interval. For alpha= .95 and w= .2, Bonett [4] concluded that the optimal sample size for 5 ratings varied from 10 to 64 for ICC from .9 to .1. Bonett’s [4] sample size approximation method suggests that a sample size of 55 sketch maps provided adequate power for this study based on .6 as a ICC cutoff value and fewer than 5 ratings per rater.
Table 7. Internal consistency reliability of sketch map coherence measures Measure
1 UAC UAC UAC UAC UAC UAC UAC UAC UAC Measure
2 CAC CAC CAC WAC WAC WAC WEC WEC WEC Measure
3 PC TC PC TC PC TC
α b .8*** .7*** .7*** .7*** .5*** .6*** .6** .5** .7*** ICCc .8** .6*** .7*** .5*** .4*** .5*** .2** .2** .3*** a. **p<.01; ***p<.001.
b. Cronbach’s alpha.
c. Based on 2-way mixed effects, absolute agreement definition, and the assumption of zero interaction effect.
4. Discussions
The results indicate that projective knowledge is a dominant allocentric cognition type associated with the identifiability of sketch maps. In addition, the graphic representational capacities of this participant sample did not significantly confound detection of these various coherence schemas. These 3 knowledge types are thus interchangeable instead of distinct spatial concepts for this participant sample. The allocentric knowledge for associating sketch maps with cities is distinct from hierarchical spatial relations. Hierarchical spatial knowledge is therefore likely to be a phase between egocentric and allocentric spatial cognition abilities.
This study demonstrated a feasible research design to assess the reliability and validity of sketch map coherence measures as indicators of identifiability. However, the 8- and 12-stage rubrics may still need to be deployed for design research projects to provide sufficient morphological nuance between rubric categories to derive meaningful spatial implications for building an empirical theory of imageability.
The same research design should be replicated for a
greater number of cities including those without water-centric urban environments. Such replication should also be conducted with a more rigorous sampling procedure to make the rubrics more robust for multi-sited applications. However, the complexity of the sketch-map rubrics may make them difficult for large sample populations to use. Specific categories may be consolidated if no significant difference between them has been found in pilot data to make the rubrics more accessible to a larger group of non-researcher participants.
The significant difference between water-based coherence measures and topological coherence could possibly suggest that the contribution of water to map identifiability has not been accounted for in the proposed rubric using Lynch’s 5 elements of imageability as parallels of the spatial knowledge types from the literature of behavioral geography. Future studies may investigate whether water-based features are cognitively distinct from Lynch’s [17] 5 elements of imageability, which are landmarks, nodes, paths, edges, and districts. This investigation may help test the hypothesis of waterscapes as a six element of imageability.
REFERENCES
[1] Anderson, J., & Tindall, M. (1972). The concept of home range: New data for the study of territorial behavior. Environmental design: Research and practice, 1, 1-7.
[2] Appleyard, D. (1976). Planning a pluralist city: Conflicting realities in Ciudad Guayana.
[3] Baumgartner, T. A., & Chung, H. (2001). Confidence limits for intra-class reliability coefficients. Measurement in Physical Education and Exercise Science, 5(3), 179-188. [4] Bonett, D. G. (2002). Sample size requirements for estimating
intra-class correlations with desired precision. Statistics in Medicine, 21(9), 1331–1335.
[5] Cicchetti, D. V. (1994). Guidelines, criteria, and rules of thumb for evaluating normed and standardized assessment instruments in psychology. Psychological assessment, 6(4), 284.
[6] Cronbach, L. J. (1951). Coefficient alpha and the internal structure of tests. Psychometrika, 16(3), 297-334.
[7] De Jonge, D. (1962). Images of Urban Areas Their Structure and Psychological Foundations. Journal of the American Institute of Planners, 28(4), 266-276.
[8] Ferguson, E. L., & Hegarty, M. (1994). Properties of cognitive maps constructed from texts. Memory & Cognition, 22(4), 455-473.
[9] Gillner, S., & Mallot, H. A. (1998). Navigation and acquisition of spatial knowledge in a virtual maze. Journal of Cognitive Neuroscience, 10(4), 445-463.
[11] Golledge, R. G., & Stimson, R. (1997). Spatial behaviour: A geographic perspective. Guilford, London.
[12] Hallgren, K. A. (2012). Computing inter-rater reliability for observational data: An overview and tutorial. Tutorials in quantitative methods for psychology, 8(1), 23.
[13] Hume, C., Ball, K., & Salmon, J. (2006). Development and reliability of a self-report questionnaire to examine children's perceptions of the physical activity environment at home and in the neighbourhood. International Journal of Behavioral Nutrition and Physical Activity, 3(1), 16.
[14] Kaplan, S. (1976). Adaptation, structure and knowledge. In G. T. Moore & R. G. Golledge (Eds.), Environmental knowing (pp. 32-45).
[15] Kirasic, K. C., Allen, G. L., & Siegel, A. W. (1984). Expression of Configurational Knowledge of Large-Scale Environments Students' Performance of Cognitive Tasks. Environment and behavior, 16(6), 687-712.
[16] Kuipers, B. (1978). Modeling Spatial Knowledge*. Cognitive science, 2(2), 129-153.
[17] Lynch, K. (1960). The Image of the City (pp. 91-117). Cambridge, MA: MIT Press.
[18] MacLean, R. (2011). Venice of the North - Meet the Germans | Rory's Berlin Blog | Goethe-Institute [Internet]. Blog.goethe.de. 2016 [cited 17 September 2016]. Available from:
http://blog.goethe.de/meet-the-germans/archives/173-Venice-of-the-North.html
[19] McGraw, K. O., & Wong, S. P. (1996). Forming inferences about some intra-class correlation coefficients. Psychological methods, 1(1), 30.
[20] Maguire, E. A., Burke, T., Phillips, J., & Staunton, H. (1996). Topographical disorientation following unilateral temporal lobe lesions in humans. Neuropsychologia, 34(10), 993-1001. [21] Montello, D. R. (1998). A new framework for understanding
the acquisition of spatial knowledge in large-scale environments. Spatial and temporal reasoning in geographic information systems, 143-154.
[22] Moore, G. T., & Golledge, R. G. (1976). Environmental knowing: Theories, research and methods: Dowden.
[23] Osmond, H. (1963). What's New in Psychiatric Research? Mind: psychiatry in general practice, 275.
[24] Ostroff, C., & Schmitt, N. (1993). Configurations of organizational effectiveness and efficiency. Academy of management Journal, 36(6), 1345-1361.
[25] Piaget, J., & Inhelder, B. (1967). The child’s conception of space (FJ Langdon & JL Lunzer, Trans.). New York.
[26] Quaiser-Pohl, C., Lehmann, W., & Eid, M. (2004). The relationship between spatial abilities and representations of large-scale space in children—a structural equation modeling analysis. Personality and Individual Differences, 36(1), 95-107.
[27] Raplee, P. (2010). Ghent, Belgium: attractions, tours, and even a time lord. Retrieved 01/16, 2013, from http://www.offbeattravel.com/ghent-belgium-tours-attractions -activities.html
[28] Ghent, Belgium: Attractions, tours, and even a Time Lord [Internet]. Offbeattravel.com. 2016 [cited 17 December 2016]. Available from:
http://www.offbeattravel.com/ghent-belgium-tours-attractions -activities.html
[29] Siegel, A. W. (1981). Externalization of cognitive maps by children and adults: in search of ways to ask better questions. Spatial representation and behavior across the life span: theory and application/edited by LS Liben, AH Patterson, N. Newcombe.