638
AUTOMATIC LIGHTNING WHISTLER DETECTION USING
CONNECTED COMPONENT LABELING METHOD
1KOMANG SETIA DHARMA, 2I PUTU AGUNG BAYUPATI, 3PUTU WIRA BUANA
123Department of Information Technology, Udayana University, Bali, Indonesia
E-mail: [email protected], [email protected], [email protected]
ABSTRACT
The Earth’s atmosphere contains many natural phenomena, one of them is lightning whistler. This phenomena is electromagnetic waves that occurs shortly after the occurrence of lightning and it propagates in the ionosphere and magnetosphere. It propagates with different speed resulting sound like a whistling at radio frequency and is commonly known as whistler wave. Some benefits on this research of whistler wave is for global communications, lightning geolocation, ground-to-satellite communications, satellite protection and many more. An effort to analyze the whistler waves is to detect patterns of whistling from whistler wave. For being able to detect the pattern of whistler, it must be converted into spectrogram image. In the detection process, spectrogram image goes through a noises removal process using image processing methods such as adaptive thresholding method, median filter and opening method. Noises removal process aims to remove or reduce the noises in the spectrogram image. Then, spectrogram image will be labeled and detected using connected component labeling method, the detection results are waves pattern that has marked with red border boxes and also a number of wave patterns detected. By using image processing, connected component labeling method and then applied with Matlab programming language, the pattern of whistler can be detected easily and faster.
Keywords: Whistler Wave, Connected Component Labeling, Image Processing.
1. INTRODUCTION
One natural phenomenon occurred in our atmosphere is lightning. In brief, lighting is a natural phenomenon occurred due to imbalance between positive and negative electrical charge within clouds. To make it balance, the cloud with negative charge (electron) surplus will discard some of its negative charge to the Earth surface, while the cloud with electron shortage will attract more electron from the Earth. When lightning strikes, it emits a huge negative (electron) charge and electromagnetic waves. One of the electromagnetic wave emitted is whistler waves, which has very low frequency range from 3-30 kHz [1]. It is named ‘whistler’ as the transposition of the signal into the audio frequency gives the impression of a whistle sound [2].
Study of whistler waves, as a type of VLF (Very Low Frequency) waves, has many benefits such as to derive the plasmaspheric electron density distribution, global communications, lightning geolocation, ground-to-satellite communication, satellite protection, solar activity, earthquakes detection and many more [3].
Whistler waves are captured by the satellite or scientific spacecraft receiver in the form of data sound recording and then transmitted to the VLF receiver station on Earth. Sound of data used in this research was obtained from the observation of the Earth plasmasphere by Akebono (EXOS-D) scientific spacecraft. Akebono (EXOS-D) is a scientific spacecraft from Japan that has been observing the Earth’s plasmasphere since 1989. Akebono Spacecraft carry the WBA (Wide Band Analyzer) onboard. WBA is a subsystem of the VLF instruments and it measures one component of the electrical or magnetic waveform below 15 kHz [4]. While orbiting the Earth’s plasmasphere, WBA detected large amounts of analog waveform [5] and “lightning whistler” is one of the most frequently observed wave signal. The Measured Data from WBA detection process is sent to the ground using the analog telemetry [6].
639 automatic detection process needed to speed up the detection process with a small error rate.
Bayupati et al [6] proposed a method to detect lightning whistler. The method work by performed a Finite Fourier Transform (FFT) into lightning whistler audio data to generate the variation of frequency with time. After FFT processing, the spectrum is calibrated and spike noise that contaminated the waveform data also eliminated. In the noise reduction process, the 50 Hz – 15 kHz band divided into 20 frequency ranges, than averaged the intensity of each frequency band and subtracted neighboring frequency points. For the next step, a threshold level for the detection of significant signals is defined to gain potential lightning whistler candidate. Based on Bayupati et al [6] research, we develop a simpler method to automatically detect lightning whistler pattern by using connected component labeling method.
The research objectives of this paper are to build an automatic lightning whistler detection system using connected component labeling method that can detect and count the whistler wave pattern automatically and more efficiently. The detection results also can be further used for various purposes such as the research to derive the plasmaspheric
electron density distribution, global
communications, lightning geolocation, ground-to-satellite communication, ground-to-satellite protection, solar activity, earthquakes detection and many more.
The process of the system begins with the whistler wave sound data converted to spectrogram image. The spectrogram image goes through a noises removal process using image processing methods such as adaptive thresholding method, median filter and opening method. Noises removal process aims to remove or reduce the noises in the spectrogram image. Lastly, spectrogram image will be labeled and detected using connected component labeling method, the detection results are waves pattern that has marked with red border boxes and also a number of wave patterns detected.
2. THEORITICAL BACKGROUND
2.1 Whistler Wave
Whistler wave probably being heard for the first time on long telephone lines in the beginning of 1886. However, just in 1919 the whistler waves Phenomenon could be described more clearly by Barkhausen. 37 years later in 1957, Storey succeeded to show that whistler wave is emitted from lightning strike [1].
According to previous explanation, lightning strike produces not only huge electric charges, but
also electromagnetic waves. The electromagnetic waves propagate in wide frequency. Some of it propagates in low frequency which can be heard by human. There are three types of electromagnetic
waves signal propagates within ELF/VLF
frequency range. Those types are as follows:
1. The first type of electromagnetic wave signal is
called atmospheric radio. The signal is short burst of radiation produced by lightning strike with a series of ‘clicks’ and ‘pops’ sound.
2. The second type of electromagnetic wave signal
is called whistler wave. It is called ‘whistler’ because the wave produces sound like falling pitch lasting a coupe seconds. It produces falling pitch sound because of the difference of the frequency and signal velocity when it propagates along magnetic field lines and within the radiation belts.
3. The third type of electromagnetic wave signal
has a very high pithced tone with a pattern of 1, 2, 3, pause, 1, 2, 3, pause [3].
Among those three types of signals previously explained, We focused on whistler waves signal in our detection. The whistler signal being detected takes form of sound data. To detect the pattern of whistler wave signal more easily, the sound data of whistler waves is transformed into spectogram image.
[image:2.595.308.527.554.681.2]Spectrogram, also known as spectral waterfall, voiceprint or voicegrams is a visual representation of the spectrum of frequencies in a sound or other signal as they vary with time or some other variable. Figure 1 is an example of spectogram image of Whistler Waves being detected and recorded by Akebono (EXOS-D).
Figure 1: Example of spectrogram image of a whistler wave recorded at Akebono (EXOS-D)[6].
2.2 Image Processing
640
still contains noises that interrupt the whistle
patterns detection process of spectrogram image. Thus, the noises removal process is done by using several methods of image processing such as image segmentation using adaptive thresholding method, median filter, opening method.
2.2.1 Adaptive thresholding
Adaptive thresholding is the first method used in noise removal process. Thresholding is a method to segment digital images according to pixel values on the images. The purpose of this thresholding method is to create a binary representation of the image, and also to classify the pixel value into two categories which are foreground and background. The thresholding process of spectogram image results the binary form of spectogram image. This process also decreases the noise in the image, although, the noise is not removed completely [7].
A threshold T(x,y) is a value such that :
(1)
According to equation above, B(x,y) is the binarized image and A(x,y) is the value of pixel intensity of the location (x,y) from image A. In Adaptive Thresholding technique, an image will be divided into several part of images where the thresholding value of each part of the image will be determined. Then, we can obtain the thresholding value of each part of the image with local character. The purpose of Adaptive Thresholding technique is to gain the best value of thresholding for images with different colors gradient [8].
2.2.2 Median filter
The second method in noise removal process is Median Filter method. The Median Filter is a nonlinear signal processing technology based on statistics. The Median Filter method is conducted by changing the pixel of the noise from the image with median pixel value of neighborhood. The process to gain median pixel values begins with arranging the neighborhood’s pixel value in order according to its gray level and the size of the mask. Then, the median value of the group is stored to replace the noisy value. The median filter output is as follows:
(2)
According to the equation above, f(x,y) is the original image dan g(x,y) is the output image respectively. W is the two dimensional mask that could take various forms such as linear, square, circular, cross, etc with the size of mask is n x n [9].
2.2.3 Opening method
The third method in the noise removal process is Opening method. Opening method is a morphological noise removal which combines two basic operation such as erosion and dilation operation. Opening method is done by conducting erosion operation at first, and then followed by dilation operation. Erosion operation is a transferring process or pixel decreasing process of the boundaries of an object in digital image. Meanwhile, dilation operation is a pixel increasing process of the boundaries of an object in digital image. The amount of pixel being decreased or increased depends on the size and the form of element structure being used. Opening operation has effect to smooth the object’s boundaries, to separate adjacent objects, and to remove smaller objects
In mathematical morphology, opening is the dilation of the erosion of a set A by a structuring element B :
(3)
where and denote erosion and dilation, respectively.
2.2 Connected Component Labeling
Connected Component Labeling method is the method used to detect the waves pattern in whistler waves spectogram image. Connected Component Labeling method is done by scanning each pixel from upper-left to bottom-right of an image. The scanning process aims to categorize the connected pixel in groups. Connected pixel is the pixel that shares the same amount of intensity values and is located closed to each other. When all pixels have been categorized, then the groups of pixel can be tagged or marked to distinct one group with others.
Component labeling algorithm is a two phase algorithm. In the first phase, each object pixel is assigned a label according to the following 4-connected neighborhood criteria.
(a) If both the upper neighbor A(i-1,j) and left neighbor A(i,j-1) of the object pixel A(i, j) have the same label X , then assign label X to A(i,j). (b) If either the upper neighbor A(i-1,j) or the left
neighbor A(i,j-1) of the object pixel A(i,j) has the label X, then assign label X to A(i, j). (c) If the upper neighbor A(i-1,j) has label X and
left neighbor A(i,j-1) of the object pixel P(i,j)
641 label X to A(i,j). Enter X and Y in an equivalence table, say it table T.
(d) If the upper neighbor A(i-1,j) and left neighbor A(i,j-1) of the object pixel A(i,j) are both not labeled pixels, then assign new label Z to the pixel A(i,j). Enter label Z in the equivalence table T.
The equivalence table T contains a set of equivalent labels. In the second phase, the equivalent labels are merged to create unique labels for each connected component in the image. If X and Y are two equivalent labels in table T, then reassign Y by X when the amount of pixel tagged by Y label is less than the amount of pixel tagged by X label. As a result, each connected component is assigned a unique label [10].
3. SYSTEM OVERVIEW
This session explain about the general overview of whistler wave detection process.
3.1 General Overview of Whistler Wave Detection
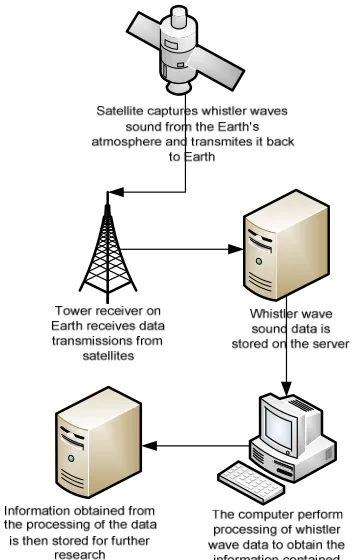
[image:4.595.100.276.442.722.2]The general overview of whole whistler wave detection process can be modeled as shown in figure 2.
Figure 2: General overview process of whistler wave detection
The following is an explanation of the general overview of whistler wave detection in figure 2.
1) Satellite captures sound whistler waves
propagating along the magnetic field lines, then the sound data is transmitted to the Earth.
2) On Earth, the receiving station receives sound
data transmission from the satellite.
3) The whole received sound data are stored on the
server.
4) The computer convert sound data into
spectrogram image and also perform detection process to spectrogram image to obtain the information contained.
5) The information result of spectrogram image
detection is, then, stored on the server for further research.
Global electron density is one of the benefits derived through the research on whistler wave. Global electron density can be determined by detecting, knowing the amount, frequency level and timing of whistler wave. The system that we build by using connected component labeling method only detect and count the whistler wave pattern automatically and more efficiently.
3.2 Design System
642
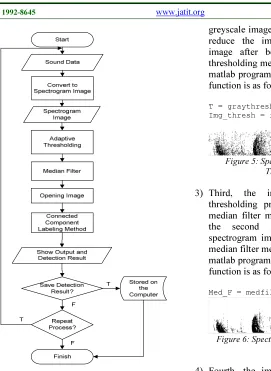
Figure 3: Flowchart of system
The following is an explanation of the system flow from figure 3.
1) First, user input whistler wave sound data. The
sound data format is WAV. To be able to do noise removal process, then the sound data is
converted to spectrogram image. The
spectrogram image (grayscale) as shown in figure 4. In the matlab programming language,
convert whistler wave sound data to
spectrogram image function is as follows:
[orig_audio, f] = audioread (‘audio.wav’);
axes (handles.axesa),specgram (orig_audio,521,f);
Figure 4: Spectrogram image (grayscale)
2) Second, the spectrogram image is processed
with adaptive thresholding methods to change the pixel value of spectrogram image from
greyscale image into a binary image and also to reduce the image noises. The spectrogram image after being processed with adaptive thresholding method is shown in figure 5. In the matlab programming language, the thresholding function is as follows:
[image:5.595.110.381.103.474.2]T = graythresh(img); Img_thresh = im2bw(img,T);
Figure 5: Spectrogram image after Adaptive Thresholding process
3) Third, the image result from adaptive
thresholding process will be processed with median filter method. This process is done as the second layer noises removal. The spectrogram image after being processed with median filter method is shown in figure 6. In the matlab programming language, the median filter function is as follows:
Med_F = medfilt2(Img_thresh,[Msk,Msk]);
Figure 6: Spectrogram image after Median Filter process
4) Fourth, the image result from median filter
process will be processed with opening method. This process is done to eliminate small detail objects (noise) in the image and to strengthen the object detection. The spectrogram image after being processed with opening method is shown in figure 6. In the matlab programming language, the opening function is as follows:
SE = strel ('square',4); ImgOpen = imopen (Med_F, SE);
Figure 7: Spectrogram image after Opening process
5) Fifth, the image result from opening process
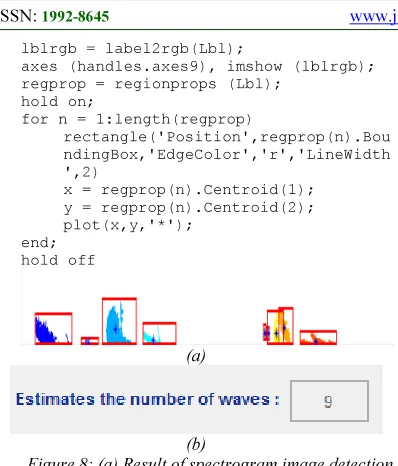
will be detected with connected component labeling method. The detection result is shown in figure 8. In matlab programming language, the connected component labeling function is as follows:
643 lblrgb = label2rgb(Lbl);
axes (handles.axes9), imshow (lblrgb); regprop = regionprops (Lbl);
hold on;
for n = 1:length(regprop)
rectangle('Position',regprop(n).Bou ndingBox,'EdgeColor','r','LineWidth ',2)
x = regprop(n).Centroid(1);
y = regprop(n).Centroid(2);
plot(x,y,'*');
end; hold off
(a)
(b)
Figure 8: (a) Result of spectrogram image detection (b) Estimates the number of wave detected
Figure 8 shows the detection result of spectrogram image with segmented and red box border labeled whistler wave. The figure also shows the number of patterns detected.
6) Sixth, the user can choose whether the data will
be stored in the computer or not.
7) Seventh, the user can choose to repeat the
detection process or not.
4. IMPLEMENTATION
This automatic lightning whistler detection system is applied in the Matlab programming language. Matlab is a high-level language and interactive environment for numerical computation, visualization, and programming. Matlab allows us to analyze data, to develop algorithms, and to create models and applications. The language, tools, and built-in math functions facilitates us to explore multiple approaches and to reach a solution faster [11].
4.1 System Interface Result
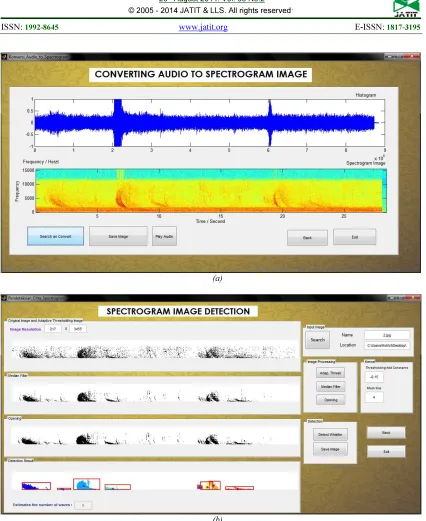
The system interface is the main interface system to easily enable the user to use lightning whistler detection system with maximum potential. This system interface uses GUI Matlab. The interface system is shown in figure 9.
Figure 9 shows the interface system of lightning whistler detection system. The interface consists of two modules, the first module is to convert the audio data of whistler wave into spectrogram image and the second module is to detect whistler wave pattern in the spectrogram
image. The interface is designed as simple as possible to allow the user to use the system easily. The interface is also designed to be more informative where the result of each image processing phase is shown. Hence, the user will fully understand the detection process from the beginning until the final phase more easily.
4.2 Experiment Result
To discover the accuracy rate of the system to detecting the pattern of whistler wave sound in spectrogram image, the detection process toward a number of whistler wave sound data is required to be done. This method will show the average of accuracy rate of the system where higher accuracy rate means better method.
[image:6.595.91.290.107.340.2]The following table is experiment result of automatic lightning whistler detection system. The detection trial is done toward six different whistler wave sound data.
Table 1: Experiment result
From Table 1, we can see that the detection of spectrogram image from whistler wave sound using connected component labeling method results differently. The variation is caused by the difference of noise intensity within the whistler wave sound. One data shows less accurate result due to high intensity of noise. Meanwhile, other data shows higher accurate result due to lower intensity of noise. The average accuracy rate of detection using connected component labeling method is 90% with the range of error 10%. Thus, we can conclude that this method is quite accurate.
5. CONCLUSION
This desktop basis system is built with Matlab and GUI programming language. The aim of this research is to build an automatic lightning whistler detection system using connected component labeling method to be able to detect the pattern of whistler wave sound in spectrogram image.
Data
The Number Of
detected Un
detect ed
Accur
acy Error Manu
al
Auto matic
1 12 13 1 92% 8%
2 15 13 2 87% 13%
3 22 22 0 100% 0%
4 8 10 2 80% 20%
5 10 9 1 90% 10%
6 14 15 1 93% 7%
[image:6.595.304.510.362.498.2]644 According to the result of the experiment of six different whistler wave sound data, the system that we build can detect the whistler wave pattern
automatically and efficiently, the detection
accuracy reaches 90% with the range of error 10%. Thus, we can conclude that the system works quite accurate in detecting the pattern of the whistler wave. The noise intensity in spectrogram image is the largest factor that affects the accuracy of image detection.
This system is a basic system in detecting lightning whistler where the detection result of the system is expected to be used in further research about lightning whistler.
REFRENCES:
[1] R.A. Helliwell, “Whistlers and Related Ionospheric Phenomena”, Originally published by Stanford University Press, Stanford, California (1965), 2006.
[2] Lichtenberger. J, “A New Whistler Inversion Method”, J. Geophys. Res., 114, A07222, doi:10.1029/2008JA013799, 2009.
[3] “Introduction to VLF”, (Online) February
2014. Avaliable at : http://vlf.stanford
.edu/research/introduction-vlf
[4] I. Kimura, K. Hashimoto, I. Nagano, T. Okamada, M. Yamamoto, T. Yoshino, H. Matsumoto, M. Ejiri, and K. Hayashi, ” VLF Observations by The Akebono (EXOS-D) Satellite”, J. Geomag. Geoelectr., vol.42, 1990, pp.459-478.
[5] Y. Kasahara, A. Hirano, and Y. Takata, “Similar Data Retrieval from Enormous Datasets on ELF/VLF Wave Spectrum Observed by Akebono”, Data Science Jurnal, vol.8, March 2010, pp. IGY66-IGY75.
[6] I.P.A. Bayupati, Y. Kasahara, Y. Goto, “ Study of Dispersion of Lightning Whistler Observed
by Akebono Satellite in the Earth’s
Plasmasphere”, IEICE Trans. Commun., vol. E95-B, no.11, 2012, pp. 3472-3479.
[7] D. Bradley, Gerhard. R, “Adaptive
Thresholding Using the Integral Image”,
[online] 2006. Available at : http://
people.scs.carleton.ca/~roth/iit-publications-iti/docs/gerh-50002.pdf
[8] T.R.Singh, S. Roy, “A New Local Adaptive Thresholding Technique in Binarization”,
International Journal of Computer Science Issues, Vol. 8, Issue 6, No 2, November 2011 [9] Youlian. Z, C. Huang, “An Improved Filtering
Algorithm for Image Noise Reduction”, Physics Procedia, Vol 25, 2012, pp. 609–616. [10] T. Acharya, A.K. Ray, “Image Processing -
Principles and Applications”, Wiley
InterScience, 2006, pp. 311-312.
[11] “Matlab The Languege of Technical
Computing”, (Online) February 2014.
645
(a)
(b)
[image:8.595.87.513.88.609.2]![Figure 1: Example of spectrogram image of a whistler wave recorded at Akebono (EXOS-D)[6]](https://thumb-us.123doks.com/thumbv2/123dok_us/8912346.959980/2.595.308.527.554.681/figure-example-spectrogram-image-whistler-recorded-akebono-exos.webp)