Image Based Face Detection Using
Probabilistic Neural Network
K.A.A. Aziz1, N.M.Z. Hashim2, W. N. A. W. Mazlan2
1
Faculty of Engineering Technology, Universiti Teknikal Malaysia Melaka 2
Faculty of Electronics & Computer Engineering, Universiti Teknikal Malaysia Melaka
Abstract—This paper presents an image based face detection using probabilistic neural network. The purpose is to localize and extract the face region from the background that will be fed into the face recognition system for identification. General preprocessing approach was used for normalizing the image and a Probabilistic Neural Network (PNN) was used to distinguish between face and non-face images. Probabilistic neural networks can be used for classification problems. The performance of the PNN face detection system will be based on the detection rate, False Acceptance Rate (FAR) and the False Rejection Rate (FRR) criteria.
Keywords—Face Detection, Image Processing, Probabilistic Neural Network
I. INTRODUCTION
Face can be defined as the front part of head from the forehead to the chin [1]. Biometrics deals with the identification of individuals based on their biological or behavioral characteristics [2]. A number of biometrics have been proposed, researched and evaluated for identification applications. Face is one of the most acceptable biometrics because it is one of the most common methods of identification which humans use in their interactions [2]. Face detection is the first step in face recognition system. Face detection can be regarded as a more general case of face localization. In face localization, the task is to find the locations and sizes of a known number of faces. One of the methods for face detection is Neural Networks which lies under the category of image based approach. In this paper, we focus on optimizing the Probabilistic Neural Network for face detection. PNN is used to distinguish face and non-face images. The output of the network can be optimized by setting suitable values of the center and the spread of the PNN.
II. PROBABILISTIC NEURAL NETWORKS
Probabilistic neural networks can be used for classification problems. When an input is presented, the first layer computes distances from the input vector to the training input vectors and produces a vector whose elements indicate how close the
[image:2.612.320.573.454.612.2]input is to a training input. The second layer sums these contributions for each class of inputs to produce as its net output a vector of probabilities. Finally, a complete transfer function on the output of the second layer picks the maximum of these probabilities, and produces a 1 for that class and a 0 for the other classes. The architecture for this system is shown in Fig 1 [13].
Fig 1: Architecture of PNN [13]
Q = number of target pairs
It is assumed that there are Q input target vector pairs. Each target vector has K elements and one of these elements is 1 and the rest are 0. This means that each input vector is associated with one of K classes.
The first-layer input weights, IW1,1(net.IW{1,1}), are set to the transpose of the matrix formed from the Q training pairs, P'. When an input is presented, the || dist || box produces a vector whose elements indicate how close the input is to the vectors of the training set. These elements are multiplied, element by element, by the bias and sent to the radial basis transfer function. An input vector close to a training vector is represented by a number close to 1 in the output vector a1. If an input is close to several training vectors of a single class, it is represented by several elements of a1 that are close to 1 [13].
The second-layer weights, LW1,1(net.LW{2,1}), are set to the matrix T of target vectors. Each vector has a 1 only in the row associated with that particular class of input, and 0's elsewhere. Function ind2vec was used to create the proper vectors. The multiplication Ta1 sums the elements of a1 due to each of the K input classes. Finally, the second-layer transfer function, compete, produces a1 corresponding to the largest element of n2, and 0's elsewhere. Thus, the network classifies the input vector into a specific K class because that class has the maximum probability of being correct [13].
III. NETWORK TRAINING
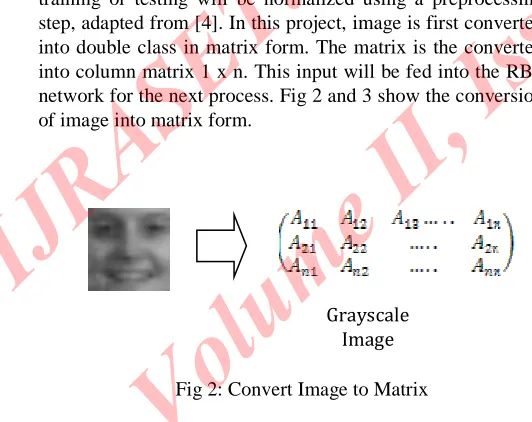
[image:3.612.23.289.474.685.2]The image that to be fed into the network whether for training or testing will be normalized using a preprocessing step, adapted from [4]. In this project, image is first converted into double class in matrix form. The matrix is the converted into column matrix 1 x n. This input will be fed into the RBF network for the next process. Fig 2 and 3 show the conversion of image into matrix form.
Fig 2: Convert Image to Matrix
Fig 3: Convert Matrix to Column Matrix
The network is trained using 2429 face data and 4548 non-face data from the CBCL (Center For Biological and Computation Learning) train datasets [5].
The simplest procedure for selecting the basis function centers ck is to set the center equal to the input vectors or a random subset of the input vectors from the training set but this is not an optimal procedure since it leads to the use of unnecessarily large number of basis function [6]. Broomhead et al. [8] suggested strategies for selecting RBF centers randomly from the training data. The centers of PNN can either be distributed uniformly within the region of input space for which there is data. In this paper we use K-means clustering. K-means clustering is one of the techniques that were used to find a set of centers where the technique is more accurately reflects the distribution of the data points [6]. It is used in research such as in [3] and [7]. In k-means clustering, the number of desired centers, K, must be decided in advance. In [11] the spread values are the same for all centers. In this paper, the value of vector that is the closest to all vectors in the cluster will be the spread value.
For the training, supervised learning is used where training patterns are provided to the RBFNN together with a teaching signal or target. As for the input of face will be given the value of 1 while the input of non-face will be given the value of 2.
IV. RESULTS
Table 1, Table 2, Fig 4 and Fig 5 shows the performance of the PNN face detection using 999 face data and 899 non-face data taken from the CBCL train datasets used as the test input. The system can detect 100% face and non-face using spread from 0.1 to 2.5. Table 2 and Fig 5 shows the FAR and FRR of the system. Spread 0.1 to 2.5 gives 0 FAR and FRR.
Matrix Form Column Matrix
Form
Matrix
Form Grayscale
Table I
Detection rate of PNN face detection with different spread setting
Spread Face Non-face
0.1 100 100
0.3 100 100
0.5 100 100
0.7 100 100
0.9 100 100
1 100 100
2 100 100
2.5 100 100
3 96.8969 98.8877
3.5 85.8859 97.7753
4 76.6767 96.3293
4.5 62.8629 97.6641
5 45.5455 98.4427
5.5 27.3273 99.2214
6 13.5135 99.6663
6.5 4.1041 100
7 0.6006 100
7.5 0 100
8 0 100
8.5 0 100
9 0 100
10 0 100
13 0 100
15 0 100
17 0 100
19 0 100
20 0 100
Fig 4: Detection performance on face & non-face with different spread
Table II
FAR and FRR of PNN Face Detection
Spread FAR FRR
0.1 0 0
0.3 0 0
0.5 0 0
0.7 0 0
0.9 0 0
1 0 0
2 0 0
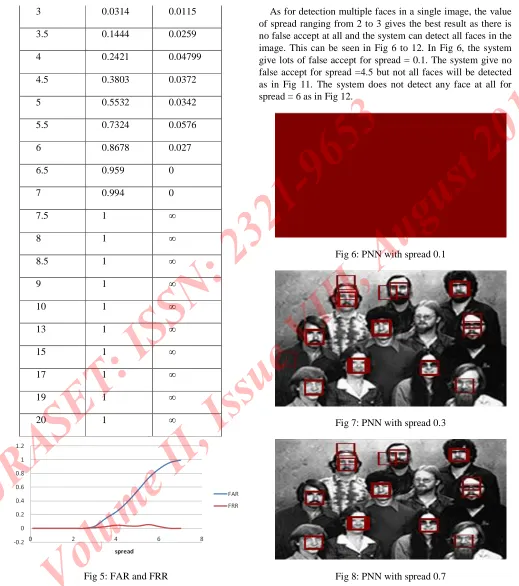
3 0.0314 0.0115
3.5 0.1444 0.0259
4 0.2421 0.04799
4.5 0.3803 0.0372
5 0.5532 0.0342
5.5 0.7324 0.0576
6 0.8678 0.027
6.5 0.959 0
7 0.994 0
7.5 1 ∞
8 1 ∞
8.5 1 ∞
9 1 ∞
10 1 ∞
13 1 ∞
15 1 ∞
17 1 ∞
19 1 ∞
20 1 ∞
Fig 5: FAR and FRR
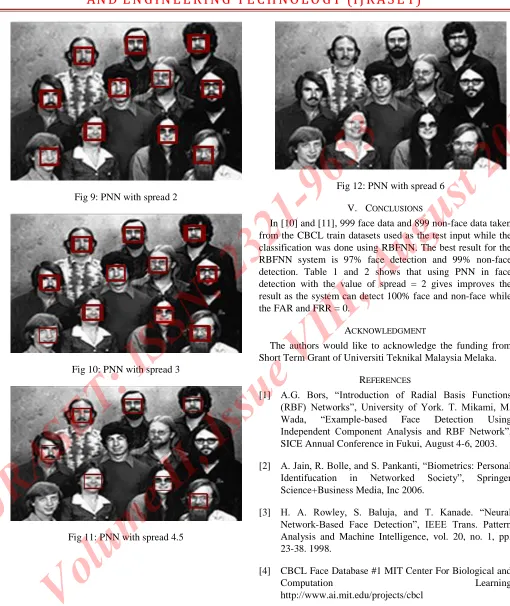
As for detection multiple faces in a single image, the value of spread ranging from 2 to 3 gives the best result as there is no false accept at all and the system can detect all faces in the image. This can be seen in Fig 6 to 12. In Fig 6, the system give lots of false accept for spread = 0.1. The system give no false accept for spread =4.5 but not all faces will be detected as in Fig 11. The system does not detect any face at all for spread = 6 as in Fig 12.
Fig 6: PNN with spread 0.1
[image:5.612.48.567.101.687.2]Fig 7: PNN with spread 0.3
Fig 9: PNN with spread 2
Fig 10: PNN with spread 3
[image:6.612.48.558.85.691.2]Fig 11: PNN with spread 4.5
Fig 12: PNN with spread 6
V. CONCLUSIONS
In [10] and [11], 999 face data and 899 non-face data taken from the CBCL train datasets used as the test input while the classification was done using RBFNN. The best result for the RBFNN system is 97% face detection and 99% non-face detection. Table 1 and 2 shows that using PNN in face detection with the value of spread = 2 gives improves the result as the system can detect 100% face and non-face while the FAR and FRR = 0.
ACKNOWLEDGMENT
The authors would like to acknowledge the funding from Short Term Grant of Universiti Teknikal Malaysia Melaka.
REFERENCES
[1] A.G. Bors, “Introduction of Radial Basis Functions
(RBF) Networks”, University of York. T. Mikami, M.
Wada, “Example-based Face Detection Using
Independent Component Analysis and RBF Network”, SICE Annual Conference in Fukui, August 4-6, 2003.
[2] A. Jain, R. Bolle, and S. Pankanti, “Biometrics: Personal Identifucation in Networked Society”, Springer Science+Business Media, Inc 2006.
[3] H. A. Rowley, S. Baluja, and T. Kanade. “Neural
Network-Based Face Detection”, IEEE Trans. Pattern Analysis and Machine Intelligence, vol. 20, no. 1, pp. 23-38. 1998.
[5] S.S. Abdullah, M.M. Idris, “A Short Course In Artificial
Neural Networks” 2008.
[6] M.J. Er, S. Wu, J. Lu, and H. L. Toh, “Face Recognition
With Radial Basis Function (RBF) Neural Networks”, IEEE Transactions On Neural Networks , Vol. 13, No. 3, May 2002.
[7] D.S. Broomhead and D. Lowe, Multivariable functional interpolation and adaptive networks, Complex Systems, vol. 2, pp 321-355.
[8] E. Hjelmas, and B. K. Low, “Face Detection: A Survey”
Academic Press, 2001.
[9] W. Kienzle, G. Bakir, M. Franz and B. Scholkopf: Face Detection - Efficient and Rank Deficient. In: Advances in Neural Information Processing Systems 17, pg. 673-680, 2005.
[10] K.A.A. Aziz, S.S. Abdullah and A.N.M. Johari. “Face Detection Using Radial Basis Functions Neural Networks With Fixed Spread”, International Journal of Computer Sciences and Engineering Systems, 2011.
[11] K.A.A. Aziz, S.S. Abdullah, R.A. Ramlee and A.N. Jahari. “Face Detection Using Radial Basis Function Neural Networks With Variance Spread Value”, The International Conference of Soft Computing and Pattern Recognition (SoCPaR 2009) Malacca, Malaysia, December 4-7, 2009.
[12] K.A.A. Aziz, R.A. Hamzah, S.D.I Damni, A.N.M. Johari and S.S. Abdullah. “Face Recognition Using Fixed Spread Radial Basis Function Neural Network For
Security System,”, Journal of Telecommunication, Electronic And Computer Engineering, 2011.
[13] H. Demuth and M. Beale. “Neural Network Toolbox”, The MathWorks, Inc.
[14] K.A.A. Aziz, R.A. Ramlee, S.I Samsudin and A.N.M. Johari. “The Effect Of Overlapping Spread Value For Radial Basis Function Neural Network In Face Detection”, Journal of Telecommunication, Electronic And Computer Engineering, 2010.
[15] R.A Hamzah, S.F.A. Ghani, A. Din and K.A.A. Aziz. “Visualization of image distortion on camera calibration for stereo vision application”, Control System, Computing and Engineering (ICCSCE), 2012.
[16] R.A. Ramlee, K. Azha and R.S.S. Singh. “Detecting Cholesterol Presence with Iris Recognition Algorithm”, Universiti Teknikal Malaysia Melaka (UTeM), Malaysia.
[17] R.A. Hamzah, S.F. Abd Ghani, A.F. Kadmin and K.A.A. Aziz. “A practical method for camera calibration in stereo vision mobile robot navigation”, Research and Development (SCOReD), 2012.
[18] R.A. Hamzah, K.A.A. Aziz, A.S.M. Shokri. “A pixel to
![Fig 1: Architecture of PNN [13]](https://thumb-us.123doks.com/thumbv2/123dok_us/8587463.862842/2.612.320.573.454.612/fig-architecture-of-pnn.webp)