© 2017, IRJET | Impact Factor value: 5.181 | ISO 9001:2008 Certified Journal
| Page 3204
Application of Earned Value Method and Delay Analysis on
Construction Project to Analyse Cost and Schedule
Rudresh L.
1, Shashank U. Vanakudari
21
P.G students, M. Tech, Department of Civil Engineering, Jain College of Engineering, Belagavi, Karnataka, India
2Assistant Professor, Department of Civil Engineering, Jain College of Engineering, Belagavi, Karnataka, India
---***---ABSTRACT
– In construction industry there are manyconfrontations and increasing day to day. Above all this confrontation a very important is to improve the performance of the project with reference to cost and schedule to overcome this confrontations. To achieve this one of the best tool is earned value methodology to analyse and measure performance of construction project. It is helpful in measuring progress and determining unfavourable issues. And delay analysis is a process of analysing the project delay, helps finding the root causes for the delay in project. Both earned value and delay analysis is carried out using Microsoft project software program. The main object of this project work is to measure the performance and analyse the construction project with respect to cost and schedule. For this project work a delayed construction project was selected as a case study to carryout analysis to know performance of construction project and to find the critical issues respect to cost and schedule and delay analysis to find the variance in duration and root causes for the delay in project.
Key Words:
Earned Value Management, Earned Value
Analysis (EVA), Delay Analysis, MS Project
1. INTRODUCTION
In an increasingly challenging world, the markets have an intense contest, customer satisfaction had increased the central pivot of many company of construction industry and they want to be successful. The fulfilment not only comes from the quality and performance but also through time and cost indices in construction. Now a days the environment and social issues are rising so, to minimize the wastage a good allocation of resources is important. Construction field is one of the most important sector in development of countries like India. This faces challenges day to day. Contribution from this field to growth of a country’s economy to a large extent. The construction project main issue with a project time and cost overturn. This caused by the various reasons, so results in project budget overturns and cannot complete the project in scheduled time. In spite of many decades of practice and academic attention project performance, remains problematic, verifiable evidence suggests that projects do not generally achieve the required scope, are frequently delay, and perform badly on quality of deliverables as well as on cost budgets.
In construction industry, delay is project beyond the completion date as stated in the contract agreement. It is
beyond the planned schedule and it is one of the common problems in construction projects. It is important to find the actual reasons or causes in project delay because to control the delay in project future and minimize delay in upcoming projects which results in cost over turn. As per PMBOK to determine the cost and schedule variation, the earned value management is one of the tools used.
In this project, my important target is to study earned value method as a monitoring and controlling tool to check the progress track. By doing this we get the proper costs and time related viewpoint of the project at the particular stage. In addition, can forecast that time required in the future completion of project and calculates the cost required for continuing the project in best planed pace. Also studying the common issues in construction project delay. If the project is not in planned pace. Finding the root causes for delay in project.
2. TERMINOLOGIES
2.1 Earned Value Management
Earned value management (EVM) is a method that is a combination of scope, schedule and resource measurements to help project performance and its progress. It is a widely used method of performance measurement for projects. EVM is valuable technique to find the real gains and losses on projects and helps in providing sort to balance profit/losses and minimize losses. It is a powerful tool to control concurrently cost and physical performance. The project managers and management can track possible areas that area susceptible to risk. They can create plans suitability. In short earned valve methodology takes care of problems through timely remedial action before they become too great to overcome.
2.2 Earned Value Parameters
Current fields that measures different features of earned value are the earned value fields. There are mainly 3 terms, which identify earned value concept.
© 2017, IRJET | Impact Factor value: 5.181 | ISO 9001:2008 Certified Journal
| Page 3205
Earned Value: EV or known as budgeted cost of workperformed indicates how much of a project or task/ activity budget should have spent, given the actual duration of the project or tasks/ activities date. It is also an approx. value of physical work actually completed.
Actual Cost: AC or known as actual cost work performed. Measures the actual cost that incurred to completion of project or task. During the completion process, Actual cost indicates the actual costs for work performed through the projects status date.
Fig.-1 General representation of EV, PV & AC in Graph.
I) Variances
Cost Variance:
Cost variance, (CV) is a comparison of budgeted cost of work performed, EV with actual cost, AC. It is calculated usingCV = EV – AC
A negative (-) cost variance means the project is over budget that is performing the work cost more than planned. The causes for this may be analysed and suitable right measures can be initialled to bring back the project on budget. When it happens, the project managers or team will know that costs is going over the planned budget.
A positive (+) cost variance means that the project progress is at cost less than planned budget. This good sign shows the project is progressing as planned.
Cost Variance (CV %): Cost variance (CV %) is a project
mathematically calculates CV% by CV Divided by EV and multiplied by the 100.CV % = CV / EV X 100
Schedule Variance:
Schedule variance (SV) is the comparison of quantity of work performed during a given period of time to what has scheduled to be performed. It is also represented in percentage (%). It is given bySV = EV – PV
A negative (-) schedule variance indicates the project is behind planned schedule, means took more time than planned to complete the work.
Also if a positive (+) schedule variance that the project is ahead of planned schedule, means took less time than planned to complete.
Schedule Variance (SV %): Schedule variance, (SV %) is
a project mathematically calculates CV% by SV Divided by PV and multiplied by the 100.SV % = SV / PV X 100
II) Performance Indices
a) Cost performance index (CPI):
Cost performance index (CPI is used to calculate the project cost to complete the project basis on performance to date.CPI = EV / AC
CPI > 1 (If CPI greater than 1 means that project is over budget)
CPI < 1 (If CPI lesser than 1 means that project is under budget)
CPI = 1 (If CPI equals to 1 means that project’s planned and actual costs are some)
b) Schedule performance index (SPI): Schedule performance index (SPI) is used to calculate the estimated time to complete the project based on the performance to date. It is given by:
SPI = EV / PV
SPI > 1 (If SPI greater than 1 means that project is ahead schedule)
SPI < 1 (If SPI lesser than 1 means that project is behind schedule)
SPI = 1 (If SPI equals to 1 means that project is on schedule)
III) Forecasting Indicators
a) Estimation at Completion (EAC): It is sum of actual
cost till date and the estimated cost for the other remaining task in project. It is given by.EAC = Actual Cost (AC) + Estimate to complete (ETC) OR
EAC = Budget at Completion / Cost Performance Index Based on the above formula the Microsoft project calculates the Estimate at Competition. It is baseline cost that the planned cost for a task in project, a resource for all allocated tasks or for activity to be performed by the resource on a task.
b) Estimation to complete (ETC): It is the difference between and Estimate at Completion (EAC) and budget at completion (BAC) or Actual cost. This is estimated additional cost to complete the project at any point time of project.
© 2017, IRJET | Impact Factor value: 5.181 | ISO 9001:2008 Certified Journal
| Page 3206
c) Variance at completion (VAC): It is the differencebetween Budget at completion (BAC) and Estimate at Completion (EAC). The value by which the project will be under or over budget.
VAC = BAC - EAC
3. METHODOLOGY
Fig.-2: Flowchart showing the methodology of this project work.
Firstly, the existing research, analysis study on earned value analysis, which have earlier done, are collected.
Secondly the collection of cost and schedule data of an real project which is to analysed under progress, so that earned value analysis can be made and conclusion can be given to the on/future of the project.
Thirdly, creating the project in MSP, entering the data collected about the project in the analysis software and defining the work breakdown structure (WBS).
Than it is to start tracking the project and keep a look on the progress of different task/activities in project.
The next approach is to run the analysis on a particular date, later by using the Microsoft Project software, the earned value analysis is carried out.
In this approach, follow progress report on different status dates. The report may contains crucial activities, activities in progress, budgeted and actual of cost and schedule.
In final approach giving suitable conclusion on the schedule and cost index obtained after earned value analysis and delay analysis from Microsoft Project software.
3.1 Creating a Project for Data Analysis
Data analysis can be done manual or digitally by using software program. In manual method the project management team or project control & monitoring staff analysis the data, but it is complex process there can be
human errors. So by using project analysing software tool like Microsoft project, primavera etc. the complex process can be simplified, accuracy in analysis is achieved.
3.2 MS Project
MSP is one of the project management software program. It is created, developed and marketed by Microsoft. It is designed to assist the project management team or managers in improving plan, resources assigning to tasks, tracking progress, budgets management, workloads analysis. In this project, the case study analysis is carried out using Microsoft project professional 2013 version.
The steps involved in the Microsoft project software for project earned valve analysis. The step are below,
1. Creating and initiation project 2. Creating project calendar
3. Entering task and its relationships 4. Defining work breakdown structure 5. Assign resources, its analysis and levelling 6. Progress Tracking
7. Earned value analysis 8. Publishing reports
4. CASE STUDY-DATA ANALYSIS AND
INTERPRETATION
The main intention of this case study is to analyse and study the earned value parameters and come to a conclusion.
4.1 Analysis of Tracking Project’s Progress Report
The details of tracking progress of complete project various tasks are executed till that status date.
On status date i.e. February 2017 the tracking project’s progress, showing 98 % complete of work in project. Whereas at this date project should have completely finished, but there was a delay. Therefore, from this tracking project’s progress it comes to know that project was behind the schedule and delay in project delivering.
From this progress tracking is can be concluded the project is running 2% behind the schedule. So it can be concluded that the project was delayed.
4.2 Analysis for Complete Construction Work
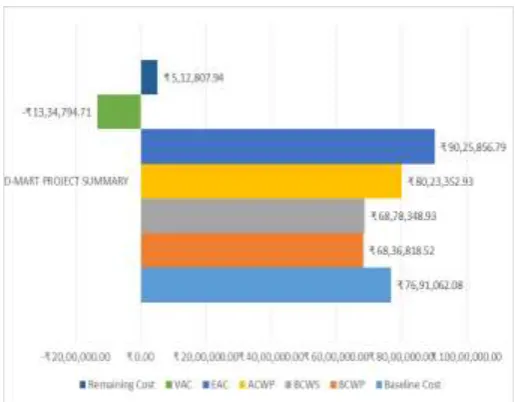
The Budget at competition (BAC) cost for various tasks of D-mart project was around Rs.76.9 lakhs.
© 2017, IRJET | Impact Factor value: 5.181 | ISO 9001:2008 Certified Journal
| Page 3207
Graph-1: Graphical representation of PV, EV & ACBy Earned value parameters interpretation, the CV around Rs.-11.86 lakhs & SV around Rs.-0.41 lakhs these values and CV% is -17% & SV% is -1%. These CV and SV values conclude at this project execution is behind the planned schedule and cost overturn.
Graph-2: Graphical representation of CV & SC The Cost performance index, (CPI) was 0.85 and Schedule performance index (SPI) was around 0.99. The value indicates this project is foregoing over planned cost and behind the planned.
Graph-3: Graphical representation of CPI and SPI The EAC cost may be Rs.90.02 lakhs. The foreseen value indicates the expected complete project cost
The VAC cost was around Rs.-13.34 lakhs. This foreseen value indicates cost overruns at this project completion.
The calculated ETC cost was around Rs.10.02 lakhs. This foreseen value indicates the additional required cost for completing the remaining work of the project.
Graph-4: Graphical representation of forecasting indices The contract agreement was item rate contract. The contractor intention was to complete the project in less amount than the contract agreement amount to make profit. So he spent less amount, but due to reasons mention in analysis part
[image:4.595.307.565.175.376.2]Above values it can be concluded that he did not complete the project in his planned budget and make much profit from this project.
Table -1: Details of Analysis on EVM parameters of construction work in project
Planned value Rs.6,878,348.93
Earned value Rs.6,836,818.52
Actual costs Rs.8,023,352.93
Cost performance index 0.85 Schedule performance index 0.99
Cost variances Rs.-1,186,534.41
Cost variances % -17%
Schedule variances Rs.- 41,530.42 Schedule variances % -1%
© 2017, IRJET | Impact Factor value: 5.181 | ISO 9001:2008 Certified Journal
| Page 3208
4.3 Delay Analysis for Complete Construction
Tasks
The obtained data from the MSP analysis indicating the below values.
The tracking of project’s progress at particular status date February 2017 is 98% completed.
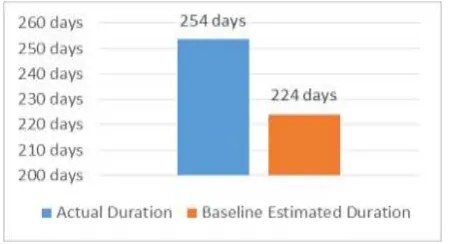
The planned duration for execution of work was 224.13 days (7.5months), but actual duration took for execution was 258.59 days (8.5 months). At current status date the project was 253.65days only 4.94 days left to complete the remaining works.
The planned schedule date was 15/6/16 to 28/1/17 but actual schedule was 15/6/16 to 04/03/17. The start variances of project is 0 days and finish variances of project 34.46 days.
Graph-5: Graphical representation for variances in duration of project.
[image:5.595.50.275.327.449.2]By above values it concludes that the project was started on schedule date, but project is delayed by 34.46 days (nearly a month).
Table - 2: Details of Analysis on delay in construction work in project
Planned duration for
project 224.13 days
Actual duration to complete
project 258.59days
Remaining duration left to
complete remaining work 4.49 days
Planed dates 15/6/16 to 28/1/17
Actual dates 15/6/16 to 04/03/17
Start variance 0 days
Finish variance 34.46 days
4.5 Main Causes for the Project Delay Client and contractor related causes
1. Late in receiving and approving drawing/designs
and inadequate details and unclear doubts in
drawing and also Delay in getting permits and orders from higher authorities.
2. Change design and plan in drawing during
construction.
3. Ineffective planning and scheduling of activities in
project and Poor communication and coordination of engineers and labours
4. Delay by other contractors work in project i.e.
(pre-fabricated structure erection and MEP contractors) and sub-contractor (waterproofing).
5. The structural work contractor spent less money
than budgeted cost for execution of works. Material, Equipment and Labour related causes
1. Delay in material and equipment delivery and procurement i.e. (m-sand, p-sand, AAC blocks, clay bricks, and formwork and its other materials, earthwork machines)
2. Equipment and machines breakdowns and shortage 3. Low productivity and efficiency of equipment and
shortage and low skill of labours
4. Improper communication and coordination between labours
5. Improper payments for labours by their head i.e.
(maestri, sub-contractor)
6. Depend on the fresher’s and less experienced
personal to bear project. External factors related causes
1. Extreme rainfall effecting on construction, Delay
causes by the services from utilities i.e. (electricity and water)
2. Delay in getting permission from city Municipal Corporation.
3. Site location and resource availability, High quality
of work execution.
4. Demonetization effected on contractors financial
payments for labour and staff.
4.6 Effects of Delay on Project
1. Delay in project effected the time and cost overrun of construction work in project
2. Disputes between the contractor and client project
managers.
3. The contract agreement was item rate contract. The
contractor wanted to complete the project in less cost than the contract agreement. Therefore, he spent less amount than budgeted amount but due to reasons mention above. He could not complete the project in his planned budget. He could not make much profit from this project.
4.7 Minimizing and Controlling Duration and Cost in Project
1. Adopt 24 hours per day working calendar. They
© 2017, IRJET | Impact Factor value: 5.181 | ISO 9001:2008 Certified Journal
| Page 3209
2. Clear coordination and communication between
client, contractor and with labour the delay in this project could be controlled.
3. Correct emphasis on past experience, considering the practical experience in past for delay causing issues. The experienced personnel’s and staff should be appointed. They can easily handle and control delay by their past experience. Also Include more skilled labours
4. The contractor should have accurately estimated
the budgeted cost at beginning considering all circumstances. He would have reached his financial intention on this project.
5. During bad weather conditions alternative working period should be planned,
6. Proper project planning and scheduling by
considering and studying all factors effecting work could reduce the delay and increase best results.
7. Improved site management and supervision with staff the executing can be monitored and delay could be minimized. In addition, motivating labour and workers to complete task on schedule.
8. Plan and analysing the requirement in details.
5. CONCLUSION
This analysis enables project management or mangers to know the information about project and its every activity. Therefore, the project team can be aware of which parameters are causing more schedule and cost overturn. The client, owner and contractor will get information regarding the cost overrun and schedule overturn.
The analysis calculates the variances in project and foresees the variance of every activity at the completion of project. The notable factor of this analysis is it will track right values of the work progress. After obtaining data from the analysis, the project team and managers can discuss and indicate the notable issues and they can take corrective actions.
By using this software program, the delay analysis of project can be evaluated. Therefore, the project managers and team may get to know the status of the project and can minimize and control the ongoing project delay or in future project.
The project performance can be measured by using earned value analysis with respect to cost and duration.
It helps in finding the project status. The project execution related to schedule, project execution as per the original planned schedule.
By Case study analysis, the project actual financial return investment for the work done is found out. This EVM gives better understanding related to cash flow.
The final completion time of project along with loss/profit to the contractor is predicted.
Case study enables that monitoring the progress of work in terms of cost and schedule can be carried out effectively.
By delay analysis on project helps in finding, the actual tasks that resulted in causing delay in project and identifying the root cause for the delay in execution of tasks.
The project team and managers can discuss and indicate the notable issues and they can take corrective actions.
Case study enables that delay analysis is useful for project managers and team to know the status of the project. Moreover, can minimize and control the ongoing project delay or in future project.
REFERENCE
[1] Aditi Dinakar, Delay Analysis in Construction Project, ISSN: 2250-2459, Vol. 4, Issue 5, May 2014
[2] Ankur Verma, K.K. Pathak, R K Dixit, Earned Value Analysis of Contruction Project at Rashtriya Sanskrit Sansthan, Bhopal, ISSN: 2319-875, Vol. 3, Issue 4, April 2014
[3] Antony Prasanth M A and K Thirumalai Raja, Project Performance Evaluation by Earned Value Method, ISSN 2319-8753, Vol 3, Issue 1, Feb 2014.
[4] Anuj Bubey, Earned Value Analysis for a Construction Project, ISSN: 0976-6316, Vol. 6, Issue 6, June 2015, pp. 53-66
[5] Mohd Faris Khamidi, Waris Ali Khan and Arazi Idrus, The Cost Monitoring of Construction Projects through Earned Value Analysis, Vol 4, 2011
[6] MSP Foundation Reference guide, CADD Centre Training Services Private Limited, August 2015
[7] Radhika Gupta, Earned value Management System, ISSN-2349-4409, Vol 2, Issue 4, July 2014, pp 160-165.
[8] Sandhya Suresh and Ganapathy Ramaswamy N, Analysis of Project Performance Using Earned Value Analysis, Vol. 4, Issue 4, April 2015
[9] Shatanand Patil, Akshay Patil and Prof. Pramila Chavan, Earned value management for Tracking Project Progress, ISSN: 2248-9622, Vol. 2, Issue 3, May 2012, pp. 1026-1029
[10] Sunil Ganpat Mahadik and Pankaj P. Bhangale, Study