© 2016, IRJET | Impact Factor value: 4.45 | ISO 9001:2008 Certified Journal | Page 623
TUBERCULOSIS SCREENING USING DIGITAL IMAGE PROCESSING
TECHNIQUES
Chetan C. Pawar
1, Dr. S. R. Ganorkar
21PG student, Dept. of E &Tc Engineering, Sinhgad College of engineering, Maharashtra, India
2Professor, Dept. of E &Tc Engineering, Sinhgad College of engineering, Maharashtra, India
---***---Abstract -
Tuberculosis (TB) is caused by a bacteria called bacillus Mycobacterium tuberculosis. The bacteria mainly attack the lungs. There are several antibiotics available in market to heal TB, still mortality rate of TB is high. Tuberculosis is most prevalent in India. India has approximately two million people infected by Tuberculosis. India has the highest number of TB affected people according to World Health Organization (WHO) statistics. When left undiagnosed mortality rates of patient with tuberculosis are high. So there is need of accurate tuberculosis screening system. In this paper, screening system of tuberculosis using chest radiograph is presented. First the lung region is extracted using k-means clustering segmentation segmentation method. For this lung region, a set of texture features and shape features are computed which qualify the X-rays to be classified as normal or abnormal using Euclidean distance a classifier. The performance of this system is measured on datasets collected by the tuberculosis control program of health department in the United States.Key Words: euclidean distance, k-means clustering,
tuberculosis (TB)
1. INTRODUCTION
TB is most prevalent in India. India has approximately two million people infected by Tuberculosis. India has the highest number of TB affected people according to World Health Organization (WHO) statistics. Tuberculosis disease is triggered by the bacillus mycobacterium tuberculosis which mainly affect the lungs. People with HIV/AIDS are more prone to tuberculosis. When left undiagnosed mortality rate of tuberculosis is high. So there is need of accurate tuberculosis screening system. There are many antibiotics are available for the treatment of tuberculosis but when TB left untreated mortality rate goes high.in clinical test healing rate of TB is not so high, it is around 90%.
A patient’s chest x ray is one of the important TB screening tool. In this paper, screening system of tuberculosis using chest radiograph is presented. Implemented screening
system uses digital image processing techniques to identify normal and abnormal chest x-rays. Motivation behind this project is mass screening of large population that is not feasible manually. K-means clustering segmentation is used to segment the lung part from chest radiograph. Shape and texture feature extraction method is used to extract shape and texture features from segmented lung field and Euclidean distance classification is used to classify chest x-ray into normal or abnormal x-x-ray. System shows 70% accuracy on test image dataset and 70% specificity whereas sensitivity of system is 70% on test image dataset. The paper is divided in to 6 sections. Section 2 describe the literature review of the implemented system. Section 3 presents the information about image dataset used in the experiments. In Section 4, detailed discussion of lung segmentation, feature extraction and classification is presented. A results of practical experiments follows in Section 5. Finally, conclusion concludes the paper.
2. LITERATURE REVIEW
There are four important areas by which we can review
© 2016, IRJET | Impact Factor value: 4.45 | ISO 9001:2008 Certified Journal | Page 624 segmentation scheme developed in this paper is robust and
accurate but can still be improved in several ways, notably by adding rules to handle exceptional situations. Research paper related to finding out abnormalities in chest x- ray using local texture analysis published by B. van Ginneken, S. Katsuragawa, B. ter Haar Romeny, K. Doi, in 2002. In this paper method is presented to find out abnormalities in chest radiographs which are sum into an overall abnormality score. Main aim of method was to find out abnormal texture pattern in chest x-ray. The scheme starts with segmentation of the lung fields, using image appearance models. The segmentation is used to divide the lung fields from background region. [5]
S. Candemir, K. Palaniappan, and Y. Akgul (2014) published research paper related to graph cut image segmentation algorithm with the help of energy minimization approximation”. In this paper, author describes a methodology for adaptive parameter learning to improve the segmentation performance using a multi-class classifier approach. Author demonstrated the performance of the system within graph cut segmentation framework. The approaches in literature modulate the regularization parameter using a single feature or a heuristic combination of a few features. Author model the characteristics of the image regions with feature vectors which includes haar feature for edge, local binary patter for texture and hessian for shape information of local regions. Therefore this approach characterizes the image regions better than using single feature. The simple structure of the system allows to incorporate alternative features such as Scale Invariant Feature Transform which is one of the best performing feature descriptors among local descriptors. [2]
3.
DATA
For this experiment, CXR set of Montgomery County (MC) is used. The MC set, is collected within the tuberculosis control program of the Department of Health and Human Services of Montgomery County (MC), Maryland. The MC set consist of total 138 posteroanterior chest x-rays, out of which 80 Chest x-rays are normal and 58 Chest x-rays are abnormal with TB symptoms. All images of the MC set are in 12-bit grayscale, captured with an X-ray machine. The abnormal Chest x-rays consist of a wide range of TB-related abnormalities, including effusions.
4.METHOD
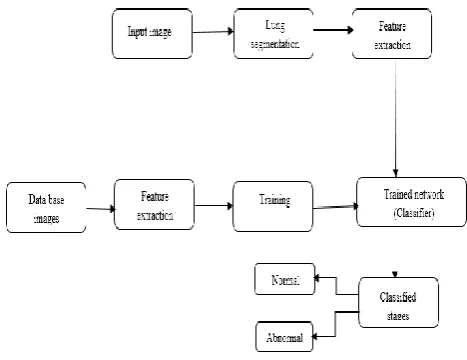
This section defines the implemented methods for lung segmentation, shape and texture feature computation, and classification. Fig. 1 shows the architecture of system with
the different image processing units, which are described by the subsections in detail.
Fig -1: Architecture of system
Lung part of Chest X-ray input image is first segmented using k-means clustering segmentation method. Texture features of the segmented lung field is extracted using grey level co-occurrence matrix. Shape features are also computed for segmented image. Feature vector is then applied to trained Euclidean distance classifier. Trained classifier classifies the chest X-ray as normal or abnormal depending on input image feature vector. Classifier training is done by applying the images stored in image database. Image database consist of normal and abnormal chest X-ray images.
4.1 K-means clustering Segmentation method
K-means clustering segmentation method depends on clusters to segment the input test image that is chest x-ray of patient. K-means clustering method can be defined as follows:
1) Create four clusters of size (m*n)*1, where m and n are number of row and column of input test image.
2) Find out centroid for each cluster.
3) Find out four differences between the input test image pixel and four centroids, choose the minimum difference for the next stage calculations.
4) According to results of step 3 fill out four clusters with input test image pixels.
5) Reshape the clusters into size m*n, .choose the final cluster as segmented image
[image:2.595.312.546.140.320.2]© 2016, IRJET | Impact Factor value: 4.45 | ISO 9001:2008 Certified Journal | Page 625
4.2 Features
To find out abnormality in the segmented Lung field, shape and texture features are extracted from lung field. First grey level co-occurrence matrix of input chest x ray is calculated. Feature vector is formed from grey level co-occurrence matrix of input chest X ray. Four features are extracted from input image namely energy, homogeneity, correlation, contrast. Shape features of segmented image is also computed like area, major axis length etc.
1) Contrast: contrast defines the intensity contrast between a pixel and its immediate neighbour over the entire chest x-ray test image. Contrast is given by
(1)
Where and denote row and column index of an image, denote the probability of pixel having index
( , )
2) Correlation: correlation defines how a pixel is correlated to its immediate neighbour over the entire chest x-ray test image. Correlation is given by
(2)
Where and denotes row and column pixels mean intensity respectively and and denotes the standard deviation
3) Energy :energy is a measure of uniformity in the range [0,1] & it is given by
(3)
4) Homogeneity : homogeneity is a measure of the closeness of the distribution of pixel elements in the co-occurrence matrix to the GLCM diagonal & it is given by
(4)
5) Area: This is a Scalar feature; area shows the actual number of pixels in the region.
6) Eccentricity: The eccentricity use to find out exact shape of connected element object. An ellipse is actually a circle whose eccentricity is 0, while an ellipse whose eccentricity of a line segment is 1.
7) Major Axis Length: This is a scalar defines the shape measurement of the ellipse.
8) Minor Axis Length: This is a scalar defines the shape measurement of the ellipse.
9) Perimeter: This parameter define the perimeter of connected region.
10) Solidity: solidity is a Scalar specifying the proportion of the pixels in the connected region. Computed as Area/Convex Area.
4.3 Classification
Euclidean distance classifier is simple classification method compare to support vector machine classifier. Euclidean distance classifier find out Euclidean distance between target vector and feature vector to classify normal and abnormal chest x-rays. Euclidean distance classifier classify input test image as normal and abnormal chest x-ray as follows:
1) Form a training matrix of size 10*22 by extracting 10 shape and texture feature from 22 images and calculate the mean of training matrix
2) Form a query feature vector of input test image by extracting the feature of test image and calculate the mean of feature vector.
3) Find out Euclidean distance between mean of query feature vector and mean of training matrix by using following formula
(5)
Where q: mean of query feature vector and : mean of training matrix
4) Find out maximum Euclidean distance and compare it with threshold
5) If maximum Euclidean distance is less than threshold then input test image classified as normal image otherwise abnormal image
5. RESULTS
This section presents a practical evaluation of work. Segmentation, feature extraction and classification results are presented in this section.
5.1 Segmentation Results
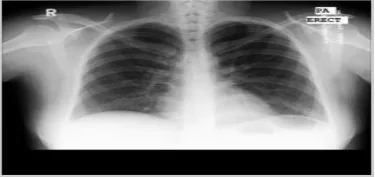
[image:3.595.309.497.638.726.2]Figure 2 shows chest x-ray test image.
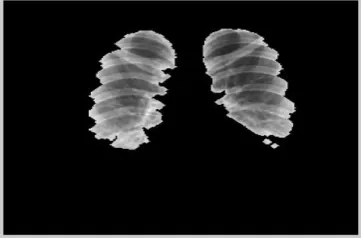
© 2016, IRJET | Impact Factor value: 4.45 | ISO 9001:2008 Certified Journal | Page 626 . Segmentation result of k-means clustering segmentation
has been displayed in figure 3.
Fig- 3: k-means clustering lung segmentation result of fig. 2
[image:4.595.37.218.155.274.2]5.2 Feature extraction Results
[image:4.595.308.504.176.302.2]Table 1 shows the feature extraction result of fig.3
Table 1: Feature extraction result of fig. 3
Feature descriptors
Value
Energy 0.0039
Contrast 1186.1
Correlation -0.0786
Homogeneity 0.0688
Area 10903.0
Eccentricity 0.6976
Major Axis Length
180.59
Minor Axis Length:
129.38
Perimeter 439.22
Solidity 0.6268
5.3 Classification Results
Fig 4 shows normal chest X- ray and fig 5 shows its classification result.10 normal and 12 abnormal chest x- ray images are used to train the classifiers
Fig-4: Normal Chest x-ray image
Fig-5: classification result of fig 4
5.4 Performance
Systems performance measured using 3 parameters namely accuracy, sensitivity, specificity.
Sensitivity: if the test is highly sensitive and the test result is negative, you can be nearly sure that they don’t have disease.
*100 (6)
Specificity: if the test result for a highly specific test is positive, you can be nearly sure that they actually have the disease.
*100 (7)
Accuracy: accuracy is given
*100 (8)
[image:4.595.34.559.296.787.2]© 2016, IRJET | Impact Factor value: 4.45 | ISO 9001:2008 Certified Journal | Page 627
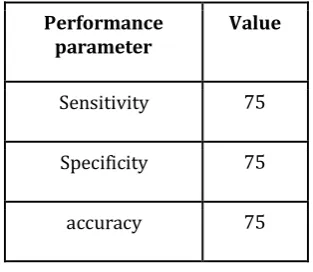
Table -2: Performance parameters of system
Performance parameter
Value
Sensitivity 75
Specificity 75
accuracy 75
6. CONCLUSION
Tuberculosis screening system using chest radiograph consist of three main stages namely is k-means clustering segmentation, shape and texture feature extraction and support vector machine classification. System shows 75% accuracy on test image dataset and 75 % specificity whereas sensitivity of system is 75% on test image dataset.
ACKNOWLEDGEMENT
I express my thanks to my project guide Dr.S.R.Ganorkar, Department of Electronics & Telecommunication Engineering, Sinhgad College of engg. Pune for his valuable guidance and continuous support.
REFERENCES
[1] Jaeger S, Karargyris A, Candemir S, Folio L, Siegelman J, Callaghan FM, Xue Z, Palaniappan K, Singh R K, Antani S K. “Automatic tuberculosis screening using chest radiographs”.IEEE Trans Med Imaging 2014 .PMID: 24108713
[2] S. Candemir, K. Palaniappan, and Y. Akgul, “Multi-class regularization parameter learning for graph cut image segmentation,” in Proc. Int. Symp. Biomed. Imag., 2013, pp. 1473–1476
[3] S. Candemir, S. Jaeger, K. Palaniappan, S. Antani, and G. Thoma, “Graph-cut based automatic lung boundary detection in chest radiographs,” in Proc. IEEE Healthcare Technol. Conf.: Translat. Eng.Health Med., 2012, pp. 31–34
[4] R. Shen, I. Cheng, and A. Basu, “A hybrid knowledge-guided detection technique for screening of infectious pulmonary tuberculosis from chest radiographs,” IEEE Trans. Biomed. Eng., vol. 57, no. 11, pp. 2646–
2656, Nov. 2010
[5] B. van Ginneken, S. Katsuragawa, B. ter Haar Romeny, K. Doi, andM. Viergever, “Automatic detection of abnormalities in chest radiographs using local texture analysis,” IEEE Trans. Med. Imag., vol. 21, no. 2, pp. 139–149, Feb. 2002
[6] B. Van Ginneken, B. ter HaarRomeny, and M. Viergever, “Computer aided diagnosis in chest radiography: A survey,” IEEE Trans. Med.Imag., vol. 20, no. 12, pp. 1228–1241, Dec. 2001
[7] R. Gonzalez, R. Woods, “Digital Image Processing 3rd ed” , Pearson publication,2004
[8] S. Jayraman ,“Digital Image Processing” , Tata McGraw-Hill Education,2006
[9] Stephen J. Chapman ,”MATLAB programming for engineers”, Tata McGraw-Hill Education, 2007
[10] Danilo Šćepanović, “introduction to MATLAB
programming lecture notes”,2010
[11] J. Burrill, C. Williams, G. Bain, G. Conder, A. Hine, and
R. Misra, “Tuberculosis: A radiologic review,”
Radiographics, vol. 27, no. 5, pp. 1255–1273, 2007
[12] Liwei Wang , Yan Zhang ,Jufu Feng “On the Euclidean
Distance of Images” Med. Phys., vol. 27, no. 10, pp. 2445–2455, 2000
[13] Nameirakpam Dhanachandra“Image Segmentation
using K-means Clustering Algorithm”
Procedia Computer Science 54 (2015) 764 – 771