Published online April 2, 2013 (http:// www.sciencepublishinggroup.com/j/ajrs) doi: 10.11648/j.ajrs.20130102.15
A visual mining based fame work for classification
accuracy estimation
Arun, Pattathal Vijayakumar
MaulanaAzad National Institute of Technology- Bhopal, India
Email address:
[email protected] (Arun, Pattathal Vijayakumar)
To cite this article:
Arun, Pattathal Vijayakumar. A Visual Mining Based Fame Work for Classification Accuracy Estimation. American Journal of Re-mote Sensing. Vol. 1, No. 2, 2013, pp. 47-52. doi: 10.11648/j.ajrs.20130102.15
Abstract:
Classification techniques have been widely used in different remote sensing applications and correct classi-fication of mixed pixels is a tedious task. The problem is more complex with the classiclassi-fication of hyperspectral data and requires a thorough analysis. Traditional approaches adopt various statistical parameters, however does not facilitate effective visualisation. Data mining tools are proving very helpful in the classification process. We propose a visual mining based frame work for accuracy assessment of classification techniques using open source tools such as WEKA and PREFUSE. These tools in integration can provide an efficient approach for getting information about improvements in the classification accuracy and helps in refining training data set. We have illustrated frame work for investigating the effects of various resampling methods on classification accuracy and found that bilinear (BL) is best suited for preserv-ing radiometric characteristics. We have also investigated the optimal number of folds required for effective analysis of LISS4 images.Keywords:
Data mining, Remote sensing, Decision tree, Image classification, Visualization, WEKA, PREFUSE1. Introduction
Remote sensing techniques are used extensively in land use- land cover analyses in a way that will greatly im-prove our predictive capability and bring societal benefits to people around the globe. The economic feasibility and flexibility of earth observation data sharing principles have made the data increasingly available to the global community. Classification, which involves assigning of pixels to respective classes, is the most commonly used operation for extracting land use information (Zhang et al, 2009). The accuracy of pixel based classification ap-proaches are affected by the increase in resolution of im-ages and object based approaches are devised for improv-ing the performance (Vapnik et al., 1998). Literature sug-gests a great deal of advanced methodologies for the pur-pose (Nghi et al., 2008). Supervised classification tech-niques involve manually assigning class labels to image pixels which are later used as training sets to classify the actual dataset.
The efficiency of supervised classification approaches depend on the training samples hence it is important to measure the seperability of training sets. Effective analy-sis of signature seperability and mixed pixel effects are
required for accurate classification. Literature reveals many statistical measures in this regard among which error matrix is the most commonly used strategy. It ex-presses several characteristics about classification accura-cy like omission (exclusion) and commission (inclusion) errors, over all accuracy etc (Lillesand et al, 2004). How-ever these methods do not help to visualize the data and also do not reveal the problematic classes and its pixel wise measures effectively. In recent years, despite conti-nuous inventions in establishing and testing new classifi-cation methods, classificlassifi-cation performance is still not showing demonstrable improvement (Witten & Frank, 2005; Wilkinson, 2005). Thus, visualization of classifica-tion process seems to be the only way to minimize mis-classification effects and visual data mining tools are found to be effective in this context (Lu & Weng, 2007).
and PREFUSE interfaces. We have used the strategy to investigate the effects of resampling techniques on classi-fication accuracy.
2. Experiment
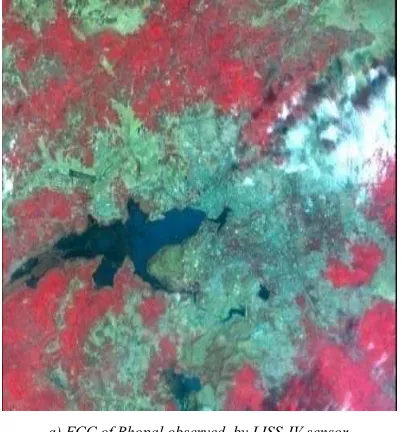
In this work, the WEKA (Bouckaert, 2010), an open source data mining package, and the PREFUSE, a tree visualization package (Keim et al, 2003; Durbha, 2005) plug-in, have been used for investigations. The LISS-IV image of Bhopal city in India, acquired in the month of November 2011 was used for the analyses. The FCC of this image is shown in (Figure 1(a)). The investigations have been done for the area near MANIT campus located within latitude: 23° 07 to 23° 54 N, longitude: 77° 12 to 77° 40 E and is shown in (Figure 1(b)).
a) FCC of Bhopal observed by LISS-IV sensor
b) Zoomed view of FCC of study area observed by LISS IV sensor
Figure 1. Study area.
3. Methodology
Framework for effective analysis and visualisation of training sets has been developed in Java using WEKA and PREFUSE. WEKA has been used for analysing clas-sification results and PREFUSE for effective visualisation. The subset images are split in to three constituent bands in TIFF format and pixel values are exported to WEKA compatible (.ARFF) format. PREFUSE visualization tree plug-in is integrated with WEKA and the size of JVM is adjusted automatically to handle large datasets. The J48 decision tree classifier of PREFUSE tool is adopted for analysis as it provides effective visualisation. The data stored in .ARFF format is processed using WEKA to ob-tain different classification accuracy parameters such as confusion matrix, producer accuracy, over all accuracy etc. The PREFUSE interface is then used to generate de-cision tree and incorrectly classified pixels are hig-hlighted to provide effective visualisation.
The frame work has been used to investigate the effect of different resampling techniques on classification accu-racies. Ten different land use classes namely built-up, water, vegetation, agriculture, grass, wetland, playground, swimming-pool, road, and unclassified were decided on the basis of site visit. The LISS-IV image subset of study area was classified in to these land use classes using su-pervised and unsusu-pervised classifiers without georefe-rencing the image. Effect of different resampling tech-niques such Nearest Neighbour (NN), Bi Linear (BL) and Cubic Convolution (CC) methods on the classification accuracy was investigated. Statistical parameters as well as decision tree of all datasets were compared for the in-vestigation. Schematic representation of the methodology adopted is summarized in (Figure 2).
Figure 2. Methodology flow chart.
4. Results and Discussions
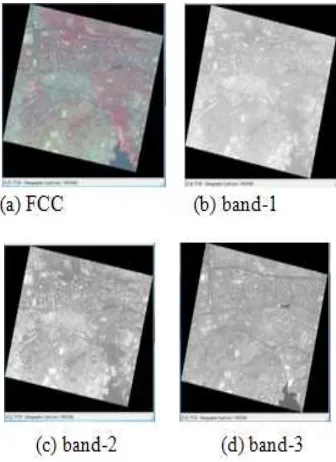
effect of resampling techniques on classification accuracy. The unregistered image FCC and its constituent bands used for the classifier training are shown in Figure 3(a) to (d).
Figure 3. FCC and bands of Unregistered Dataset
To investigate the effect of different resampling tech-niques, training dataset has been geo-coded in to three different sets using NN, BL and CC methods. Successive-ly each dataset has been split into its three bands nameSuccessive-ly, band-1, 2 & 3. Figure 4 (a)-(d) shows NN dataset and the corresponding three bands as an example.
Figure 4. Geo-coded image data set using NN resampling
The visualization facilitated by decision trees provides a better understanding of the classification context and help to better identify misclassifications. It provides ef-fective evaluation of signature seperability and mixed pixels. Tree also provides an idea of the band that better distinguishes specific classes. Figures 5 & 6 show the path and zooming facilities of PREFUSE tree visualizer respectively.
Figure 5. PREFUSE tree visualizer showing path
Figure 6. PREFUSE tree visualizer showing facility of zooming
Investigation revealed that the geocoreection process affects classification accuracy. Different statistical para-meters shows highest accuracy in the case of BL method resampled image dataset as compared the others (NN & CC). Kappa statistic measures the agreement of
Table1. Comparison among results of all the four datasets
Parameters Unregistered NN BL CC
No: % No: % No: % No: %
Correctly classified instances
401364 99.9731 414857 99.981 417366 99.9957 418471 99.9673
Incorrectly classified instances
108 0.0269 79 0.019 18 0.0043 137 0.0327
Total no: of
instances 401472 414936 417384 418608
Kappa statistic 0.9996 0.9997 0.9999 0.9996
Mean absolute
error 0.0001 0 0 0.0001
Root mean
square error 0.007 0.006 0.0028 0.0079
Relative
absolute error 0.0517% 0.0335% 0.0086% 0.0635%
Root relative squared error
2.6916% 2.2111% 1.1207% 2.8793%
Coverage of Cases (0.95 level)
99.9786% 99.9853% 99.9964% 99.9742%
Mean relative region size (0.95 level)
10.0019% 10.0025% 10.0004% 10.0029%
The results have shown that resampling processes change the pixel value and classification statistics consi-derably. It is advisable that geo-coding of image should be done after classification. Bi linear method can be adopted if the geocoding is essential before classification. The NN resampling method which was expected to per-form better has been out perper-formed by BL. This is be-cause NN resampling method when applied to a scene with abrupt radiometric variation and narrow features introduces radiometric more alternations compared to BL. CC as expected smoothens the image and hence severely
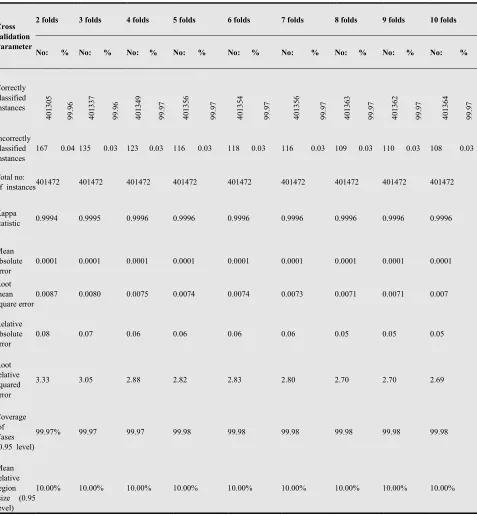
Table 2. Parameters of Cross validation for 2 to 10 folds
Cross validation Parameter
2 folds 3 folds 4 folds 5 folds 6 folds 7 folds 8 folds 9 folds 10 folds
No: % No: % No: % No: % No: % No: % No: % No: % No: %
Correctly classified instances 4 0 1 3 0 5 9 9 .9 6 4 0 1 3 3 7 9 9 .9 6 4 0 1 3 4 9 9 9 .9 7 4 0 1 3 5 6 9 9 .9 7 4 0 1 3 5 4 9 9 .9 7 4 0 1 3 5 6 9 9 .9 7 4 0 1 3 6 3 9 9 .9 7 4 0 1 3 6 2 9 9 .9 7 4 0 1 3 6 4 9 9 .9 7 Incorrectly classified instances
167 0.04 135 0.03 123 0.03 116 0.03 118 0.03 116 0.03 109 0.03 110 0.03 108 0.03
Total no:
of instances 401472 401472 401472 401472 401472 401472 401472 401472 401472
Kappa
statistic 0.9994 0.9995 0.9996 0.9996 0.9996 0.9996 0.9996 0.9996 0.9996
Mean absolute error
0.0001 0.0001 0.0001 0.0001 0.0001 0.0001 0.0001 0.0001 0.0001
Root mean square error
0.0087 0.0080 0.0075 0.0074 0.0074 0.0073 0.0071 0.0071 0.007
Relative absolute error
0.08 0.07 0.06 0.06 0.06 0.06 0.05 0.05 0.05
Root relative squared error
3.33 3.05 2.88 2.82 2.83 2.80 2.70 2.70 2.69
Coverage of Cases (0.95 level)
99.97% 99.97 99.97 99.98 99.98 99.98 99.98 99.98 99.98
Mean relative region size (0.95 level)
10.00% 10.00% 10.00% 10.00% 10.00% 10.00% 10.00% 10.00% 10.00%
5. Conclusion
We have discussed an efficient framework for analyz-ing the classification accuracy of trainanalyz-ing data sets. Pro-posed approach integrates image mining techniques with classification for effective visualization using WEKA and PREFUSE open source tools. Framework has been adopted to investigate the effects of resampling on
the processing accuracy. Framework can be further used to investigate the classification accuracies of hyperspec-tral data.
References
[1] Bouckaert R. R., Frank E., Hall M. A., Holmes G., Pfa-hringer B., Reutemann P., Witten I. H., 2010, “WEKA— Experiences with a Java Open-Source Project,” Journal of Machine Learning Research, vol.11, pp. 2533-2541.
[2] Durbha S.S., King R.L., 2005, “Semantics-enabled framework for knowledge discovery from Earth observa-tion data archives,” IEEE Transacobserva-tion on Geoscience and Remote Sensing, vol.43, pp. 2563–2572.
[3] Keim D.A., Panse C., Sips M., 2003, “PixelMaps: A New Visual Data Mining Approach for Analyzing Large Spatial Data Sets,” Proceedings of 3rd IEEE Int’l Conf. Data Mining (ICDM 03), IEEE CS Press, pp. 565-568.
[4] Lillesand Thomas M, Kiefer Ralph W, Chipman Jonathan W, 2004, “Remote Sensing and Image Interpretation,” John Wiley & Sons (Asia), Singapore.
[5] Liu Y, Salvendy G., 2007 “Design and evaluation of vi-sualization support to facilitate decision trees
classifica-tion,” International Journal of Human- Computer Studies, vol.65, pp. 95–110.
[6] Lu D, Weng Q, 2007, “A survey of image classification methods and techniques for improving classification per-formance,” International Journal of Remote Sensing, vol. 28, pp. 823–870.
[7] Nghi Dang Huu, Mai Luong Chi., “An object-oriented classification techniques for high resolution satellite im-agery,” GeoInformatics for Spatial-Infrastructure Devel-opment in Earth and Allied Sciences (GIS-IDEAS), pp. 230-240, 2008.
[8] Vapnik V, “Statistical Learning Theory,” Wiley Publishers Inc. New York, pp.230-240, 1998.
[9] Wilkinson G.G., 2005, “Results and implications of a study of fifteen years of satellite image classification ex-periments,” IEEE Transactions on Geoscience and Remote Sensing vol. 43, pp. 433–440.
[10] Witten I.H., and Frank E, 2005, “Data Mining: Practical Machine Learning Tools and Techniques,” Morgan Kauf-mann, San Francisco, CA, pp.120-134.