METHODOLOGY
Increased accuracy of starch granule
type quantification using mixture distributions
Emi Tanaka
1,4*, Jean‑Phillippe F. Ral
2, Sean Li
2, Raj Gaire
2, Colin R. Cavanagh
3, Brian R. Cullis
1and Alex Whan
2Abstract
Background: The proportion of granule types in wheat starch is an important characteristic that can affect its functionality. It is widely accepted that granule types are either large, disc‑shaped A‑type granules or small, spherical B‑type granules. Additionally, there are some reports of the tiny C‑type granules. The differences between these gran‑ ule types are due to its carbohydrate composition and crystallinity which is highly, but not perfectly, correlated with the granule size. A majority of the studies that have considered granule types analyse them based on a size threshold rather than chemical composition. This is understandable due to the expense of separating starch into different types. While the use of a size threshold to classify granule type is a low‑cost measure, this results in misclassification. We pre‑ sent an alternative, statistical method to quantify the proportion of granule types by a fit of the mixture distribution, along with an R package, a web based app and a video tutorial for how to use the web app to enable its straightfor‑ ward application.
Results: Our results show that the reliability of the genotypic effects increase approximately 60% using the propor‑ tions of the A‑type and B‑type granule estimated by the mixture distribution over the standard size‑threshold meas‑ ure. Although there was a marginal drop in reliability for C‑type granules. The latter is likely due to the low observed genetic variance for C‑type granules.
Conclusions: The determination of the proportion of granule types from size‑distribution is better achieved by using the mixing probabilities from the fit of the mixture distribution rather than using a size‑threshold.
Keywords: Starch, Granule type, Mastersizer, Mixture distribution
© The Author(s) 2017. This article is distributed under the terms of the Creative Commons Attribution 4.0 International License (http://creativecommons.org/licenses/by/4.0/), which permits unrestricted use, distribution, and reproduction in any medium, provided you give appropriate credit to the original author(s) and the source, provide a link to the Creative Commons license, and indicate if changes were made. The Creative Commons Public Domain Dedication waiver (http://creativecommons.org/ publicdomain/zero/1.0/) applies to the data made available in this article, unless otherwise stated.
Background
Starch derived from the endosperm of cereal grains is the major source of carbohydrate in the human diet and has many functional uses in food and non-food industries. Starch is made up of two distinct components, amy-lopectin (70–80% dry biomass) and amylose, which are organised into water-insoluble granules during synthe-sis (for a review see [1]). Distributions of granule size in cereal endosperm are accepted to be bimodal and clas-sified as large A-type granules and small B-type granules [2–7]. There are reports that verify the existence of an additional type—tiny C-type granules [8–10] but some classify these as B-type. These C-type granules are less
studied. A-type granules begin to form in the first week after anthesis. B-type granules form in the second week after anthesis while C-type granules form at the end of the third week after anthesis [10–12].
In starch storage organs, as well as photosynthetic tis-sue, many enzymes involved in transitory starch biosyn-thesis have been shown to influence the size of starch granules. These include ADP-glucose pyrophosphory-lase [13], starch branching enzyme [14], limit dextrinase [15], starch phosphorylase [16], glucan, water dikinase [17] and starch synthases [18, 19]. In photosynthetic tis-sue of the model Arabidopsis thaliana starch synthase III and IV have been implicated in the initiation of tran-sitory starch granules [20, 21], however, the means by which granules are initiated in cereal endosperm remains unclear. As an essential element of starch production, increased understanding of granule initiation may allow
Open Access
*Correspondence: [email protected]
4 School of Mathematics and Statistics, University of Sydney, Carslaw F07,
Sydney 2006, Australia
identification of new pathways towards increasing cereal yield.
Perhaps more immediately, an ability to produce cereal starch with optimised starch granule type and size would be of great use in industrial applications of starch. An increased proportion of A-type granules is preferable in many industrial settings, since smaller B-type granules are easily lost during starch isolation. A-type and B-type granules have different chemical and structural prop-erties, notably, A-type and B-type granule have a disc and spherical shapes respectively [7] with different pro-portions of amylose and amylopectin [22]. These differ-ences give rise to altered functional properties such as an increase in dough elasticity due to a higher proportion of B-type granules [23].
To study the proportion of granule types in a starch sample, it is therefore necessary to be able to discriminate between granule types. A true quantification of granule types would be based on separation of granules based on composition or origin [24]; however, such method is expensive although granule size measurement is rela-tively straightforward. Before 1990, most studies meas-ured granule sizes with a Coulter Counter, which were unable to accurately measure sizes below 3 μm [8]. More recently granule size distributions have been measured with Mastersizer particle size analysers, or have manually identified granule types using light microscopy.
Granule size distributions of wheat starch show clear multi-modality, either bimodal [4, 5] or trimodal [9]. The differences may be due to the environment, such as water regime, temperature and light intensity [25–29] and in some cases due to a limitation in equipment [8]. Further-more, differences between cultivars have a major role in influencing starch granule size distribution [2, 30].
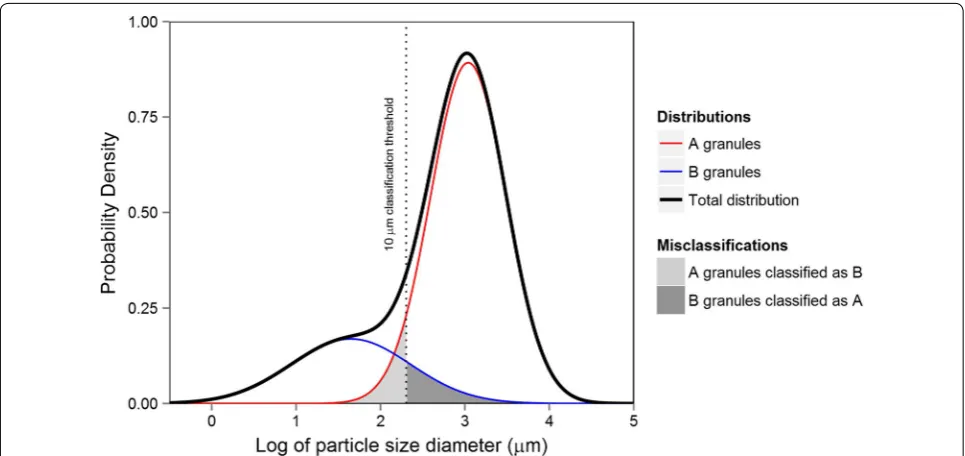
Starch granule types are highly correlated with their size, as such almost all studies use a size-threshold for classification: large, small and tiny granule sizes cor-respond to A-type, B-type and C-type granules respec-tively. The threshold used to classify the granule types differs from study to study, however, most use the diam-eter size of 9.9–10 μm as a cutoff between A-type and B-type granules [2–4, 6, 7, 9] while some [8, 11] use 15–15.9 μm. The boundary between B-type and C-type granules is less well defined with some [8, 11] using 5–5.3 μm and others [9] using 2.8 μm. While this form of classification is straightforward, unless the size distri-butions of granule types are completely distinct and non-overlapping, misclassification of granule types will occur (see Fig. 1). Such misclassification may be detrimental for the accurate identification of sources of variation for granule type in cereal starch.
We present an alternative method to accurately quan-tify the proportions of each granule type in a starch sus-pension by use of a mixture distribution. We show this
Fig. 1 A theoretical distribution of starch granule sizes showing misclassification by size threshold discrimination. Two underlying distributions of A‑type (red line) and B‑type (blue line) granule types add togethe r to give the observed granule size distribution (black line). Where a size discrimi‑ nation threshold is used, such as μm (vertical dotted line), a proportion of granules will be misclassified. In this example, the lower tail of the A‑type distribution is misclassified as B‑type (light grey shading) and the upper tail of the B‑type distribution is misclassified as A‑type (dark grey shading).
‘mixture measure’ provides a significant difference to the ‘size-threshold measure’, and represents an important step forward in accurately estimating granule popula-tions in cereal starch.
Methods
Plant material and starch extraction
A field trial of a diverse wheat population was grown in Yanco, NSW, Australia in 2009 as part of the GRDC CSP112 project. Grain from 155 genotypes was milled, and 5 g of flour was weighed into 50 ml screw capped tubes. The flour was treated with 50 ml of 1% (w/v) sodium metabisulphite in 0.05M NaCl for 30 min rotat-ing on an ELMI RM-2L Intelli-mixer (Riga, Latvia) at 40 rpm. The resulting batter was ultra-sonicated in a Soni-clean160T (Thebarton, SA, Australia) water bath for 1 minute and passed through 200 μm nylon mesh. The fil-trate was sonicated a further 1 min. The sonicated filfil-trate was then centrifuged at 5100 rpm in a Sigma 4K15 bench top centrifuge and swing out head Nr. 11150. The pellet was resuspended in 20 ml of 90% Percoll (Life Technolo-gies) and centrifuged at 1500 rpm. The upper phases were poured off the primary starch pellet which was washed three times with Milli-Q water. The isolated starch was resuspended in 5 ml of Milli-Q water, frozen and freeze dried for particle size analysis.
Experimental design
Field, milling, extraction and measurement phases of the experiment were conducted according to p-rep designs [31], which were generated using DiGGer [32]. Briefly, in total 864 granule size measurements were taken from 224 extractions from the flour of 155 genotypes. More details are explained in Additional file 1.
Particle size measurement
The freeze dried starch was suspended in Milli-Q water, briefly vortexed and starch granule size distributions were determined using a Mastersizer 2000 particle size analyser (Malvern, UK), which measures the percent-age of the total starch volume for a given diameter size interval.
Quantification of granule‑type population
We compared two approaches to produce summary statistics for the different granule types. The first (size-threshold measure) was the typical method that previ-ous studies have used, and the second (mixture-measure) involved extracting information from fitted mixture dis-tributions. To the best of our knowledge, the statistics from the latter method have not been used previously to characterise starch granule types.
Method 1: size‑threshold measure
To determine suitable thresholds by which to classify the granule types, we fitted a mixture of three Gauss-ian distribution to the log of the particle size diameter averaged over all samples (Fig. 2). For the threshold between B-type and C-type granules we took the inter-section between the fitted individual Gaussian distribu-tions with the smallest and second smallest mean (C-type and B-type granules, respectively). This threshold was 0.969 μm. This cut-off is smaller than previous stud-ies where C-type granules have been considered, which is likely due to differences in environmental conditions, as well as differences between genotypes. The intersec-tion between fits for A-type and B-type granules was at 11.48 μm. Because it is common practice in previ-ous literature to use a threshold of 10 μm, and that was close to the intersection between the distributions we had identified, we chose to use 10 μm as the boundary between A-type and B-type granules. In summary, we used the thresholds (in μm) of ≤0.954993, [0.954993, 10)
and ≥10 to define C-type, B-type and A-type granules
respectively.
Method 2: mixture‑measure
Because it is the structural and the chemical composi-tion, as well as spatio-temporal origins, that separates the granules into different types rather than size alone, we implemented an alternative method to draw descriptive statistics for the granule types. The plot of the particle
−4 −2 0 2 4 6 8
0.
00
.1
0.2
0.3
0.
40
.5
0.6
Log of particle size diameter (µm)
Probability Density
diameter size for most genotypes shows a clear trimodal distribution. This distribution appears to be a mixture of three log-normal distributions and thus a mixture of three Gaussian distribution was fitted to the log of par-ticle diameter size for each sample. We interpreted the mixing weights of the three individual component distri-butions as the proportions of each granule type for the corresponding sample.
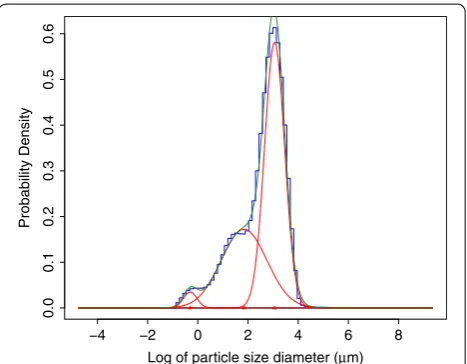
There are several statistical packages available for fit-ting Gaussian mixture distributions. We chose to use mixdist [33] for the R statistical computing environ-ment [34] because it accepts data input formatted as a frequency table (as is output by the Mastersizer soft-ware), and is freely available. An example of the fit from mixdist is given in Fig. 3.
All the fits were checked by visual inspection to assure all the fitted distributions matched the data. Of the 864 particle size measurements, 30 appeared to have a quad-modal distribution and two extraction had a better fit with a mixture of five Gaussian distributions (Fig. 3). These additional distributions were assumed to be due to starch polymerisation or aggregation during measure-ment. The remaining 96.2% of measurements were well fitted with a mixture of three Gaussian distributions. There were no samples that appeared to have less than three components.
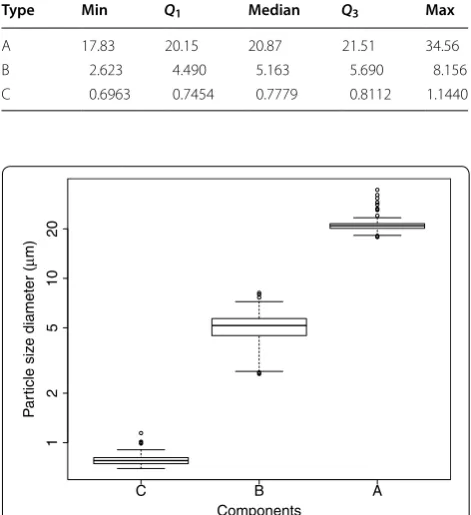
The three distributions were assigned as C-type, B-type and A-type granules according to increasing size. Table 1 and Fig. 4 show the five number summary and the box plot of the mean of each component respectively. All components appear to belong to the correct type with no overlap of the means between different types and we observe small variation for the mean of each compo-nents. Furthermore, the mean components of A-type and B-type are consistent with previous studies (e.g. [5] reports the peak values of 4.8–6.1 μm for B-type and 21.7–23.9 μm for A-type). We interpreted the mixing
weights 100× as the percentage of the total volume for each granule type.
Software package
To enable straightforward application of this approach, we have written an R package and web based application, granular. The source code and guide is available at http://doi.org/10.5281/zenodo.344633 and an instance of the web app is hosted at http://shiny.csiro.au/granular/.
Table 1 Five number summary of the mean of each com-ponent of the fitted mixture distribution
Type Min Q1 Median Q3 Max
A 17.83 20.15 20.87 21.51 34.56
B 2.623 4.490 5.163 5.690 8.156
C 0.6963 0.7454 0.7779 0.8112 1.1440
Log of particle size diameter (µm)
Probability Density
−1 0 1 2 3 4 5 6
0.
00
.1
0.2
0.3
0.4
0.5
0.6
0 2 4 6
0.
00
.1
0.2
0.3
0.4
0.5
Log of particle size diameter (µm)
Probability Density
a b
Fig. 3 The example fits of the mixture of four or five Gaussian distributions to the log of the particle diameter size
C B A
12
51
02
0
Components
Pa
rticle si
ze
diameter
(
µ
m)
The web app allows users to upload starch granule data in a pre-defined format (example data can be found on the site), define peaks interactively and download tabular and graphical output.
Results
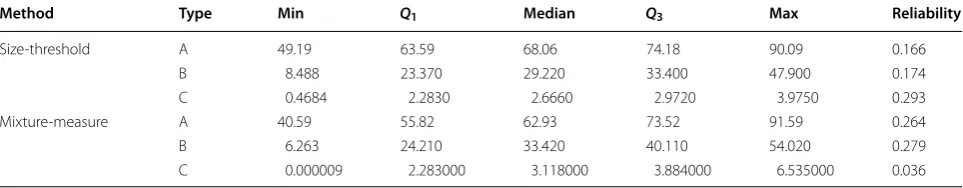
Table 2 shows the five number summary of the per-centage of the total starch volume for each granule type according to the size-threshold measure and the mixture-measure. Summary from both methods appear close but performing a t test for the mean difference of the percent-ages show that there is a significant difference between the two methods (p value <2.2×10⁻¹⁶). Most samples
contain a large volume of A-type (which is consistent with previous studies) and the least volume of C-type.
A more accurate estimate of the phenotypic trait will no doubt improve the accuracy of the genotypic effects should there be any underlying genetic mechanism for the phenotypic trait. The accuracy of the prediction of the genotypic effects can be evaluated by the reliability as defined in [35]. Specifically, we fit a linear mixed model to each estimate of the proportion of the granule-type for the prediction of the genotypic effect taking into account appropriate blocking terms. Reliability is calculated as the squared correlation between the estimated genotypic effect and its true value. Further details of the model and reliability calculation are outlined in Additional file 1. The mean-genotype reliability for each combination of gran-ule type and proportion estimation method is reported in Table 2. We observe a 60% increase in reliability using the mixture measure over the size-threshold measure for A-type and B-type granules, although notably, there is an 88% decrease for C-type granules.
Discussion
Different composition of the wheat starch gives rise to different utilisation and suitability for various industrial purposes. Wheat starch is composed mostly of A-type and B-type granules in addition to small amounts of
C-type granules. The high correlation of these granule types with the particle size makes the use of particle size distribution as a convenient surrogate for the expensive isolation of the granule types. Majority of studies indeed use size distribution to derive further properties about the granule types, however, the classification of granule types is almost exclusively conducted by a simplistic size-threshold method.
We observed that there was typically a tri-modal dis-tribution for the (log of) particle size that was well fitted by a mixture of three Gaussian distribution. The mixing weights associated with the fit of this distribution serves as a better estimation of the proportion of granule types. This was reflected in the observation of a significantly higher reliability for A-type and B-type granules for the mixture measure than the conventional size-threshold measure, although we note this was not the case for C-type granule. The reason for the latter may be due to factors such as the lower machine precision for distribu-tion of smaller particle sizes or the size-threshold meas-ure incorrectly classifying the smaller B-type granules as C-type granules when the B-type granule may be a more highly heritable trait. The latter is indeed supported by the small genetic variance associated for C-type granule as seen in Additional file 1.
One huge disadvantage of the size-threshold meas-ure is that a threshold must be specified for the classi-fication of the granule types. There is no consensus for this threshold across the literature and rather our data suggest variability for an appropriate threshold of each sample, probably owing to different genotype-environ-ment interaction. On the contrary, the mixture-meas-ure does not require specification of a threshold for the classification of the granule types and additionally pro-vides standard errors associated with the estimate of the proportions.
The mixture-measure may be sensitive to the initial values of the parameters and the users should be wary to visually check the fit of the distribution.
Table 2 Five number summary of the percentage of the total starch volume and mean-genotype reliability for each size-type by method
Method Type Min Q1 Median Q3 Max Reliability
Size‑threshold A 49.19 63.59 68.06 74.18 90.09 0.166
B 8.488 23.370 29.220 33.400 47.900 0.174
C 0.4684 2.2830 2.6660 2.9720 3.9750 0.293
Mixture‑measure A 40.59 55.82 62.93 73.52 91.59 0.264
B 6.263 24.210 33.420 40.110 54.020 0.279
Conclusion
We advocate the use of the mixture-measure over the size-threshold measure as a more accurate estimate of the A-type and B-type granule population in starch samples. Our experimental data shows a significant dif-ference between the two measures and it is clear the size-threshold measure would likely over-estimate or under-estimate the population size of the granule-types with such a rigid classification of the granule-types.
Authors’ contributions
JPFR and CRC developed and tested the phenotyping system and conceived the study, participated in its design and coordination, provided plant material. AW helped to draft the manuscript and prepare the data and scripts for public availability. AW, SL and RG developed the application. ET wrote the manuscript and analysed the data. ET and BC developed the method. All authors read and approved the final manuscript.
Author details
1 School of Mathematics and Applied Statistics, University of Wollongong,
Northfields Ave, Wollongong 2522, Australia. 2 CSIRO Agriculture and Food,
1600 Clunies Ross Street, Canberra 2601, Australia. 3 Bayer CropScience Pty
Ltd, Seeds, Technologiepark 38, 9052 Zwijnaarde (Gent), Belgium. 4 School
of Mathematics and Statistics, University of Sydney, Carslaw F07, Sydney 2006, Australia.
Acknowlegements
Thanks to Daniel Tolhurst and Alison Smith for useful discussions.
Competing interests
The authors declare that they have no competing interests.
Availability of data and materials
The data set and the accompanying scripts for the analysis are available at http://doi.org/10.5281/zenodo.344635.
Consent for publication Not applicable
Funding Not applicable.
Ethics approval and consent to participate Not applicable.
Publisher’s Note
Springer Nature remains neutral with regard to jurisdictional claims in pub‑ lished maps and institutional affiliations.
Received: 1 March 2017 Accepted: 27 November 2017
References
1. Ball SG, Morell MK. From bacterial glygogen to starch: under‑ standing the biogenesis of the plant starch granule. Annu Rev Plant Biol. 2003;54(1):207–33. https://doi.org/10.1146/annurev. arplant.54.031902.134927.
Additional file
Additional file 1. Experimental design and statistical analysis.
2. Dengate H, Meredith P. Variation in size distribution of starch granules from wheat grain. J Cereal Sci. 1984;2(2):83–90. https://doi.org/10.1016/ S0733‑5210(84)80021‑1.
3. Stoddard FL. Survey of starch particle‑size distribution in wheat and related species. Cereal Chem. 1999;76(1):145–9. https://doi.org/10.1094/ CCHEM.1999.76.1.145.
4. Li W, Yan S, Yin Y, Li Y, Liang T, Gu F, Dai Z, Wang Z. Comparison of starch granule size distribution between hard and soft wheat cultivars in Eastern China. Agric Sci China. 2008;7(8):907–14. https://doi.org/10.1016/ S1671‑2927(08)60129‑7.
5. Ni Y, Wang Z, Yin Y, Li W, Yan S, Cai T. Starch granule size distribu‑ tion in wheat grain in relation to phosphorus fertilization. J Agric Sci. 2011;150(01):45–52. https://doi.org/10.1017/S0021859611000475. 6. Feng N, He Z, Zhang Y, Xia X, Zhang Y. QTL mapping of starch granule
size in common wheat using recombinant inbred lines derived from a PH82‑2/Neixiang 188 cross. Crop J. 2013;1(2):166–71. https://doi. org/10.1016/j.cj.2013.07.003.
7. Zeng J, Gao H, Li G. Functional properties of wheat starch with different particle size distribution. J Sci Food Agric. 2014;94(1):57–62. https://doi. org/10.1002/jsfa.6186.
8. Bechtel DB, Zayas I, Kaleikau L, Pomeranz Y. Size‑distribution of wheat starch granules during endosperm development. Cereal Chem. 1990;67(1):59–63.
9. Raeker MÖ, Gaines CS, Finney PL, Donelson T. Granule size distribution and chemical composition of starches from 12 soft wheat cultivars. Cereal Chem. 1998;75(5):721–8. https://doi.org/10.1094/CCHEM.1998.75.5.721. 10. Zhang C, Jiang D, Liu F, Cai J, Dai T, Cao W. Starch granules size distribu‑
tion in superior and inferior grains of wheat is related to enzyme activities and their gene expressions during grain filling. J Cereal Sci. 2010;51(2):226–33. https://doi.org/10.1016/j.jcs.2009.12.002.
11. Bechtel DB, Wilson JD. Amyloplast formation and starch granule develop‑ ment in hard red winter wheat. Cereal Chem. 2003;80(2):175–83. https:// doi.org/10.1094/CCHEM.2003.80.2.175.
12. Yong‑an Y, Jun‑cang Q, Wei‑hua L, Lian‑pu C, Zi‑bu W. Formation and developmental characteristics of A‑ and B‑type starch granules in wheat endosperm. J Integr Agric. 2012;11(1):73–81. https://doi.org/10.1016/ S1671‑2927(12)60784‑6.
13. Lloyd JR, Springer F, Buléon A, Müller‑Röber B, Willmitzer L, Kossmann J. The in uence of alterations in ADP‑glucose pyrophosphorylase activities on starch structure and composition in potato tubers. Planta. 1999;209(2):230–8. https://doi.org/10.1007/s004250050627.
14. Li JH, Guiltinan MJ, Thompson DB. Mutation of the maize sbe1a and ae genes alters morphology and physical behavior of wx‑type endosperm starch granules. Carbohydr Res. 2007;342(17):2619–27. https://doi. org/10.1016/j.carres.2007.07.019.
15. Stahl Y, Coates S, Bryce JH, Morris PC. Antisense downregulation of the barley limit dextrinase inhibitor modulates starch granule size distribution, starch composition and amylopectin structure. Plant J. 2004;39(4):599–611. https://doi.org/10.1111/j.1365‑313X.2004.02159.x. 16. Dauvillée D, Chochois V, Steup M, Haebel S, Eckermann N, Ritte G, Ral
JP, Colleoni C, Hicks G, Wattebled F, Deschamps P, D’Hulst C, Liénard L, Cournac L, Putaux JL, Dupeyre D, Ball SG. Plastidial phosphorylase is required for normal starch synthesis in Chlamydomonas reinhardtii. Plant J. 2006;48(2):274–85. https://doi.org/10.1111/j.1365‑313X.2006.02870.x. 17. Mahlow S, Hejazi M, Kuhnert F, Garz A, Brust H, Baumann O, Fettke J.
Phosphorylation of transitory starch by alpha‑glucan, water dikinase during starch turnover affects the surface properties and morphol‑ ogy of starch granules. New Phytol. 2014;203(2):495–507. https://doi. org/10.1111/nph.12801.
18. Szydlowski N, Ragel P, Hennen‑Bierwagen TA, Planchot V, Myers AM, Mérida A, D’Hulst C, Wattebled F. Integrated functions among multiple starch synthases determine both amylopectin chain length and branch linkage location in Arabidopsis leaf starch. J Exp Bot. 2011;62(13):4547–59. https://doi.org/10.1093/jxb/err172.
19. Mcmaugh SJ, Thistleton JL, Anschaw E, Luo J, Konik‑Rose C, Wang H, Huang M, Larroque O, Regina A, Jobling SA, Morell MK, Li Z. Suppres‑ sion of starch synthase I expression affects the granule morphology and granule size and fine structure of starch in wheat endosperm. J Exp Bot. 2014;65(8):2189–201. https://doi.org/10.1093/jxb/eru095.
• We accept pre-submission inquiries
• Our selector tool helps you to find the most relevant journal • We provide round the clock customer support
• Convenient online submission • Thorough peer review
• Inclusion in PubMed and all major indexing services • Maximum visibility for your research
Submit your manuscript at www.biomedcentral.com/submit
Submit your next manuscript to BioMed Central
and we will help you at every step:
A. Starch granule initiation in Arabidopsis requires the presence of either class IV or class III starch synthases. Plant Cell. 2009;21(8):2443–57. https:// doi.org/10.1105/tpc.109.066522.
21. Crumpton‑Taylor M, Pike M, Lu KJ, Hylton CM, Feil R, Eicke S, Lunn JE, Zeeman SC, Smith AM. Starch synthase 4 is essential for coordination of starch granule formation with chloroplast division during Arabidopsis leaf expansion. New Phytol. 2013;200(4):1064–75. https://doi.org/10.1111/ nph.12455.
22. Shinde SV, Nelson JE, Huber KC. Soft wheat starch pasting behavior in relation to A‑ and B‑type granule content and composition. Cereal Chem. 2003;80(1):91–8. https://doi.org/10.1094/CCHEM.2003.80.1.91.
23. Soh HN, Sissons MJ, Turner MA. Effect of starch granule size distribution and elevated amylose content on durum dough rheology and spaghetti cooking quality. Cereal Chem. 2006;83(5):513–9. https://doi.org/10.1094/ CC‑83‑0513.
24. Peng M, Gao M, Hucl P, Chibbar RN. Separation and characterization of A‑ and B‑type starch granules in wheat endosperm. Cereal Chem. 1999;76(3):375–9. https://doi.org/10.1094/CCHEM.1999.76.3.375. 25. Dai Z. Starch granule size distribution in grains at different positions on
the spike of wheat (Triticum aestivum L.). Starch ‑ Stärke 2009;61(10):582– 589 . https://doi.org/10.1002/star.200800112.
26. Dai Z, Yin Y, Wang Z. Starch granule size distribution from seven wheat cultivars under different water regimes. Cereal Chem. 2009;86(1):82–7. https://doi.org/10.1094/CCHEM‑86‑1‑0082.
27. Li W, Yan S, Yin Y, Wang Z. Starch granule size distribution in wheat grain in relation to shading after anthesis. J Agric Sci. 2010;148(2):183–9. https://doi.org/10.1017/S0021859609990554.
28. Edwards MA, Osborne BG, Henry RJ. Puroindoline genotype, starch granule size distribution and milling quality of wheat. J Cereal Sci. 2010;52(2):314–20. https://doi.org/10.1016/j.jcs.2010.05.015. 29. Zhang T, Wang Z, Yin Y, Cai R, Yan S, Li W. Starch content and gran‑
ule size distribution in grains of wheat in relation to post‑anthesis water deficits. J Agron Crop Sci. 2010;196(1):1–8. https://doi. org/10.1111/j.1439‑037X.2009.00388.x.
30. Simkova D, Lachman J, Hamouz K, Vokal B. Effect of cultivar, location and year on total starch, amylose, phosphorus content and starch grain size of high starch potato cultivars for food and industrial process‑ ing. Food Chem. 2013;141(4):3872–80. https://doi.org/10.1016/j. foodchem.2013.06.080.
31. Cullis BR, Smith AB, Coombes NE. On the design of early generation vari‑ ety trials with correlated data. J Agric Biol Environ Stat. 2006;11(4):381–93. https://doi.org/10.1198/108571106X154443.
32. Coombes NE. The reactive TABU search for efficient correlated experi‑ mental designs. Ph.D. thesis, Liverpool John Moores University (2002) 33. Macdonald P. mixdist: finite mixture distribution models. R package ver‑
sion 0.5‑4 (2012).
34. R Development Core Team. R: a language and environment for statistical computing. R Foundation for Statistical Computing (2008).