M E T H O D O L O G Y
Open Access
Normalization using ploidy and genomic DNA
copy number allows absolute quantification of
transcripts, proteins and metabolites in cells
Hiroshi Shimada
1*, Takeshi Obayashi
2, Naoki Takahashi
3, Minami Matsui
3, Atsushi Sakamoto
1Abstract
Background:Quantification of transcripts, proteins, or metabolites is straightforward when the factor used to normalize these values remains constant between samples. However, normalization factors often vary among samples and thus must be developed for each new analytical method.
Results:We demonstrate quantification of transcript and protein levels in Arabidopsis based on genomic DNA copy number. We extracted total nucleic acid from 3-week-old rosette leaves of wild-type Arabidopsis and the pale-green/dwarf mutant,abc4, and quantified the number of transcripts by quantitative reverse-transcription PCR using genomic DNA copy number and ploidy (as determined by cytometry) for normalization. Our data indicated that normalization using genes commonly employed as references resulted in inaccuracies in transcript levels of the genesRBC-LandRBC-S(encoding the large and small subunits, respectively, of ribulose 1,5-bisphosphate carboxylase/oxygenase) in wild type and mutant. Normalization using genomic DNA copy number and ploidy, however, appropriately showed that theRBC-LandRBC-S transcript levels per cell in the mutant were significantly lower than that in wild type. Furthermore, quantification revealed that a cell of a 3-week-old wild-type Arabidopsis rosette leaf had an average of 7.5 × 10³transcripts ofRBC-L, 9.9 × 10³transcripts ofRBC-S, and 1.4 × 10⁶ 18S rRNA. We similarly analyzed the accumulation of RBC-L and LHCP (light-harvesting chlorophylla/bprotein) in wild type and mutant based on ploidy and genomic DNA copy number that was determined by direct quantitative PCR analysis of extracts using a DNA polymerase tolerant to a wide range of common PCR inhibitors. Furthermore, we estimated the number of RBC-L molecules (2.63 × 10⁸) and chlorophyll molecules (1.85 × 10⁹) in each cell in 3-week-old wild-type rosette leaves; these values had relatively low coefficients of variation, underscoring the reliability of our method.
Conclusion:Genomic DNA copy number and ploidy are useful as general normalization factors, providing an easy method for determining the number of transcripts, proteins, and metabolites in a cell.
Background
Cellular levels of transcripts, proteins, and metabolites are usually quantified relative to the value for a known, constitutively expressed cellular factor. Quanti-fication of transcripts using northern hybridization is based on total amounts of RNA or mRNA. Quantifica-tion of transcripts using RT-PCR analysis, including real-time RT-PCR, is based on the expression level of a reference gene [1-4], and a DNA array detects
relative levels of transcripts [5,6]. Protein levels are typically quantified by Coomassie Brilliant Blue (CBB) staining of samples subjected to SDS-PAGE, by two-dimensional difference gel electrophoresis for pro-teome analysis, by immunoblotting, or by enzyme-linked immunosorbent assay relative to the weight of total protein, fresh weight, dry weight or culture volume. Metabolites are often quantified based on the weight of total protein, fresh weight or dry weight. Such quantification methods are useful when the nor-malization factor does not vary among samples. Between tissues, however, the transcriptional activity may differ, and the ratio between mRNA and rRNA * Correspondence: [email protected]
1
Department of Mathematical and Life Sciences, Graduate School of Science, Hiroshima University, 1-3-1, Kagamiyama, Higashi-Hiroshima, 739-8526, Japan Full list of author information is available at the end of the article
may vary widely depending on the cell population [7,8]. Because rRNA comprises a large proportion of total RNA in the cell, transcript quantification based on total amounts of RNA or mRNA in one cell type may not accurately reflect the transcript levels in other cell types. The precision of quantitative (q)RT-PCR depends on accurate transcript normalization using constitutively expressed genes. Statistical algorithms have been developed to help validate reference genes [3,4]; prior to analysis, however, it is difficult to know which reference gene is consistently expressed among the samples, such as when a novel mutant or treat-ment analysis is under consideration. Similarly, total protein, fresh weight, dry weight, or culture volume may vary between samples.
InArabidopsis thaliana,abc4is a mutant of the
phyllo-quinone biosynthesis gene and exhibits the dwarf and pale-green phenotype [9]. The mutant has fewer chloro-plasts than wild type, and the intercellular space is also larger [9]. Northern hybridization using total RNA
revealed that the RBC-L(Rubisco large subunit) and
RBC-S(Rubisco small subunit) transcript levels are sig-nificantly elevated in theabc4mutant, whereas theLHCP (light-harvesting chlorophylla/bprotein) transcript level is almost the same as in the wild type [9]. Quantification by CBB staining of samples subjected to SDS-PAGE or by immunoblotting based on total input protein revealed similar levels of both RBC-L and RBC-S between wild type andabc4and that the mutant had a slightly reduced level of LHCP [9]. To address these potentially confound-ing factors in quantitative analysis, we developed meth-ods to quantify transcript, protein, and metabolite levels based on genomic DNA copy number and ploidy using
A. thalianawild type andabc4.
Results and Discussion
Analysis of genomic DNA copy number per cell
Many plant cells have a unique cell cycle mode with cells undergoing iterative DNA replication without cyto-kinesis. This endoreduplication is frequently observed in some, but not all, plants [10]. Flow cytometry demon-strated that 32% of nuclei isolated from 3-week-old wild-type rosette leaves were in the 2C peak, and 68% of nuclei were in the 4C, 8C and 16C peaks (Figure 1A and
1C). The mutant abc4had a dwarf/pale-green
pheno-type (Figure 1B), as expected [9]. Flow cytometry demonstrated that 50% of nuclei isolated from 3-week-oldabc4rosette leaves were in the 2C peak, and 50% of nuclei were in the 4C and 8C peaks (Figure 1C). There-fore, the mean ploidy of 3-week-old rosette leaves from
wild type and abc4 was 4.35 ± 0.08 and 3.08 ± 0.03
(mean ±s.d.), respectively.
Transcript accumulation normalized to genomic DNA copy number and ploidy
We used qRT-PCR to compare transcript levels ofRBC-L
andRBC-Sbetween wild-type andabc4plants. For
quanti-fication using theΔΔCt method [11], one of several estab-lished housekeeping genes, namelyACT2(actin 2),PDF2
(transposable element gene),SAND(SAND family
pro-tein),GAPDH(glyceraldehyde 3-phosphate
dehydrogen-ase), UBC (ubiquitin-conjugating enzyme), EF-1a
(elongation factor 1-a),PPR(pentatricopeptide repeat-containing protein),YLS8(yellow-leaf-specific protein 8),
UBC9 (ubiquitin-conjugation enzyme E2), or the18S
rRNA gene or genomic DNA (Figure 2A), was used as the reference (see additional file 1). Derivation of the 2-ΔΔCt equation, including assumptions, experimental design, and validation tests, is described in the Applied Biosystems User Bulletin # 2 http://www3.appliedbiosystems.com/ cms/groups/mcb _support/documents/generaldocuments/
A
C
0 20 40 60 80 100
Ploidy
(
%
)
Wild type abc4
2C
4C
8C
16C
B
1 cm
cms_040980.pdf. When genomic DNA was used as refer-ence, the relative transcript accumulation was calculated
as follows: 2 2 3 08
4 35 −ΔΔCt× mutant = −ΔΔ ×
wild
Ct
G G
.
. , whereGmutant andGwildare the genomic DNA copy number per cell (i.e.,
mean ploidy) of theabc4and wild-type plants, respectively (see additional file 2). UsingACT2as the reference, the
RBC-L and RBC-Stranscripts were lower inabc4plants
(Figure 2A; also see additional file 3). By contrast, the levels were comparable between wild type and mutant
usingSANDorGAPDHas the reference, and the levels
were higher in the mutant than in the wild type using
UBC, EF-1a, PPR, YLS8orUBC9as the reference. Use of
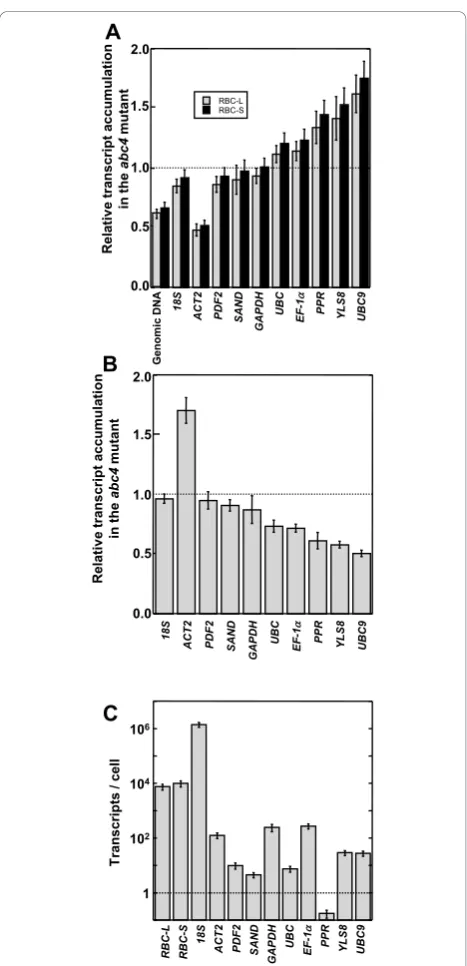
genomic DNA,18SrRNA, orPDF2as a reference revealed slightly lower levels of bothRBC-LandRBC-Stranscripts in the mutant. Figure 2B shows the transcript levels of the genes often used as references inabc4relative to the wild type using genomic DNA as the reference. This analysis indicated that the18SandPDF2transcript levels were similar between the wild type and mutant. The level of ACT2transcript was significantly higher in the mutant,
whereas levels of SAND, GAPDH, UBC, EF-1a, PPR,
YLS8 andUBC9 transcripts were lower in the mutant.
We concluded that differences between the transcript levels of the reference genes in the wild type and mutant (Figure 2B) resulted in apparent differences in
RBC-L andRBC-S transcript levels between the wild
type and mutant (Figure 2A). In this assay, the wild
type and mutant had comparable levels of 18S
tran-script, but 18S expression is not always consistent
between cells [7,8].
Northern hybridization using total RNA revealed that
theRBC-LandRBC-Stranscript levels were significantly
elevated inabc4[9]. Note that qRT-PCR normalized to
the genes often used as references may provide misleading results (Figure 2A). However, qRT-PCR using genomic DNA copy number and the mean ploidy as the reference can provide more accurate information on the level of transcripts per cell.
Quantification of transcript number per cell
In 3-week-old wild-type plants, we analyzed the number of transcripts by qRT-PCR using genomic DNA as refer-ence (Figure 2C). We determined the DNA copy num-ber by qRT-PCR and calculated the transcript numnum-ber per cell as follows:
( / )
( /
transcript number cell
transcript number genomic DNA co
= ppy number
genomic DNA copy number/cell
Ct ) ( ) . { × = × = − −
2 4 35
2 Δ
C
Ct cDNA( )−Ct genome( )}×4 35.
A ኤዙኜ A˂˂&W A ˂˂& W $ 2.0 1.0 0.0
*HQRPH 6 $&73') 6$1' *$3'+ 8%&()D 335</68%&
ኤዙኜ 5%&/ 5%&6 5%&/ $ Relat iv e t ran scrip t accu m u lat io n in the ab c4 mutant 2.0 1.0 0.0
A
R el at iv e t ran scr ip t accu m u lat ion in the ab c4 mutantC
T ran scrip ts /cell 104
106 102 1 RBC-L RBC-S 18S ACT 2 PD F2 S AND G AP DH UBC EF-1 D
PPR YLS8 UBC9
B
Gen o m ic DNA 18S ACT 2 PD F2 S AND GAP D HUBC EF-1
D
PPR YLS8 UBC9
0.5 1.5 1.5 0.5 18S ACT 2 PD F2 S AND GAP D H
UBC EF-1
D
PPR YLS8 UBC9
Figure 2 qPCR analysis of RBC-L andRBC-Stranscripts in
A. thalianaand evaluation of reference genes. (A) Transcript levels ofRBC-LandRBC-SinA. thalianarosette leaf samples were analyzed by qRT-PCR and quantified by theΔΔCt method using the reference genes indicated at bottom. Data reflect relative transcript accumulation inabc4plants relative to that in wild-type plants. (B) Transcript levels of the reference genes in rosette leaf samples fromA. thalianawere analyzed by qRT-PCR and quantified by the ΔΔCt method using genomic DNA as the reference. Data reflect relative transcript accumulation inabc4plants relative to that in wild-type plants. (C) Transcripts numbers per cell in the wild-type
Each cell in the wild-type rosette leaf had an average of 7.5 × 10³ RBC-Ltranscripts, 9.9 × 10³ RBC-S tran-scripts, and 1.4 × 10⁶ 18S rRNAtranscripts (see
addi-tional file 4). The number of PPR/At1g62930
(pentatricopeptide repeat-containing protein gene) tran-scripts per cell was much lower (0.17) (Figure 2C; also see additional file 4), indicating that there is less than onePPR transcript per cell.PPR was not transcribed in all cells of wild-type rosette leaves. The rosette leaf con-tains various cell types (e.g., mesophyll cells, epidermal cells, guard cells and vascular tissue cells), and PPR transcription may be cell type specific. Of course, any gene with less than one transcript per cell should not be used as a reference for quantification of qRT-PCR data.
Protein accumulation normalized to genomic DNA copy number and ploidy
We analyzed protein expression in 3-week-old wild-type
and abc4 rosette leaves by SDS-PAGE and quantified
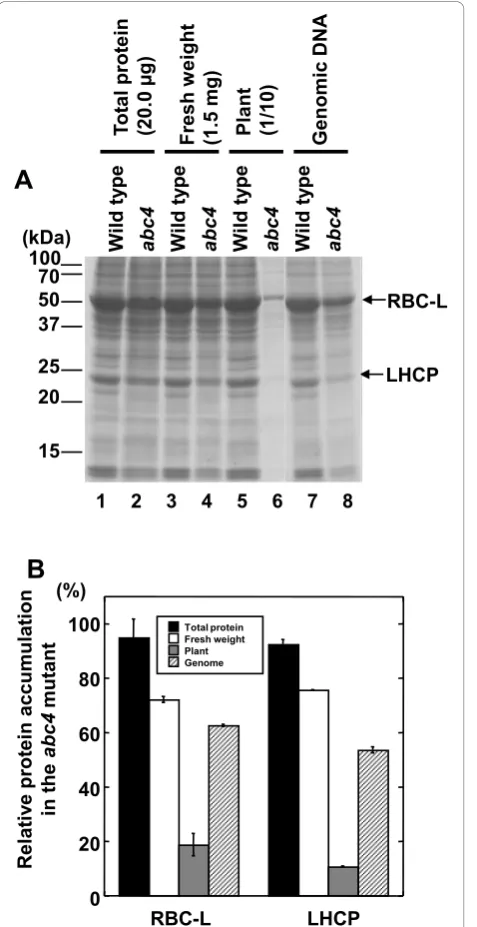
CBB-stained RBC-L and LHCP bands using ImageJ http://rsbweb.nih.gov/ij/ based on several normalization criteria. When the mass of the total input protein was used for normalization, the RBC-L and LHCP band intensities were nearly identical between wild-type and abc4samples (Figure 3A lanes 1 and 2, and Figure 3B), but the amounts of these proteins were slightly lower in abc4when fresh weight was used for normalization (Fig-ure 3A lanes 3 and 4, and Fig(Fig-ure 3B). The fresh weight of all rosette leaves from individual 3-week-old
wild-type andabc4plants was 15.5 ± 0.3 mg and 3.5 ± 0.1
mg, respectively (mean ±s.e.m.,n= 20 for both). Based on the individual mean fresh weight of rosette leaves,
the amount of RBC-L and LHCP protein in abc4 was
significantly lower than in wild type (Figure 3A lanes 5 and 6, and Figure 3B).
We next quantified protein expression levels normal-ized to genomic DNA copy number and ploidy estab-lished by qPCR using plant extracts. To extract total protein, the plants were homogenized in an extraction buffer containing 10 mM EDTA and 1.0% SDS, both of which inhibit DNase (see Methods) [12]. Because the KAPA2G Robust HotStart DNA polymerase (Kapa Bio-systems) used in this assay is tolerant to a wide range of common PCR inhibitors (e.g., salts and SDS), the pro-tein samples were used without further purification as the qPCR template. Protein samples from equivalent numbers of wild type and mutant cells were then sub-jected to SDS-PAGE; for this analysis the volume of protein sample from the mutant (Vmutant) was applied.
V V
R G
G V R
mutant wild mutant
wild wild
= × ×1 = × ×1 3 08
4 35.. , where
Vwild is the applied volume of protein sample from
wild type,R is the relative genomic DNA copy number
of the protein sample from the mutant to that of wild
type, and Gm u tant and Gwild are the genomic DNA
copy number per cell (i.e., mean ploidy) of the abc4
and wild-type plants, respectively (see Methods and additional file 5). The amounts of RBC-L and LHCP in
abc4 were significantly lower than in the wild type
based on genomic DNA copy number (Figure 3A lanes 7 and 8, and Figure 3B).
Quantification of protein and metabolite number per cell We next analyzed the number of genomic DNA mole-cules and RBC-L molemole-cules per cell in protein samples of 3-week-old wild-type rosette leaves. One microliter of a 1:40 dilution of wild-type protein extract and 1μl of plasmid harboring a DNA fragment amplified by PCR
(between 2.88 × 10² and 2.88 × 10⁹ molecules, or 0
molecules) were added to the PCR reactions. This mix-ing procedure was done because the amplification effi-ciency of the qPCR differed depending on whether the protein extract or the purified plasmid was used as tem-plate (efficiency = 0.665 or 0.890, respectively). There-fore, we could not extrapolate the genomic DNA copy number in the protein samples using the standard curve created with the purified plasmid. Thus, to estimate genomic DNA copy number, we assessed the effect of exogenously added plasmid DNA in PCR reactions con-taining genomic DNA on PCR amplification of a DNA segment. This process can be formulated as follows:
(g+p)(2E)Ct=A, wheregis the genomic DNA copy
number,pis the plasmid copy number,Ctis the PCR
cycle number,Eis the PCR amplification coefficient, and
Ais the number of amplified molecules. The nonlinear
least-squares method was used to obtain the parameters g,Eand A(R language; http://www.r-project.org) (see additional file 6). The qPCR analysis yielded the genomic
DNA copy number in 1μl of the protein sample from
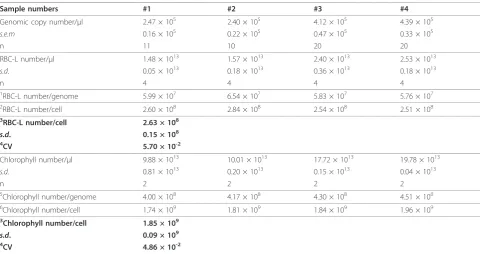
the wild-type plant (Figure 4A, Table 1). SDS-PAGE ana-lysis followed by CBB staining was used to determine the number of RBC-L molecules in 1μl of the wild-type pro-tein sample (Figure 4B, Figure 4C and Table 1); recombi-nant RBC-L purified fromEscherichia coliwas used as a control. These results indicated that the wild-type protein sample had 2.63 × 10⁸± 0.15 × 10⁸(mean ±s.d., n= 4) molecules of RBC-L per cell. In plants, Rubisco consists of eight large and eight small subunits [13]. Therefore,
each cell had 3.29 × 10⁷ Rubisco complexes.
Further-more, we measured the chlorophyll content [14] in the protein sample from 3-week-old wild-type rosette leaves
(Table 1). The molecular weights of chlorophyllaand
chlorophyllbare 893 and 907, respectively. We
15 20 25 37 50 70 100 (kDa)
To
ta
l p
ro
te
in
(20.0
μ
g)
Fresh w
e
ight
(1
.5
mg)
Plant (1/1
0
)
Genomic DNA
A
RBC-L
LHCP
B
(%)
RBC-L LHCP
0 20 40 60 80
100 Total protein
Fresh weight Plant Genome
R
e
lat
iv
e
prot
ein
accumulat
ion
in t
h
e
abc4
mutant
1 2 3 4 5 6 7 8
W
ild t
ype
abc4 Wild t
ype
abc4 Wild t
ype
abc4 Wild t
ype
abc4
Figure 3 Analysis of RBC-L and LHCP accumulation in A. thaliana. (A) Total protein extract prepared from 3-week-old wild-type (odd-numbered lanes) andabc4(even-numbered lanes) plants was subjected to SDS-PAGE analysis followed by CBB staining; sample amounts varied according to the normalization factor indicated at top. Lanes 1 and 2, 20.0μg total protein; lanes 3 (17.9
μg total protein) and 4 (13.5μg total protein) correspond to 1.5 mg of fresh weight; lanes 5 (18.9μg total protein) and 6 (1.2μg total protein) correspond to 10% of the material from an individual plant (wild type: 1.55 mg of fresh weight;abc4: 0.35 mg of fresh weight); lanes 7 (20.0μg total protein) and 8 (12.4μg total protein) correspond to equivalent cell numbers of wild-type and mutant samples. (B) Quantification of RBC-L and LHCP accumulation in wild-type andabc4plants. The density of each CBB-stained protein band in panel (A) was quantified using ImageJ http://rsbweb.nih.gov/ij/. Data reflect the mean ± standard deviation (n= 4) relative to the indicated normalization factor.
15 20 25 37 50 75 100
(kDa) 8 4 2 1 0.5 x 10¹³RBC-L
2 2 1 1 Apply vol. (μl)
a b c d e f g h i
B
Additional copy number of cloned PCR products A
0 10 20 Ct
0
102 106 1010
30
Observed Predicted
104 108
Intensity
0 200 400 800 1000
0 2 4 6 8 10
RBC-L
mole
c
u
le
s
(x
1
0
13)
600 R2= 0.998
C
0 2 4 6 8
between 9.88 × 10¹³and 1.98 × 10¹⁴chlorophyll mole-cules, indicating that each cell had 1.85 × 10⁹ ± 0.09 × 10⁹(mean ±s.d., n =4) molecules of chlorophyll. The fact that the coefficient of variation for the number of RCB-L and chlorophyll molecules per genome was rela-tively low (5.70 × 10⁻²and 4.86 × 10⁻², respectively; Table 1) suggested that quantification based on the genomic DNA copy number was reproducible.
We quantified the amount of RBC-L according to the inten-sity of CBB staining following SDS/PAGE analysis. However, it is also possible to use immunoblotting or enzyme-linked immunosorbent assay to quantify the number of molecules of a particular protein per genomic DNA copy number.
Conclusions
In this study, we demonstrate that establishing an appro-priate normalization factor is a challenging yet vital aspect of comparing protein, transcript, or metabolite levels among samples. Our results establish a facile and accurate method for quantifying these molecules based on genomic DNA copy number and ploidy. Although we performed cytometric analysis to measure the ploidy, a simplified method without the cytometric analysis may be applicable when assessing the effect(s) of a short-term
treatment (e.g., induction of stress over several hours). Furthermore, our method can provide information on the number of transcripts, proteins, and metabolites per cell, and it should be applicable for stoichiometry and mathematical modeling of cellular systems.
Methods Plant materials
Arabidopsis thaliana, Wassilewskija (wild type) andabc4
[9] (Wassilewskija background) were grown at 23°C under continuous light (32.0μmol·m-2s-1) on plates con-taining 1/2 MS medium and 1.5% sucrose.
Ploidy measurement
Flow cytometry was performed by a Ploidy Analyzer (Partec, Münster, Germany) [15]. At least 5,000 nuclei isolated from rosette leaves of each 3-week-old Arabi-dopsis plant were used for each ploidy measurement. Three biological and two technical replicates were used for each sample analyzed.
Preparation of total nucleic acid fromA. thaliana
Rosette leaves (100 mg) from each 3-week-old Arabidopsis plant were ground with a mortar and pestle in liquid Table 1 Numbers of molecules in 3-week-old rosette leaves of wild-type Arabidopsis.
Sample numbers #1 #2 #3 #4
Genomic copy number/μl 2.47 × 10⁵ 2.40 × 10⁵ 4.12 × 10⁵ 4.39 × 10⁵
s.e.m 0.16 × 10⁵ 0.22 × 10⁵ 0.47 × 10⁵ 0.33 × 10⁵
n 11 10 20 20
RBC-L number/μl 1.48 × 10¹³ 1.57 × 10¹³ 2.40 × 10¹³ 2.53 × 10¹³
s.d. 0.05 × 10¹³ 0.18 × 10¹³ 0.36 × 10¹³ 0.18 × 10¹³
n 4 4 4 4
1
RBC-L number/genome 5.99 × 10⁷ 6.54 × 10⁷ 5.83 × 10⁷ 5.76 × 10⁷
2RBC-L number/cell 2.60 × 10⁸ 2.84 × 10⁸ 2.54 × 10⁸ 2.51 × 10⁸
3RBC-L number/cell 2.63 × 10⁸
s.d. 0.15 × 10⁸
4CV 5.70 × 10⁻²
Chlorophyll number/μl 9.88 × 10¹³ 10.01 × 10¹³ 17.72 × 10¹³ 19.78 × 10¹³
s.d. 0.81 × 10¹³ 0.20 × 10¹³ 0.15 × 10¹³ 0.04 × 10¹³
n 2 2 2 2
5
Chlorophyll number/genome 4.00 × 10⁸ 4.17 × 10⁸ 4.30 × 10⁸ 4.51 × 10⁸
6Chlorophyll number/cell 1.74 × 10⁹ 1.81 × 10⁹ 1.84 × 10⁹ 1.96 × 10⁹
3Chlorophyll number/cell 1.85 × 10⁹
s.d. 0.09 × 10⁹
4CV 4.86 × 10⁻²
1
(RBC-L number/genome) = (RBC-L number/μl)/(Genome copy number/μl).
2
(RBC-L number/cell) = (RBC-L number/genome) × (Genome copy number/cell). = (RBC-L number/genome) × 4.35.
3
Mean of sample number 1 to 4.
4
Coefficient of variation (s.d./mean)
5
(Chlorophyll number/genome) = (Chlorophyll number/μl)/(Genome copy number/μl).
6
nitrogen and homogenized in 5 volumes (v/w) of extrac-tion buffer (100 mM MOPS-KOH, pH 7.0, 10 mM EDTA, 0.3 M NaCl, 1.0% SDS). Extraction of total nucleic acids (genomic DNA and total RNA) was performed by the addi-tion of 5 volumes of phenol saturated with 1 M MOPS-KOH, pH 7.0, and 5 volumes of chloroform:isoamyl alco-hol (24:1, v/v) followed by vigorous agitation and centrifu-gation for 10 min at 20,000 ×g. The aqueous phase was collected and extracted two times with an equal volume of phenol:chloroform:isoamyl alcohol (25:24:1, v/v/v). The nucleic acids were precipitated with ethanol and suspended in 50μl nuclease-free water (see additional file 7).
Preparation of cDNA and genomic DNA
To prepare cDNAs, 4μl total nucleic acid (A260= 20.0)
was digested with TurboDNA-free DNase I (Ambion,
Austin, TX, USA) according to the manufacturer’s
instructions. Absence of genomic DNA in DNase I trea-ted samples was verified by PCR using primers T7F6-F-2 and T7F6-R-T7F6-F-2 or MDC16-F-T7F6-F-2 and MDC16-R-T7F6-F-2 (see additional file 1). cDNA synthesis was performed using the PrimeScript RT reagent kit in the presence of oligo dT and random 6-mer primers according to the manu-facturer’s instructions (Takara Bio. Inc., Ohtsu, Japan). To prepare genomic DNA, 4 μl total nucleic acid (A260
= 20.0) was digested with RNase (Wako Pure Chemical Industries, Osaka, Japan) (see additional files 7 and 8).
Protein sample preparation
Rosette leaves (100 mg) from each 3-week-old plant were ground with a mortar and pestle in liquid nitrogen and transferred to a new 2-ml tube and homogenized in 5 volumes (v/w) of extraction buffer containing 15 mM Tris-HCl, pH 8.0, 50 mM NaCl, 10 mM EDTA, 1.0% SDS and 1.0% protease inhibitor cocktail (Sigma-Aldrich, Tokyo, Japan). The samples were incubated on ice for 10 min with vigorous vortexing every minute. The samples were centrifuged for 5 min at 10,000 ×g, and the supernatants were used for further experiments. The total protein concentration of each supernatant was determined using a Coomassie Protein Assay kit (Pierce Biotechnology, Rockford, IL, USA). Chlorophyll concen-trations were calculated according to Arnon [14].
qPCR analysis
All qPCR reactions were analyzed with an ABI PRISM 7300 sequence detection system (Applied Biosystems, Fos-ter City, CA, USA), and data were analyzed using SDS 2.2.1 software (Applied Biosystems). The KAPA SYBR FAST qPCR kit (Kapa Biosystems, Boston, MA, USA) was used for qPCR amplification of purified genomic DNA or cDNA according to the manufacturer’s instructions; the 20-μl reactions contained 1μl of genomic DNA or cDNA template and 8 pmol of each set of gene-specific primers
(see additional files 1). PCR reaction conditions were as follows: 95°C for 3 min, followed by 40 cycles of 95°C for 15 s and 60°C for 40 s. Transcript levels were quantified
by theΔΔCt method [11]. The KAPA2G Robust HotStart
kit (Kapa Biosystems) was used for qPCR amplification of genomic DNA in protein extract supernatants; the 20-μl reactions contained 4μl of undiluted KAPA2G Buffer B, 4 μl of undiluted Enhancer 1, 1.6μl of 2.5 mM dNTP, 8 pmol of each gene-specific primer (3-F and T7F6-3-R, see additional file 1), 1 μl of 0.1% SYBR Green I
(Takara), 0.4μl Rox High (from the KAPA SYBR FAST
qPCR kit), 2 U of KAPA2G Robust HotStart DNA poly-merase, and 1μl of protein extract. For quantification of genomic DNA copy number in the mutant plants relative to wild-type plants, 1μl of protein extract of wild-type plants (diluted 1:10, 1:20, 1:40, 1:80 or 1:160) was added to the PCR reactions, and a standard curve was generated by qPCR (see additional file 5). One microliter of a 1:40 dilu-tion of protein extract of the mutant plants was added to the PCR reactions, and qPCR was performed. For absolute quantification of genomic DNA copy number in protein extracts of wild-type plants, 1μl of a 1:40 dilution of
wild-type protein extract and 1 μl of cloned PCR products
(between 2.88 × 10²and 2.88 × 10⁹molecules, or 0 mole-cules) was added to the PCR reactions; the 20-μl reactions contained 4μl of undiluted KAPA2G Buffer B, 4μl of undiluted Enhancer 1, 4.4μl of 25 mM MgCl2, 1.6μl of
2.5 mM dNTP, 8 pmol of each gene-specific primer (T7F6-3-F and T7F6-3-R, see additional file 1), 10 pmol of TaqMan Probe (see additional file 1), 0.4μl Rox High (from the KAPA SYBR FAST qPCR kit), 2 U of KAPA2G
Robust HotStart DNA polymerase, and 1μl of protein
extract, and PCR was performed. This dilution series was prepared with EASY Dilution (for real-time PCR) (Takara). PCR reaction conditions were as follows: 95°C for 3 min, followed by 40 cycles of 95°C for 15 s and 72°C for 40 s.
Preparation of cloned PCR products
PCR was performed using primers T7F6-3-F and T7F6-3-R (see additional file 1) with genomic DNA of wild-type Ara-bidopsis as template. The amplified DNA fragment was ligated into the TA cloning vector, pMD20 (Takara), and the sequence was confirmed. The plasmids containing the
PCR products were digested with XhoI and purified.
The mass of a nucleotide pair in DNA is 660 Da, and the plasmid containing the PCR product was 2,872 bp. The concentration of the linearized plasmid was determined, and the number of plasmid molecules was calculated.
Expression and purification of RBC-L
The full-length open reading frame of RBC-L was amplified by PCR using primers containing anNdeI site
(RBCL-Nde, 5’
(RBCL2-Xho, 5’
-CCCCTCGAGCTCTTGGCCATC-TAATTTATCGATG-3’; XhoI site underlined). The
amplified DNA fragment was digested with NdeI and
XhoI and ligated into the expression vector pET-24a(+) (Novagen, San Diego, CA, USA). RBC-L was expressed and purified as described [16]. The molecular weight of RBC-L was 54,019. The concentration of the purified RBC-L was determined, and the number of RBC-L molecules was calculated.
Additional material
Additional File 1: Primers used in this work. Table shows the primer names and the sequences.
Additional File 2: qPCR amplification and dissociation curves. (A) Schematic representation of each PCR-amplified region in chromosomes I-V (see additional file 1). (B) Real-time qPCR amplification curves generated using equal volume of template and the primer sets indicated. The curves using the different primer sets were the same, suggesting that the amplification efficiency using three different primer sets and the extraction efficiency of the different regions of genomic DNA were essentially equivalent. (C) Dissociation curves for the PCR products generated using the indicated primer sets. Theyaxis shows the logarithm of fluorescence. These curves reflect normalized data.
Additional File 3: Dissociation curves. Dissociation curves for the PCR products generated using the primer set of T7F6-F-2 and T7F6-R-2 (A), MDC16-F-2 and MDC16-R-2 (B), 18S-3-F and 18S-3-R (C), 2-F and RBCL-2-R (D), or RBCS-3-F and RBCS-3-R (E) (see additional file 1). Theyaxis shows the logarithm of fluorescence. These curves reflect normalized data.
Additional File 4: Transcript number per cell in 3-week-old rosette leaves of wild-type Arabidopsis. Table shows the transcript number of
RBC-L,RBC-S,18S,ACT2,PDF2,SAND,GAPDH,UBC,EF-1a,PPR,YLS8and
UBC9genes per cell.
Additional File 5: Standard curve indicating the Ct relative the dilution of protein extract sample from a wild-type plant as template for qPCR. One microliter of wild-type protein extract (diluted 1:10, 1:20, 1:40, 1:80, or 1:160) was used as template for qPCR.
Additional File 6: Calculation of genomic DNA copy number in protein extracts. This file shows mathematical formula with actual command sequences on R language to calculate genomic DNA copy number.
Additional File 7: Scheme for preparing cDNA and genomic DNA. Scheme shows the methods of extraction of the nucleic acid (genomic DNA and total RNA), DNase I digestion, reverse transcription and RNase digestion, and the extraction buffer composition.
Additional File 8: Agarose gel analysis of total nucleic acid, genomic DNA, and total RNA preparations. Total nucleic acid from wild-type plants was treated without (lane 1) or with RNase (lane 2) or DNase (lane 3) and subjected to 1.2% agarose gel electrophoresis followed by ethidium bromide staining.
List of abbreviations
LHCP: light-harvesting chlorophylla/bprotein; qPCR: quantitative PCR; qRT-PCR: quantitative reverse transcription PCR; RBC or Rubisco: ribulose 1,5-bisphosphate carboxylase/oxygenase; RBC-L: large subunit of Rubisco; RBC-S: small subunit of Rubisco;ACT2: actin 2;PDF2: transposable element gene;
SAND: SAND family protein;GAPDH: glyceraldehyde 3-phosphate
dehydrogenase;UBC: ubiquitin-conjugating enzyme;EF-1α: elongation factor 1-α;PPR: pentatricopeptide repeat-containing protein;YLS8: yellow-leaf-specific protein 8;UBC9: ubiquitin-conjugation enzyme E2.
Acknowledgements
We thank T. Shibata (Hiroshima University) for critical reading of the manuscript. The Plant culture facility was provided by the Center for Gene Science, Hiroshima University. This work was supported by the Japan Society of the Promotion of Science [Grant-in-Aid for Scientific Research (c) (No. 20570032 to HS)].
Author details
1Department of Mathematical and Life Sciences, Graduate School of Science, Hiroshima University, 1-3-1, Kagamiyama, Higashi-Hiroshima, 739-8526, Japan. 2Graduate School of Information Sciences, Tohoku University, 6-3-09, Aramaki-Aza-Aoba, Aoba-ku, Sendai 980-8579, Japan.3Plant Functional Genomics Research Group, Plant Science Center, RIKEN Yokohama Institute, 1-7-22 Suehiro-cho, Tsurumi-ku, Yokohama, 230-0045 Japan.
Authors’contributions
HS conceived and directed this study, performed all experimental work, and wrote the paper with input from co-authors. TO calculated the copy number of genomic DNA in protein samples. NT and MM performed the flow cytometry analysis. AS contributed to data analysis and provided advice. All authors read and approved the final manuscript.
Competing interests
The authors declare that they have no competing interests.
Received: 1 October 2010 Accepted: 29 December 2010 Published: 29 December 2010
References
1. Czechowski T, Stitt M, Altmann T, Udvardi MK, Scheible WR:Genome-wide identification and testing of superior reference genes for transcript normalization in Arabidopsis.Plant Physiol2005,139:5-17.
2. Guenin S, Mauriat M, Pelloux J, Van Wuytswinkel O, Bellini C, Gutierrez L: Normalization of qRT-PCR data: the necessity of adopting a systematic, experimental conditions-specific, validation of references.J Exp Bot2009, 60:487-493.
3. Vandesompele J, De Preter K, Pattyn F, Poppe B, Van Roy N, De Paepe A, Speleman F:Accurate normalization of real-time quantitative RT-PCR data by geometric averaging of multiple internal control genes.Genome Biol2002,3:RESEARCH0034.
4. Pfaffl MW, Tichopad A, Prgomet C, Neuvians TP:Determination of stable housekeeping genes, differentially regulated target genes and sample integrity: BestKeeper–Excel-based tool using pair-wise correlations.
Biotechnol Lett2004,26:509-515.
5. Bilban M, Buehler LK, Head S, Desoye G, Quaranta V:Normalizing DNA microarray data.Curr Issues Mol Biol2002,4:57-64.
6. Salit M:Standards in gene expression microarray experiments.Methods Enzymol2006,411:63-78.
7. Hansen MC, Nielsen AK, Molin S, Hammer K, Kilstrup M:Changes in rRNA levels during stress invalidates results from mRNA blotting: fluorescence in situ rRNA hybridization permits renormalization for estimation of cellular mRNA levels.J Bacteriol2001,183:4747-4751.
8. Solanas M, Moral R, Escrich E:Unsuitability of using ribosomal RNA as loading control for Northern blot analyses related to the imbalance between messenger and ribosomal RNA content in rat mammary tumors.Anal Biochem2001,288:99-102.
9. Shimada H, Ohno R, Shibata M, Ikegami I, Onai K, Ohto MA, Takamiya K: Inactivation and deficiency of core proteins of photosystems I and II caused by genetical phylloquinone and plastoquinone deficiency but retained lamellar structure in a T-DNA mutant of Arabidopsis.Plant J
2005,41:627-637.
10. Inze D, De Veylder L:Cell cycle regulation in plant development.Annual Review of Genetics2006,40:77-105.
11. Livak KJ, Schmittgen TD:Analysis of relative gene expression data using real-time quantitative PCR and the 2(-Delta Delta C(T)) Method.Methods
2001,25:402-408.
12. Liao TH:Reversible Inactivation of Pancreatic Deoxyribonuclease-a by Sodium Dodecyl-Sulfate - Removal of Cooh-Terminal Residues from Denatured Protein by Carboxypeptidase-A.Journal of Biological Chemistry
13. Spreitzer RJ, Salvucci ME:Rubisco: structure, regulatory interactions, and possibilities for a better enzyme.Annu Rev Plant Biol2002,53:449-475. 14. Arnon DI:Copper Enzymes in Isolated Chloroplasts. Polyphenoloxidase in
Beta Vulgaris.Plant Physiol1949,24:1-15.
15. Takahashi N, Lammens T, Boudolf V, Maes S, Yoshizumi T, De Jaeger G, Witters E, Inze D, De Veylder L:The DNA replication checkpoint aids survival of plants deficient in the novel replisome factor ETG1.EMBO J
2008,27:1840-1851.
16. Shimada H, Mochizuki M, Ogura K, Froehlich JE, Osteryoung KW, Shirano Y, Shibata D, Masuda S, Mori K, Takamiya K:Arabidopsis cotyledon-specific chloroplast biogenesis factor CYO1 is a protein disulfide isomerase.Plant Cell2007,19:3157-3169.
doi:10.1186/1746-4811-6-29
Cite this article as:Shimadaet al.:Normalization using ploidy and genomic DNA copy number allows absolute quantification of
transcripts, proteins and metabolites in cells.Plant Methods20106:29.
Submit your next manuscript to BioMed Central and take full advantage of:
• Convenient online submission
• Thorough peer review
• No space constraints or color figure charges
• Immediate publication on acceptance
• Inclusion in PubMed, CAS, Scopus and Google Scholar
• Research which is freely available for redistribution