R E S E A R C H A R T I C L E
Open Access
Longitudinal studies that use data collected
as part of usual care risk reporting biased
results: a systematic review
Delaram Farzanfar
1*, Asmaa Abumuamar
2, Jayoon Kim
3, Emily Sirotich
3, Yue Wang
3and Eleanor Pullenayegum
4,5Abstract
Background:Longitudinal studies using data collected as part of usual care risk providing biased results if visit times are related to the outcome of interest. Statistical methods for mitigating this bias are available but rarely used. This lack of use could be attributed to a lack of need or to a lack of awareness of the issue.
Methods:We performed a systematic review of longitudinal studies that used data collected as part of patients’ usual care and were published in MEDLINE or EMBASE databases between January 2005 through May 13th2015. We asked whether the extent of and reasons for variability in visit times were reported on, and in cases where there was a need to account for informativeness of visit times, whether an appropriate method was used. Results:Of 44 eligible articles, 57% (n= 25) reported on the total follow-up time, 7% (n= 3) on the gaps between visits, and 57% (n= 25) on the number of visits per patient; 78% (n= 34) reported on at least one of these. Two studies assessed predictors of visit times, and 86% of studies did not report enough information to assess whether there was a need to account for informative follow-up. Only one study used a method designed to account for informative visit times.
Conclusions:The low proportion of studies reporting on whether there were important predictors of visit times
suggests that researchers are unaware of the potential for bias when data is collected as part of usual care and visit times are irregular. Guidance on the potential for bias and on the reporting of longitudinal studies subject to irregular follow-up is needed.
Keywords:Longitudinal data, Administrative data, Statistical methods, Bias
Background
Longitudinal studies are vital to understanding disease progression. Chart reviews are a common source of longitudinal data, and can be used to identify the long-term benefits of a medical intervention, risk factors for poor outcomes, and the burden of disease over time. Chart reviews are inexpensive and popular; for example, they are estimated to comprise 25% of all scientific articles published in emergency medicine journals [1]. However, chart reviews often feature irregular follow-up times, i.e. visit times that vary among patients, often to the extent that no two patients share an observation time. If patients visit more often when unwell, this can lead to a biased
picture of disease course unless the data are analyzed appropriately [2].
Many analyses of longitudinal data subject to irregular observation use traditional approaches to longitudinal data analysis such as generalized estimating equations (GEEs) [3] and linear mixed models [4]. While these methods can be run on data with irregular follow-up, they will give biased inferences if the visit intensity is related to the outcome [5]. For this reason, methods designed specifically for irregular observation are usually required.
Statistical methods to handle longitudinal data subject to irregular follow-up began to be developed in the 1990s [6, 7]. There is now a substantial literature on these methods, which include inverse-intensity
weight-ing [2, 8–10] and semiparametric joint models [11–14].
* Correspondence:[email protected]
1University Health Network, University of Toronto, Toronto M5T 2S8, Canada
Full list of author information is available at the end of the article
Although specifically developed to help medical researchers by addressing the problem of over-representation of certain individuals or certain types of measurements in longitu-dinal studies with irregular follow-up, their use remains limited. A 2015 citation analysis using the Web of Science revealed that these methods were used only once as the primary analysis [15] and applied twice as a sensitivity analysis [16, 17].
These methods are either not being used because they are not needed or because there is a knowledge translation gap. This paper aimed to assess whether the lack of use is due to a lack of need. Specifically, we used a system-atic review to address the following questions: Among longitudinal studies published in the medical literature
that used data collected as part of patients’usual care,
and that were published in the period January 2005 to May 2015, 1. what proportion reported summary statis-tics on a) the number of visits per patient, b) gaps between visits, c) total follow-up time; 2. was there an assessment of predictors of visit time, and if so, was there a need to account for the fact that visit time was irregular; 3. was a method used that accounted for po-tential informativeness of visit times? The first question addresses whether the extent of irregularity was re-ported, the second whether visit times were informative about the outcome, and the third whether an appropri-ate method was used.
Methods
This review did not include outcomes of direct patient or clinical relevance and was thus not eligible for regis-tration in Prospero (International Prospective Register of Ongoing Systematic Reviews, http://www.crd.york.ac.uk/ prospero) [18, 19].
Search
We performed a search of the MEDLINE and EMBASE databases to identify studies assessing longitudinal data
collected as part of patients’ usual care (see Additional
file 1 for search terms). For both databases, the earliest publication date was restricted to January 2005, since several methods for analyzing longitudinal data subject to irregular follow-up were proposed by this time [6, 7], and the latest publication date was May 13, 2015.
Study selection and eligibility criteria
Eligibility criteria were chosen so as to specify studies where follow-up would be expected to be irregular, and where inverse-intensity weighting or semi-parametric joint modelling would be an appropriate method of analysis. Our analysis was limited to articles published in English.
We included studies that used patient-level data collected
as part of patients’ usual care with an outcome that was
measured on at least three occasions. We excluded studies that met one or more of the following criteria: 1) outcome was assessed on fewer than three occasions; 2) outcome was whether or not a visit occurred, or the number of visits; 3) visit times were specified by protocol, or analysis restricted to visits at specified times; 4) time-to-event analyses; 5) outcome was a single binary outcome per patient; 6) the outcome could have occurred only if a visit occurred; 7) outcome was measured on aggregate data. In addition, systematic reviews, meta-analysis and randomized controlled trials were also excluded.
We combined the searches from MEDLINE and EMBASE, removed duplicates and screened abstracts
for eligibility. In the summer of 2016 (May–September)
we trained a team of four reviewers (AA, JK, ES, YW) and two reviewers were chosen at random for each paper. These reviewers independently assessed both the abstracts and full-text articles, made eligibility decisions and re-solved disagreements by discussion. If necessary, a third party was consulted. As our reviewers were working part time, not all papers were assessed during this time, and the remainder were assessed by DF and EP. The same template was provided to each reviewer to record their results. In the first stage, abstracts were classified as either ineligible based on the above inclusion and exclusion criteria, or as needing full-text review. In the second stage, the full-texts were reviewed for abstracts that were not excluded. Agreement between reviewers was assessed
using Cohen’s kappa [20].
Data extraction
older patients tend to have higher blood pressure and also more measurements, then the visit scheme is informative. Thus if analysis of visit times uncovers a predictor that is also a predictor of outcome, the visit times are informative and should be accounted for. We distinguished between papers that reported results of analysis intended to assess whether the visit scheme was informative (i.e. an assess-ment of predictors of visit times, e.g. through recurrent event analysis of the visit process), papers where an inform-ative visit scheme could be deduced based on other infor-mation in the paper (e.g., descriptive statistics on length of follow up or number of visits, separately for certain subgroups), and papers where it was not possible to tell whether the visit scheme was informative because insuffi-cient analysis was reported.
Results were summarized using percentages.
Assessment of study quality
The Newcastle-Ottawa Scale (NOS) [21] was used to assess the quality of included studies in this systematic review. Each study was evaluated based on the NOS scale for fulfilling the established criteria in NOS for the 3 components of selection, comparability and out-come. An overall quality score was calculated by adding the number of stars for each category for a maximum total of 9.
Results
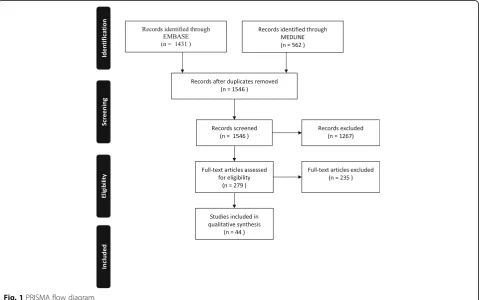
The search identified 1546 articles, of which 279 pro-ceeded to full-text review, and 44 were included in final analysis (See Fig. 1). The reviewers agreed in their inclu-sion/exclusion decision in 96% of the 1546 articles, with a kappa of 0.57. We found that the proportions of arti-cles that reported summary statistics on the number of visits per patient, gaps between visits and the total
follow-up time were 57% (n= 25), 7% (n = 3) and 57%
(n = 25), respectively (Table 1). Twenty-two percent
(n = 10) of articles did not provide summary statistics
on any of the above (See Table 2).
The majority of articles (93%, n = 41) did not assess
predictors of visit time. In 38 articles (86%), there was insufficient analysis to determine whether there was a need to account for informative visit times, and in the remaining 6 studies, this need was present. Only one of these 6 studies detailed analysis in the methods section that was intended to check for predictors of visit times (i.e. an informative visit scheme) [22] . In four of the 6 studies, the reviewers inferred that visit times were in-formative: one study provided results demonstrating that age was a predictor of visiting [23]; a further three stud-ies reported predictors of the total length of follow-up
[24–26]; and in the remaining study, it was known by
design that high-risk patients were asked to visit more often [27].
Thirty-one of 44 articles (70%) used mixed models or repeated measures to analyze outcomes. In two cases data was reduced before using repeated measures (once
by taking a mean within pregnancy trimesters, once by using the first three measurements only). Only one study used a method specifically designed to handle inform-ative visit times, namely an inverse-intensity weighted GEE [2, 22] .
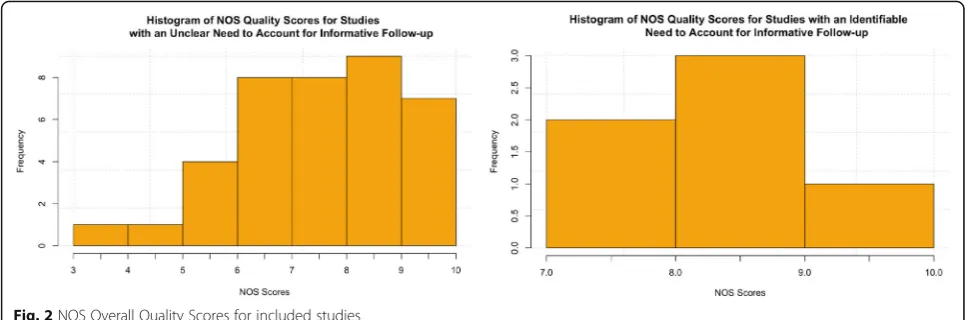
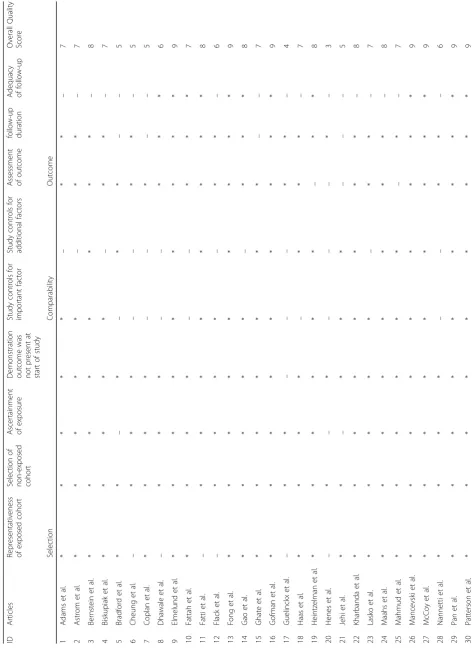
The mean overall quality score using NOS for all included studies is 7.11 with a standard deviation of 1.46. We found that 70%, 59% and 32% of included studies obtained maximum scores for each of the 3 subcategories of NOS which are selection, comparability and outcomes, respectively. A histogram of this data is depicted in Fig. 2 and the individual scores are available in Table 3.
Discussion
We conducted a systematic review of articles that used
longitudinal data collected as part of patients’usual care.
We found that reporting of variability in number or timing of visits was suboptimal, and reporting on the potential informativeness of visit times was rare. Furthermore, a method specifically designed to account for informativeness of visit times was used in just one of the 44 studies. On using the NOS scale to assess study quality, only 14 studies (32%) reported adequate cohort follow-up.
When visit times are irregular, it is important the investi-gate whether visit times are informative, that is, whether visit and outcome processes are dependent [2, 5]. This should also be reported on, so that the reader is aware of the scope for bias due to visit irregularity; this is very simi-lar to the need to investigate and report missingness mech-anisms when missing data is present [28, 29]. Only one study detailed analysis in the methods section designed to check for informativeness of the visit times, while in a further five studies informativeness was inferred by the reviewers but neither named as a potential source of bias nor accounted for in the analysis.
Our findings are consistent with an overall context of poor reporting. For example, a recent systematic review of studies using routinely collected health data found that reporting was poor, with 30% reporting study design in the title or abstract, and only 41% providing sufficient information to formulate a research question [30]. In the context of longitudinal prognostic studies in lupus, a systematic review found that 56% of studies had a high risk of bias with regards to attrition [31]. Only 43% of prospective cohort studies were found to have reported the amount of missing data [32], and only half of trials with missing longitudinal data explained the reasons for their choice of missing data method [33]. Given that this occurs despite considerable efforts to improve the report-ing of observational studies and missreport-ing data (includreport-ing the widely endorsed STROBE reporting guideline [28]), it is not surprising that few studies report on the degree and informativeness of irregular visits, for which there is no guidance in the literature.
Table 1Summary statistics on reporting of visit irregularity, predictors of visit times, and methods of analysis
Outcomes of Interest N (out of 44) % Study design
Prospective 10 23 Retrospective 31 70
Unclear 3 7
Clearly defined end of study
Yes 34 77
No 10 23
Comparison of those with and without full follow-up among studies with a clearly defined end of follow-up
(out of 34)
Yes 5 15
No 24 71
Not Applicable (all participants had full follow-up)
5 15
Method of analysis
Linear or logistic regression 8 18 Gaussian process regression 1 2 Repeated measures 11 25 Mixed model or generalized mixed
model
20 45
GEE 3 7
IIW-GEE 1 2
Reported summary statistics on
Number of visits per patient 25 57 Gaps between visits per patient 3 7 Follow-up time per patient 25 57 Predictors of visit time assessed
Yes 2 5
No 41 93
Unclear 1 2
Was there a need to account for informative visit times?
Yes 6 14
of which
Analysis specifically designed to check for informativeness
1 (out of 6) 18 Informativeness inferred by reviewers 5 (out of 6) 82
Unclear 38 86
Method used to account for informative visit times for studies with sufficient reporting of an identifiable need
(out of 6)
Yes 1 19
Poor reporting makes it impossible to determine defini-tively whether lack of use of methods for longitudinal data with irregular follow-up is due to lack of need. However, the inclusion/exclusion criteria were designed to capture studies with irregular follow-up, and for such studies the set of circumstances under which a simple GEE or linear mixed model leads to unbiased inferences is extremely narrow. For a GEE this requires visit times to be independ-ent of both past and future outcomes. This is generally implausible when data is collected as part of usual care, since usually patients will be seen more often when unwell. A linear mixed effects model yields unbiased estimates of regression coefficients in the presence of informative visit times only if the predictors of visit times are included in the mixed model [4]. Moreover, in the case of repeated mea-sures analysis the outcome should not be dependent on time if the timings of the visits vary. Some studies attempt to standardize the number of data points per patient used in regression models, e.g. by taking the mean measurement per patient per year. While this is effective at ensuring that each patient is equally represented, it overlooks the fact that certain types of measurement are likely over-represented. For example, if patients visit more often when unwell, then the mean of the observed measurements in any given year
over-estimates the patient’s burden of disease for that year.
We thus hypothesize that among the 44 studies identified, many did in fact need analytic techniques specifically designed to account for an informative visit process.
In each of the five papers that identified predictors of both visit times and outcomes but that did not use a method to account for the informative visit process, an inverse intensity weighted analysis was feasible. Such analyses could be made more accessible through availabil-ity of suitable software. Inverse intensavailabil-ity weighted GEEs can be fitted using PROC GENMOD in SAS or geeglm in R after calculating the intensity separately, but a one-step estimation function would be preferable. Similarly, there is no R package or set of SAS macros for fitting semi-parametric joint models.
While a 2015 Web of Science citation analysis suggested that methods that account for informative visit times had been used just three times in the medical literature, this review identified a fourth [22]. This paper was not identi-fied by the citation analysis as the reference to the inverse-intensity weighting method was incorrect (first and last author names were reversed).
The analysis of longitudinal data subject to irregular follow-up has been an active area of research in the past decade [2, 6, 7, 34, 35]. However, our findings suggest that knowledge of these methods has yet to be translated into medical research. These methods have received less attention than those used in handling missing data [34]. The uptake of biostatistical methods in medical research is facilitated through collaboration and the availability of software to implement these methods [36]. A proactive approach is needed to bridge the knowledge gap with respect to longitudinal data subject to irregular follow-up. There is also a need for standards for reporting longitudinal studies subject to irregular follow-up, both in terms of the extent of irregularity and its informative-ness. Improving the quality of reporting and using methods that account for the informative nature of the visit process will reduce the risk of bias and hence improve the quality of evidence in the medical literature.
Recommendations
The best way to avoid bias due to irregular observation is through study design. In a prospective study this can be accomplished by specifying visit times a priori. Some studies, however, follow clinic-based cohorts where visits are on an as-needed basis and vary among patients; add-ing additional study visits would substantially increase the cost of the study. Likewise, in a retrospective study the visit times are already set. In these cases, analysis should begin with an investigation of the variability of visit times, and by looking at whether there are any factors that predict visit frequency. The former can be accomplished by descriptive statistics on numbers of
Table
3
Newcastle-Ottawa
Score
for
included
studies
(Continued)
31
Pirraglia
et
al.
*
*
*
*
*
*
*
*
–
8
32
Roth
et
al.
*
*
*
–
**
*
*
*
8
33
Ruiz
et
al.
*
*
*
*
*
*
*
*
–
8
34
Sarafog
lou
et
al.
*
*
*
*
*
*
*
*
*
9
35
Schwartz
et
al.
*
*
*
*
*
*
*
*
–
8
36
Snijder
et
al.
*
*
–
**
*
*
*
–
7
37
Sy
et
al.
*
*
*
*
––
**
–
6
38
Tamayo
et
al.
*
*
*
*
*
*
*
*
–
8
39
Tanabe
et
al.
*
*
*
*
*
––
*
–
6
40
Ting
et
al.
–
**
–
**
*
*
*
7
41
Ullrich
et
al.
–
**
*
*
*
–
*
–
6
42
Walker
et
al.
*
*
*
–
**
–
*
–
6
43
Wong
et
al.
*
*
*
*
*
*
*
*
–
8
44
Zechma
nn
et
al.
*
*
*
*
––
**
–
visits and gaps between visits, and the latter by a recur-rent event analysis on the visit times. If important predictors of visit frequency are found, a method that accounts for the informativeness of visit times should be used. Such methods include inverse intensity weighting
[2, 8–10] and semi-parametric joint models [11–14]. See
Pullenayegum & Lim [5] for a review together with guid-ance on when to use each method.
Conclusion
We found a low proportion of studies reporting on the potential informativeness of visit times. There is a need for guidance to researchers on the potential for bias and the reporting of longitudinal studies subject to irregular follow-up.
Additional file
Additional file 1:Search strategy and the list of eligible articles. (DOCX 21 kb)
Abbreviations
BMI:Body mass index; DBS: Deep-brain stimulation; GGE: Generalized Estimating
Eqs.; HDL: High-density lipoprotein; IIW: Inverse-intensity weighing
Acknowledgements Not applicable.
Funding
This work was funded through a Discovery Grant from the Natural Sciences
and Engineering Research Council, and through the University of Toronto’s
Work-Study program. EMP received a salary award from the Canadian Institutes of Health Sciences.
Availability of data and materials
All data generated or analyzed during this study are included in this
published article’s Additional file 1.
Authors’contributions
DF and EP designed the study, drafted and revised the manuscript and participated in literature search and review. ES, JK, AA, YW: participated in abstract and full-text reviews from Embase based on the eligibility criteria and provided reasons for exclusions. All authors read and approved the final manuscript.
Ethics approval and consent to participate Not applicable.
Consent for publication Not applicable.
Competing interests
The authors declare that they have no competing interests.
Publisher’s Note
Springer Nature remains neutral with regard to jurisdictional claims in published maps and institutional affiliations.
Author details
1University Health Network, University of Toronto, Toronto M5T 2S8, Canada. 2Institute of Medical Science, University of Toronto, City, ON M5S 1A8,
Canada.3Faculty of Arts & Science, University of Toronto, City, ON M5S 3G3, Canada.4Child Health Evaluative Sciences, The Hospital for Sick Children,
Toronto, ON M5G 1X8, Canada.5Dalla Lana School of Public Health,
University of Toronto, City, ON M5T 3M7, Canada.
Received: 27 February 2017 Accepted: 31 August 2017
References
1. Worster A, Haines T. Advanced statistics: understanding medical record
review (MRR) studies. Acad Emerg Med. 2004;11:187–92.
2. Lin HQ, Scharfstein DO, Rosenheck RA. Analysis of longitudinal data with
irregular, outcome-dependent follow-up. J Roy Stat Soc B. 2004;66:791–813.
3. Zeger SL, Liang KY. Longitudinal data analysis for discrete and continuous
outcomes. Biometrics. 1986;42:121–30.
4. Lipsitz SR, Fitzmaurice GM, Ibrahim JG, Gelber R, Lipshultz S. Parameter
estimation in longitudinal studies with outcome-dependent follow-up.
Biometrics. 2002;58:621–30.
5. Pullenayegum EM, Lim LSH. Longitudinal data subject to irregular
observation: A review of methods with a focus on visit processes,
assumptions, and study design. Stat Methods Med Res. 2016;25(6):2992–
3014. https://doi.org/10.1177/0962280214536537.
6. Lin D, Ying Z. Semiparametric regression analysis of longitudinal data with
informative drop-outs. Biostatistics. 2003;4:385–98.
7. Lin D, Ying Z. Semiparametric and nonparametric regression analysis of
longitudinal data. J Am Stat Assoc. 2001;96:103–26.
8. Buzkova P, Brown ER, John-Stewart GC. Longitudinal data analysis for generalized
linear models under participant-driven informative follow-up: an application in
maternal health epidemiology. Am J Epidemiol. 2010;171:189–97.
9. Buzkova P, Lumley T. Semiparametric modeling of repeated measurements
under outcome-dependent follow-up. Stat Med. 2009;28:987–1003.
10. BU̇rŽKOVÁ P, Lumley T. Longitudinal data analysis for generalized linear
models with follow-up dependent on outcome-related variables. Canadian
Journal of Statistics. 2007;35:485–500.
11. Sun J, Sun L, Liu D. Regression analysis of longitudinal data in the presence
of informative observation and censoring times. J Am Stat Assoc. 2007;102:
1397–406.
12. Sun L, Song X, Zhou J. Regression analysis of longitudinal data with
time-dependent covariates in the presence of informative observation and censoring
times. Journal of Statistical Planning and Inference. 2011;141:2902–19.
13. Cai N, Lu W, Zhang HH. Time-varying latent effect model for longitudinal
data with informative observation times. Biometrics. 2012;68:1093–102.
14. Song X, Mu X, Sun L. Regression analysis of longitudinal data with
time-dependent covariates and informative observation times. Scand J Stat.
2012;39:248–58.
15. Arterburn DE, et al. A multisite study of long-term remission and relapse of
type 2 diabetes mellitus following gastric bypass. Obes Surg. 2013;23:93–102.
16. Alley DE, et al. Meaningful improvement in gait speed in hip fracture
recovery. J Am Geriatr Soc. 2011;59:1650–7.
17. Miller RR, et al. Association between Interleukin-6 and lower extremity
function after hip fracture—the role of muscle mass and strength. J Am
Geriatr Soc. 2008;56:1050–6.
18. Booth A, et al. The nuts and bolts of PROSPERO: an international
prospective register of systematic reviews. Systematic reviews. 2012;1:2.
19. Booth A, et al. An international registry of systematic-review protocols.
Lancet. 2011;377:108–9.
20. Cohen J. A coefficient of agreement for nominal scales. Educ Psychol Meas.
1960;20:37–46.
21. Wells, G.,et al. Newcastle-Ottawa Quality Assessment Scale, Cohort
Studies. in 2015–11-19]; 2014. http://www.ohri.ca/programs/clinical_
epidemiology/oxford.asp.
22. Wong ES, et al. BMI trajectories among the severely obese: results from an
electronic medical record population. Obesity. 2012;20:2107–12.
23. Ullrich PM, et al. Pain, depression, and health care utilization over time after
spinal cord injury. Rehabil Psychol. 2013;58:158–65.
24. Fatti G, et al. Increased vulnerability of rural children on antiretroviral
therapy attending public health facilities in South Africa:
A retrospective cohort study. J Int AIDS Soc. 2010;13(1):46. https://doi.org/ 10.1186/1758-2652-13-46.
25. Gao S, et al. Redefined blood pressure variability measure and its
association with mortality in elderly primary care patients. Hypertension.
2014;64:45–52.
26. Mancevski B, et al. Lifelong course of positive and negative symptoms in
chronically institutionalized patients with schizophrenia. Psychopathology.
27. Haas WC, Moore JB, Kaplan M, Lazorick S. Outcomes from a medical weight loss program: primary care clinics versus weight loss clinics. Am J Med.
2012;125(603):e607–11.
28. Von Elm E, et al. The strengthening the reporting of observational studies in
epidemiology (STROBE) statement: guidelines for reporting observational
studies. Prev Med. 2007;45:247–51.
29. Burton A, Altman DG. Missing covariate data within cancer prognostic
studies: a review of current reporting and proposed guidelines. Br J Cancer.
2004;91:4–8.
30. Hemkens LG, et al. The reporting of studies using routinely collected health
data was often insufficient. J Clin Epidemiol. 2016;
31. Lim LS, et al. Systematic review of the quality of prognosis studies in
systemic lupus erythematosus. Arthritis care & research. 2014;66:1536–41.
32. Karahalios A, Baglietto L, Carlin JB, English DR, Simpson JA. A review of the
reporting and handling of missing data in cohort studies with repeated assessment of exposure measures. BMC Med Res Methodol. 2012;12:1.
33. Powney M, Williamson P, Kirkham J, Kolamunnage-Dona R. A review of
the handling of missing longitudinal outcome data in clinical trials. Trials. 2014;15:1.
34. Hogan JW, Roy J, Korkontzelou C. Handling drop-out in longitudinal studies.
Stat Med. 2004;23:1455–97.
35. Lin Y, Ovaert TC. The stress and displacement fields produced in a
semi-infinite solid by a uniform heat source over a rectangular area on the
surface. J Tribol-T Asme. 2003;125:709–12.
36. Nietert PJ, Wahlquist AE, Herbert TL. Characteristics of recent biostatistical
methods adopted by researchers publishing in general/internal medicine journals. Stat Med. 2013;32:1.
• We accept pre-submission inquiries
• Our selector tool helps you to find the most relevant journal
• We provide round the clock customer support
• Convenient online submission
• Thorough peer review
• Inclusion in PubMed and all major indexing services
• Maximum visibility for your research
Submit your manuscript at www.biomedcentral.com/submit