Available Online at www.ijpret.com 16
INTERNATIONAL JOURNAL OF PURE AND
APPLIED RESEARCH IN ENGINEERING AND
TECHNOLOGY
A PATH FOR HORIZING YOUR INNOVATIVE WORKLOW COMPLEXITY IMPLEMENTATION OF GAS DENSITY SENSING USING
DYNAMIC STRAIN MEASUREMENT
TANUSHREE CHAUDHURY
Department of Mechanical Engineering, MITS, Rayagada, Odisha.
Accepted Date: 05/11/2017; Published Date: 01/12/2017
\
Abstract: - Gas density measurement is one of the vital requirement of process industry. Traditional gas density sensors are based on two matched quartz resonators whose frequency difference is a function of density of medium. Accuracy of those sensors is limited by the mismatch between quartz crystals and need expensive Phase Locked Loop (PLL) based circuitry. Instead of measuring frequency error, strain measurement is a simpler alternative as the maximum strain will occur in any resonator near its resonant frequency. Strain exerted on the microcantilever depends on the damping provided by the medium which is a function of gas density. In this paper, it is proposed to monitor gas density variation with time by measuring strain exerted on microcantilevers during dynamic mode operation. The microcantilever is designed and simulated using COMSOL to determine the strain exerted at various points. The proposed method is experimentally validated using a low-cost polymer based microcantilever. The results show that the proposed method is highly feasible to detect gas density variation in real time and can be implemented for applications like detecting gas leakage out of a closed chamber without sophisticated infrastructure and highly skilled manpower.
Keywords: Gas density monitoring, micromechanical resonator, hydrodynamic force, dynamic strain measurement, gas leakage detection.
Corresponding Author: MS. TANUSHREE CHAUDHURY Access Online On:
www.ijpret.com
How to Cite This Article:
Tanushree Chaudhury, IJPRET, 2017; Volume 6 (4): 16-30
Available Online at www.ijpret.com 17 INTRODUCTION
Density monitoring plays an important role in many process applications [1]. Gas density monitoring can be a suitable alternative for in-situ gas composition determinationwhen conventional methods like gas chromatography and mass spectroscopy are not viable. Mechanical resonator based sensors in the form of quartz tuning forks are generally used for direct density measurement [2]. Most of the density sensors commercially available are suitable for liquid medium and have poor sensitivities when used in gaseous medium [3]. Those resonators operate on the principle that the added mass of the fluid layers adhering to the resonating device (fork prongs, cantilever) cause a shift in the resonating frequency which is conveniently measured [4]. These devices are constructed with dense material and are less sensitive for gas density and composition measurement. The performance and characteristics of those sensors are not uniform and dependent on manufacturing process variations.
With the recent developments in micromachining, microcantilevers have emerged as a suitable option for density measurement. Micromachined silicon based resonators are fabricated by standard processes with one wafer stack and can give highly precise density measurements. Unlike the traditional density meters and quartz tuning forks which are individually fabricated, micromachined silicon-based resonators undergo batch fabrication and have uniform properties. This batch fabrication method also reduces the cost of manufacturing enabling a wider use of density sensor technology [5].
Microcantileversbelong to the family of micromachined resonator and are widely used for viscosity and density sensing applications in liquid medium. Microcantilever based sensors have high surface-to-volume ratio which leads to better measurement sensitivity in both gas and liquid phases. Generally, uncoated microcantileversare used for fluid density measurement. These sensors can also be used for chemical detection as the variation of the gas density can reflect the variation of a chemical species concentration in a gas mixture [6]. Piezoelectric-excited uncoated millimeter-sized cantilevers have been shown to be sensitive for biosensing and can measure liquid densities with sensitivity of 2µg/cm3 [7,8]. Uncoated microcantilevers overcome several shortcomings of the coated ones such as long-time response, drift and aging effects. However, uncoated microcantilevers are non-selective and have low sensitivities, which make it very difficult to detect small concentration or density changes.
Available Online at www.ijpret.com 18
surface stress larger deflections can occur [9].Magnitude of cantilever deflection can also be improved by reducing the bending stiffness of the cantilever or by using softer cantilever materials [10]. Reducing the stiffness lowers the resonant frequency as the resonant frequency is proportional to the square root of the stiffness.For better signal-to-noise ratio, and measurement sensitivity, higher resonant frequency is required [11,12]. As a result, the designer has to find a balance between high resonant frequency and high deflection.
In this paper,itis proposed to monitorgas density variation by measuring the strain exerted on the cantilever during dynamic operation.State-of-the-art gas density sensors use identical tuning forks whose accuracy is limited by the crystal mismatch. They also require expensive Phase Locked Loop based frequency detection circuitry. Instead of measuring frequency error, strain measurement is proposed as a simpler alternative. The maximum strain will occur in any resonator near its resonant frequency.Instead of measuring change in frequency near resonant frequency, it is proposed to measure change in strain near resonant frequency. The sensor is made of soft cantilever material (polyimide)for higher deflection and easier measurement of dynamic strain.This low complexity method hasbeen implemented without sophisticated fabrication facilities, expensive instrumentation setup and highly skilled manpower.The major contribution is in using an existing model of hydrodynamic force distribution in microcantilever for sensing purpose.
The outline of the paper is as follows. In section 2, the theoretical foundation is laid for the modelling of hydrodynamic force acting on microcantilevers. In section 3, algorithm is developed to calculate hydrodynamic force acting on microcantilevers during dynamic mode operation. Finite element based model of microcantilever is developed and strain values are plotted in section 4. The proposed low complexity method has been demonstrated byan experimental setup and variation in strain due to gas density variation has been demonstrated.
1. MATERIALS & METHODS
Available Online at www.ijpret.com 19
high accuracy for the fundamental mode and lower modes.For practical microcantilevers with high aspect ratios, operating at lower frequencies, the flow is approximately two-dimensional.
L
b z
y
x
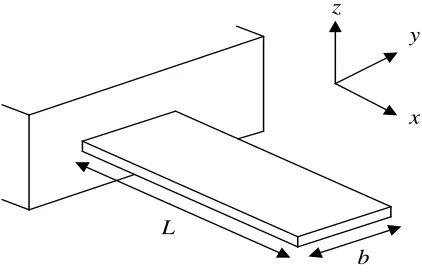
Figure 1: Cantilever beam schematic
A cantilever beam of arbitrary cross section is shown in Figure 1, and following assumptions are made to satisfy the conditions of incompressible two dimensional flows during dynamic operation [17].
1. The cross section of the beam is uniform over its entire length
2. The length of the beam L greatly exceeds its nominal width b.
3. The beam is an isotropic linearly elastic solid with negligible internal frictional effects.
4. The amplitude of vibration of the beam is far smaller than any length scale in the beam geometry.
5. The cantilever vibrates in flexural mode (for low frequency range).
6. The vibration is of low mode order (for two dimensional flow theory to hold and for incompressibility assumption).
Available Online at www.ijpret.com 20
acting on the beam will be a linear function of its displacement. The net force acting on microcantilever at distance x from fixed end, denoted by F(x|ω) is segregated into two components[18]:
𝐹(𝑥|𝜔) = 𝐹ℎ𝑦𝑑𝑟𝑜(𝑥|𝜔) + 𝐹𝑑𝑟𝑖𝑣𝑒(𝑥|𝜔) ...(1)
The first component 𝐹ℎ𝑦𝑑𝑟𝑜(𝑥|𝜔)is hydrodynamic loading component due to motion of the fluid around the beam; whereas the second one𝐹𝑑𝑟𝑖𝑣𝑒(𝑥|𝜔) is driving force that excites the
beam.
The general form of 𝐹ℎ𝑦𝑑𝑟𝑜(𝑥|𝜔)is given by [18]:
𝐹ℎ𝑦𝑑𝑟𝑜(𝑥|𝜔) = 𝜋
4𝜌𝜔
2𝑏2𝛤(𝜔)𝑊(𝑥|𝜔) ...(2)
Where
𝜌 ∶ Density of medium
𝜔 ∶ Frequency of operation
𝑏 ∶ Width of microcantilever
𝛤(𝜔) ∶ Hydrodynamic function
𝑊(𝑥|𝜔) ∶ Displacement function
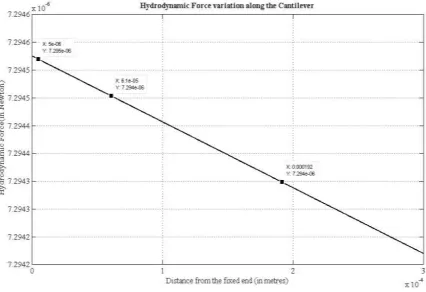
As depicted in Figure 2, 𝐹ℎ𝑦𝑑𝑟𝑜 is a function of fluid density 𝜌. 𝐹ℎ𝑦𝑑𝑟𝑜 acts as a damping force during the vibrational motion of microcantilever. Net force acting on the microcantilever is resultant of excitation force and damping force. Theoretically, for forced vibrations, damping force is zero at the extremities and equal to the force of excitation at zero amplitudes. It signifies that the damping force undergoes a periodic change in value while the excitation force is constant (for small amplitudes). This periodic change in damping force can be experimentally measured with the help of strain analysis.
METHODOLOGY
Available Online at www.ijpret.com 21
the hydrodynamic force model, an algorithm is developed in MATLAB to determine damping force acting on the microcantilever at different positions. The results computed by the algorithm are compared with the stress results derived on COMSOL. The algorithm based on hydrodynamic force determination from [18] is given below in Table 1.
Table 1: Algorithm for calculation of hydrodynamic force
Sr No.
Description
1. Input the values of dimension 𝑳, 𝒃, 𝒕 of microcantilever
2. Input the values of density ρ, viscosity η, frequency ω
3. Input the values of amplitude of oscillation 𝒁𝟎, speed of sound c, position from origin x
4. Input the values of applied excitation voltage V and separation from ground plane d
5. Calculate Reynold’s number given by
𝑹𝒆 = 𝝆𝝎𝒃
𝟐
𝟒𝜼
6. Calculate modified Bessel’s function of second kind 𝑲𝟎 and 𝑲𝟏
7. Calculate hydrodynamic function for a circular cantilever 𝜞𝒄𝒊𝒓𝒄(𝝎) given by
𝜞𝒄𝒊𝒓𝒄(𝝎) = 𝟏 +
𝟒𝒊𝑲𝟏(−𝒊√𝒊 𝑹𝒆)
√𝒊 𝑹𝒆𝑲𝟎(−𝒊√𝒊 𝑹𝒆)
8. Calculate
𝝉 = 𝒍𝒐𝒈𝟏𝟎𝑹𝒆
9. Calculate
Ω𝒓 (𝝎 =
(𝟎. 𝟗𝟏𝟑𝟐𝟒 − 𝟎. 𝟒𝟖𝟐𝟕𝟒𝝉 + 𝟎. 𝟒𝟔𝟖𝟒𝟐𝝉𝟐− 𝟎. 𝟏𝟐𝟖𝟖𝟔𝝉𝟑+ 𝟎. 𝟎𝟒𝟒𝟎𝟓𝟓𝝉𝟒− 𝟎. 𝟎𝟎𝟑𝟓𝟏𝟏𝟕𝝉𝟓+ 𝟎. 𝟎𝟎𝟎𝟔𝟗𝟎𝟖𝟓𝝉𝟔 )
(𝟏 − 𝟎. 𝟓𝟔𝟗𝟔𝟒𝝉 + 𝟎. 𝟒𝟖𝟔𝟗𝟎𝝉𝟐− 𝟎. 𝟏𝟑𝟒𝟒𝟒𝝉𝟑+ 𝟎. 𝟎𝟒𝟓𝟏𝟓𝟓𝝉𝟒− 𝟎. 𝟎𝟎𝟑𝟓𝟖𝟔𝟐𝝉𝟓+ 𝟎. 𝟎𝟎𝟎𝟔𝟗𝟎𝟖𝟓𝝉𝟔 )
10. Calculate
Ω𝒊(𝝎) =
(−𝟎. 𝟎𝟐𝟒𝟏𝟑𝟒 − 𝟎. 𝟎𝟐𝟗𝟐𝟓𝟔𝝉 + 𝟎. 𝟎𝟏𝟔𝟐𝟗𝟒𝝉𝟐− 𝟎. 𝟎𝟎𝟎𝟏𝟎𝟗𝟔𝟏𝝉𝟑+ 𝟎. 𝟎𝟎𝟎𝟎𝟔𝟒𝟓𝟕𝟕𝝉𝟒− 𝟎. 𝟎𝟎𝟎𝟎𝟒𝟒𝟓𝟏𝟎𝝉𝟓 )
(𝟏 − 𝟎. 𝟓𝟗𝟕𝟎𝟐𝝉 + 𝟎. 𝟓𝟓𝟏𝟖𝟐𝝉𝟐− 𝟎. 𝟏𝟖𝟑𝟓𝟕𝝉𝟑+ 𝟎. 𝟎𝟕𝟗𝟏𝟓𝟔𝝉𝟒− 𝟎. 𝟎𝟏𝟒𝟑𝟔𝟗𝝉𝟓+ 𝟎. 𝟎𝟎𝟐𝟖𝟑𝟔𝟏𝝉𝟔 )
11. Calculate correction factor Ω(𝝎) given by
Ω(𝝎) = Ω𝒓(𝝎) + 𝒊Ω𝒊(𝝎)
12. Calculate hydrodynamic function for rectangular cantilever 𝜞𝒓𝒆𝒄𝒕(𝝎) given by
Available Online at www.ijpret.com 22
13. Calculate normalized mode number given by
ĸ = 𝑪𝒏
𝒃
𝑳 𝒘𝒉𝒆𝒓𝒆 𝑪𝒏= (𝒏 + 𝟏 𝟐⁄ )𝝅
14. Calculate deflection function given by
𝑾(𝒙|𝝎) = 𝒁𝟎𝒆𝒊 ĸ𝒙
15. Calculate hydrodynamic force acting on the microcantilever per unit area at distance x from the origin by
𝑭𝒉𝒚𝒅𝒓𝒐(𝒙|𝝎) =
𝝅
𝟒𝝆𝝎
𝟐𝒃𝟐𝜞(𝝎)𝑾(𝒙|𝝎)
RESULTS AND DISCUSSIONS 3.1 Simulation Results
In this section, the values of hydrodynamic force are presented for different Eigen frequencies of finite element model of silicon microcantilever developed in COMSOL Multiphysics platform.
Table 2: Hydrodynamic values for different Eigen frequencies
Eigen frequency (kHz) Maximum Hydrodynamic force (Newton)
23.3 38.635×10⁻⁶
1693.7 12.6×10⁻²
Available Online at www.ijpret.com 23 Figure 2: Graph showing variation in Hydrodynamic force along length of cantilever
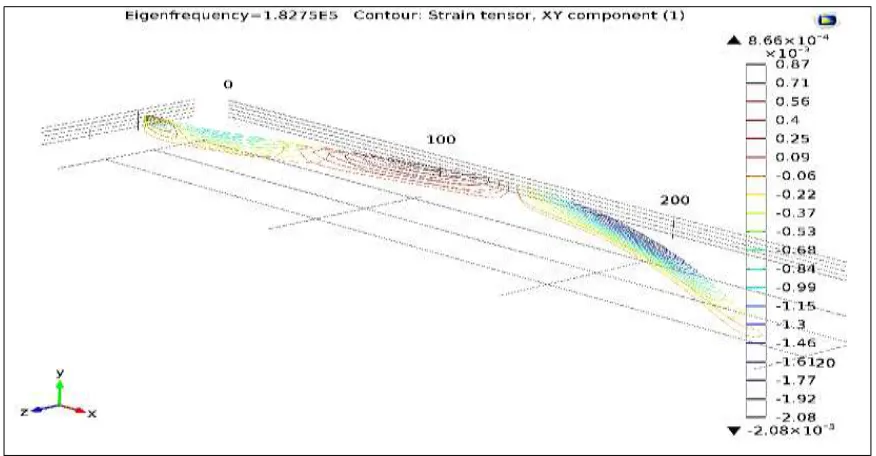
Available Online at www.ijpret.com 24 Figure 3 (a): Graph showing Principal stress plot on the microcantilever
Figure 3 (b): Graph showing Corresponding strain plot on the microcantilever 3.2 Experimental validation
Available Online at www.ijpret.com 25
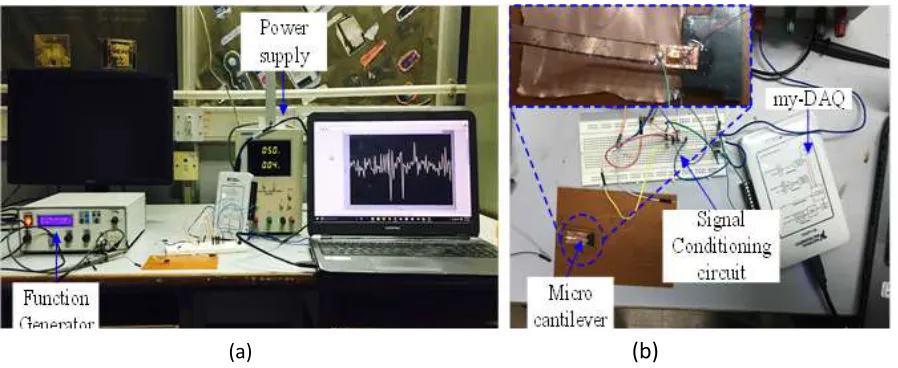
mounted end fixed with adhesive. Connections were made from the strain gauge to signal conditioning circuit as shown in Figure 4. Themicrostrain gauge is placed very close to the fixed end of the cantilever as shown in Figure 4(b). The cantilever is excited with a triangular time varying ac excitation voltage generated by the function generator as shown in Figure 4(a).
Figure 4: (a) Experimental setup (b)Polymide based microcantilever data acquisition circuit
The excitation voltage is applied between the cantilever strip and the underlying substrate. The periodic variation in strain output of the electrically actuated cantilever is measured by the strain gauge. The strain gauge output is fed to a signal conditioning circuit comprising of Wheatstone bridge and Texas Instruments INA 128 low power instrumentation amplifier. The output of the amplifier is connected to the analog input of NI myDAQ which is a data acquisition module. The signal is acquired through LabVIEW and applied to a bandpassFIR filter to eliminate the superimposed noise. The center frequency of the bandpass filter is same as the excitation frequency. The block diagram made on LabVIEW to acquire, filter and plot the output dynamic strain signal is given below in Figure 5.
Available Online at www.ijpret.com 26 Figure 5: Block diagram of the data acquisition system on LabView
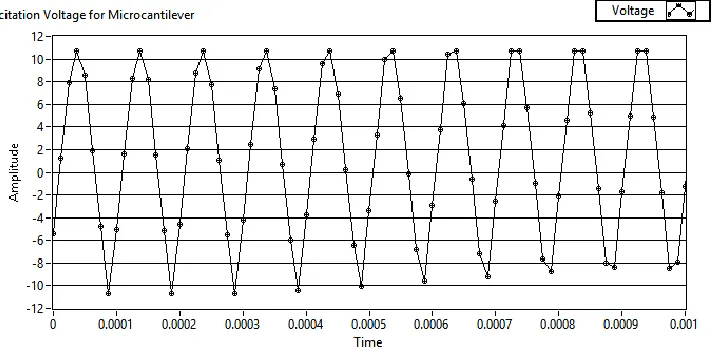
The excitation voltage applied to the microcantilever is 10V triangular wave at 10 kHz applied by a function generator as shown in Figure 6.The values for excitation voltage and frequency was chosen empirically by reading the strain output values. A strain output of the order of 10-3 and microcantilever dimension of 20mm corresponds to vibrational amplitude of 20 microns which satisfies the assumption made in the model.
Figure 6: Excitation voltage applied to the micorcantilever
Available Online at www.ijpret.com 27
center frequency same as the excitation frequency. The dynamic strain output at different time instants is plotted as shown in Figure 7 to 9.
Figure 7: Dynamic strain output at time instant t1 (a) Unfiltered (b) Filtered
Figure 8: Dynamic strain output at time instant t2 (a) Unfiltered (b) Filtered
Figure 9: Dynamic strain output at time instant t3 (a) Unfiltered (b) Filtered
Available Online at www.ijpret.com 28
fact that the cantilever is exposed to the atmosphere. It indicates that about 20-30% variation in density due to drift of air is causing the variation in the peak values of strain output.Based on these observations, it can be inferred that the proposed algorithm can be used for estimation of gas density variation with results comparable to FEM simulation. The copper coated polyimide cantilever based experimental setup demonstrates that the expensive optical setup for measuring the vibrational amplitude can be replaced by simpler method of dynamic strain measurement with a reasonable tradeoff of accuracy versus cost.
CONCLUSION
In this paper, a low complexity method has been presented to monitor gas density variations by dynamic strain measurement. The proposed method uses a polyimide based microcantilever and the hydrodynamic force is measured using NI myDAQ and LabVIEW. There is no need of fabrication of exactly matched quartz crystals and expensive PLL based circuitry for frequency error determination. This method does not require sophisticated infrastructure or highly skilled manpower for sensor fabrication and signal conditioning. The experimental results demonstrate the fact that variation in gas density with time can be monitored using a very simple strain measurement setup. This experimental validation only serves the purpose of reinforcing the authors’ idea that by detecting variation in strain as a function of time, one can easily get an indication of change in density with time. The indicative values suggest a tradeoff of high accuracy with cost and complexity but still serves the purpose of real time air density monitoring.It is capable of simpler and cheaper gas density monitoring, thus taking a step forward in the direction of low cost pervasive sensing.
REFERENCES
1. Toledo, J., Manzaneque,T., Garcia J.H. et.al. “Application of quartz tuning forks and extensional microresonators for viscosity and density measurements in oil/fuel mixtures”, Microsystem Technology, 2014, 20, pp.-945–953.
2. Zeisel, D., Menzi, H. and Ullrich, L. “A precise and robust quartz sensor based on tuning fork technology for SF6 gas density control”, Sensors and Actuators, 2000, 80, pp. 233-236
3. Sparks, D., Smith, R., Patel, J et.al, “A MEMS-based low pressure, light gas density and binary concentration sensor”, Sensors and Actuators A, 2011, 171, pp. 159-162.
Available Online at www.ijpret.com 29
5. Choudhury, T., Biswal, G.R., “SF6 density and viscosity sensing in Gas Insulated Switchgear using MEMS resonator”, IEEE International Conference on Power electronics, Intelligent control and Energy systems, 2016, Delhi, India.
6. Rosario, R. and Mutharasan, R. “Piezoelectric excited millimeter sized cantilever sensors for measuring gas density changes”, Sensors and Actuators B, 2014,192, pp. 99-104.
7. Manzaneque, T, Diez, V.R., Garcia, J.H., et.al “Piezoelectric MEMS resonator-based oscillator for density and viscosity sensing”, Sensors and Actuators A, 2014, 220, pp. 305-315.
8. Kramer, A. and Paul,T.A., “High-precision density sensor for concentration monitoring of binary gas mixtures”, Sensors and Actuators A, 2013, 202, pp. 52-56.
9. Boudjieta, M.T., Bertrandb, J., Mathieu F. et al, “Geometry optimization of uncoated silicon microcantilever-based gasdensity sensors”, Sensors and Actuators B, 2015, 208, pp- 600–607.
10. Singamaneni, S., Melburne, C, Hans, P., “BimaterialMicrocantilevers as a Hybrid Sensing Platform”, Advanced Materials, Wiley Interscience,2008, 20, pp.-653–680
11. Cakmak, O, Ermek, E., Kilinc, N. et.al., “Precision density measurement using two cantilevers with different widths”, Sensors and Actuators A, 2015, 232, pp. 141-147.
12. Narducci, M., Figueras, E, Lopez M.J. et.al, “Sensitivity improvement of a microcantilever based mass sensor”, Microelectronic. Engineering, 2009, 86, pp-1187–1189.
13. Basak, S., Raman, A., Garimella, S.V. “Hydrodynamic loading of microcantilevers vibrating in viscous fluids”, Journal of Applied Physics, 2006, 99, pp 114906.
14. Korayem, M. H., Ghaderi, R. “Vibration response of an atomic force microscopy piezoelectrically actuated microcantileverin liquid environment”, IET Micro & Nano Letters, 2013, 8, pp. 229 – 233
15. Bashmal, S., Oke, W.A., Khulief, Y., “Vibration analysis of an elastically restrained microcantilever beam under electrostatic loading using wavelet-based finite element method” Micro & Nano Letters, 2015,10, pp-147 – 152.
Available Online at www.ijpret.com 30
17. Chang, W.J., Yang, Y.C., Lee, H.L., “Dynamic behaviour of atomic force microscope-based nanomachining based on a modified couple stress theory”, Micro & Nano Letters, 2013, 8, pp-832 - 835.
18. Tétin, S., Caillard, B, Ménil, F. et.al., “Modeling and performance of uncoated microcantilever-based chemical sensors”, Sensors and Actuators B, 2010, 143. pp- 555–560.
19. Eysden, C.A.V. and Sader, J.E, “Frequency response of cantilever beams immersed in viscous fluids with applications to the atomic force microscope”, Journal of Applied .Physics, 1998,84, pp. 64-76,.
20. Ansari, M.Z. and Cho, C., “Deflection, frequency, and stress characteristics of rectangular, triangular, and step profile microcantilevers for biosensors”, Sensors, 2009, 9, pp-6046–6057.