University of New Orleans University of New Orleans
ScholarWorks@UNO
ScholarWorks@UNO
University of New Orleans Theses and
Dissertations Dissertations and Theses
Summer 8-6-2013
An Applied Numerical Simulation of Entrained-Flow Coal
An Applied Numerical Simulation of Entrained-Flow Coal
Gasification with Improved Sub-models
Gasification with Improved Sub-models
Xijia Lu
University of New Orleans, [email protected]
Follow this and additional works at: https://scholarworks.uno.edu/td
Part of the Applied Mechanics Commons, Computer-Aided Engineering and Design Commons, Energy Systems Commons, and the Heat Transfer, Combustion Commons
Recommended Citation Recommended Citation
Lu, Xijia, "An Applied Numerical Simulation of Entrained-Flow Coal Gasification with Improved Sub-models" (2013). University of New Orleans Theses and Dissertations. 1696.
https://scholarworks.uno.edu/td/1696
This Dissertation is protected by copyright and/or related rights. It has been brought to you by ScholarWorks@UNO with permission from the rights-holder(s). You are free to use this Dissertation in any way that is permitted by the copyright and related rights legislation that applies to your use. For other uses you need to obtain permission from the rights-holder(s) directly, unless additional rights are indicated by a Creative Commons license in the record and/ or on the work itself.
An Applied Numerical Simulation of Entrained-Flow Coal Gasification with Improved Sub-models
A Dissertation
Submitted to the Graduate Faculty of the University of New Orleans in partial fulfillment of the requirements for the degree of
Doctor of Philosophy in
Engineering and Applied Sciences
By
Xijia Lu
B.S. Hefei University of Technology, 2006
M.S. University of Science and Technology of China, 2009
ii
ACKNOWLEDGEMENTS
First and the foremost, I would like to thank Dr. Ting Wang for his constant support and
dedication to helping me with my research. Dr. Wang is an inspirational instructor and a
dedicated mentor. I would not have been able to make it this far without his constant support,
wisdom, and patience. I would like to also thank Dr. Bhaskar Kura, Dr. Kazim Akyuzlu, Dr.
Linxiong Li, and Dr. Carsie Hall for serving on my dissertation committee.
I would also like to thank the Department of Energy for its financial support and to
acknowledge the support from the Louisiana Governor’s Energy Initiative, administered by both
the Clean Power and Energy Research Consortium (CPERC) and the Louisiana Board of
Regents.
I would like to thank my colleagues, Dr. Jobaidur Kahn, Dr. Lei Zhao, Dr. Armin Silaen,
Mr. Henry A. Long, and all others working for UNO’s Energy Conversion and Conservation
Center (ECCC) for all of their help.
Finally, I would like to thank my family and friends for their supports and
encouragements during the difficult times. Most of all, I would like to thank my wife, Danqian
iii
TABLE OF CONTENTS
LIST OF FIGURES ... viii
LIST OF TABLES ... xiii
NOMENCLATURE ... xvii
ABSTRACT ... xix
CHAPTER 1 INTRODUCTION ... 1
1.1 Background ... 1
1.2 Literature Review... 4
1.2.1 History of Gasification ... 4
1.2.2 Gasification Global Reactions ... 4
1.2.3 Types of Gasifier... 5
1.2.3.1 Fluidized-Bed Gasifier ... 6
1.2.3.2 Moving-Bed Gasifier ... 10
1.2.3.3 Entrained-Flow Gasifier... 12
1.2.3.4 Transport Gasifier ... 24
1.2.4 Gasifiers for Special Applications ... 26
1.2.4.1 Advanced Coal Gasifiers ... 26
1.2.4.2 Westinghouse Plasma Corporation (WPC) Plasma Arc Gasifier ... 28
1.2.4.3 Catalytic Gasifiers ... 30
1.2.4.4 Underground Coal Gasification (UCG) ... 31
1.2.5 Coal Combustion or Gasification... 33
1.2.5.1 Coal Structure ... 34
1.2.5.2 Coal Devolatilization ... 35
1.2.5.3 Carbon Particle Combustion ... 38
1.2.5.4 Modeling Particle Combustion ... 40
1.2.5.5 Carbon Combustion Reaction Rates ... 42
1.2.5.6 Numerical Simulation Models of Coal Combustion ... 44
1.2.5.7 Numerical Simulation Models of Coal Gasification ... 46
1.3 Objectives and Specific Goals ... 53
2 COMPUTATIONAL MODEL ... 54
2.1 Problem Statement ... 54
2.2 Governing Equations for Continuous Phase ... 55
2.3 Turbulence Model ... 56
2.3.1 Standard k-ε Model ... 56
2.3.2 Reynolds Stress Model ... 60
2.3.3 Other Models ... 61
2.4 Radiation Model... 62
2.5 Discrete Phases (Solid Particles or Liquid Particles) ... 63
2.5.1 Coal Particles ... 64
2.5.1.1 Devolatilization Model ... 64
iv
2.5.3Stochastic Tracking ... 68
2.6 Reaction Models ... 69
2.6.1 Particle Reactions... 69
2.6.2 Gas Phase (Homogeneous Phase) Reactions ... 70
2.7 Gasification Models ... 72
2.7.1 Finite-Rate Model ... 72
2.7.2 Instantaneous Gasification Model... 73
3 COMPUTATIONAL MODEL ... 74
3.1 Computational Scheme ... 74
3.1.1 Preprocessing ... 74
3.1.2 Processing ... 74
3.1.3 Postprocessing... 74
3.2 Numerical Procedures ... 75
4 TOPIC 1: WATER-GAS SHIFT MODELING IN COAL GASIFICATION IN AN ENTRAINED-FLOW GASIFIER ... 83
4.1 Introduction ... 83
4.1.1 Reviews of WGS Reaction Rates ... 84
4.1.1.1 WGS Catalytic Reactions ... 84
4.1.1.2 WGS Non-Catalytic Reactions ... 88
4.1.1.3 WGS Reaction Rates Used in CFD Modeling ... 89
4.1.2 The Strategy for Generating Experimental Data for WGS Reaction Rate Calibration ... 90
4.2 Global Gasification Chemical Reactions ... 93
4.3 Computational Model ... 95
4.4Boundary and Inlet Conditions ... 96
4.4.1 Boundary and Inlet Conditions for the ITRI Water Quench Simulation ... 96
4.4.2 Boundary and Inlet Conditions for the Simulation of Gasification in the Japanese CRIEPI Gasifier ... 98
4.5 Results and Discussions ... 101
4.5.1 Results and Discussions for ITRI Water Quench Process ... 101
4.5.1.1 Calibration of WGS Rate with Experimental Data of ITRI Water Quench Experiment ... 101
4.5.1.2 Calibration of WGS Rate including backward WGS Reactions ... 105
4.5.2Results and Discussions for Japanese CRIEPI gasification Process ... 107
4.5.2.1 Results of Using Three Original Experimental WGS Reaction Rates ... 107
4.5.2.2 Calibration of the Catalytic WGS Rates (Jones’s) Against the Experimental Data ... 109
4.5.2.3 Calibration of the Non-Catalytic WGS Rates (Wade’s and Sato’s) Against the Experimental Data ... 113
v
5 TOPIC 2: EFFECT OF RADIATION MODELS ONCOAL
GASIFICATION SIMULATIONS ... 116
5.1 Introductions ... 116
5.1.1 Literature Review of Radiation ModelsGasification Simulations ... 116
5.1.2 Review of Radiation Models ... 119
5.1.2.1 Radiation of Participating Media (Gas Phase) ... 119
5.1.2.2 Radiation of Combustion Particles (Solid Phase) ... 120
5.1.2.2.1 Coal Particles and Fly Ash Dispersions ... 120
5.1.2.2.2 Char ... 121
5.1.2.2.3 Soot ... 122
5.2 Global Gasification Chemical Reactions ... 122
5.3 Computational Model ... 124
5.3.1 Radiation Model... 124
5.3.2 Radiative transfer equation ... 125
5.3.3 P-1 Radiation Model ... 126
5.3.4 Rosseland Radiation Model ... 128
5.3.5 Discrete Transfer Radiation Model (DTRM) ... 128
5.3.6 Discrete Ordinates (DO) Radiation Model ... 129
5.3.7 Surface-to-Surface (S2S) Radiation Model ... 130
5.3.8 Physical Characteristics of the Model and Assumptions) ... 131
5.4 Boundary and Inlet Conditions ... 132
5.5 Results and Discussions ... 134
5.5.1 Baseline Case (Case 1, coal slurry)... 134
5.5.2 Case 2 (dry coal, 100%-0% for two stage injection) ... 136
5.5.3 Case 3 (coal slurry, 50%-50% for two stage injection) ... 137
5.6 Conclusion ... 138
6 TOPIC 3:STUDY OF LOW RANK COAL GASIFICATION ... 148
6.1 Introduction ... 148
6.2 Global Gasification Chemical Reactions ... 149
6.3 Computational Model ... 153
6.3.1 Computational Models and Assumptions ... 153
6.3.2 Boundary and Inlet Conditions ... 155
6.4 Results and Discussions ... 156
6.4.1 Comparison between Low-rank coal and High-rank coal (Case1 vs Case 3) ... 156
6.4.2 Comparison between single-stage and twp-stage fuel feeding Schemes (Case 1 vs Case 2)... 158
6.4.3 Comparison of gasification performance between South Hallsville lignite with and without pretreatment process (drying process). (Case 1 vs Case 4) ... 162
6.4.4 Comparison of dry coal gasification process with and without steam injection using South Hallsville lignite (Case 1 vs Case 5) ... 165
6.5 Conclusion ... 166
7 TOPIC 4: INDUSTRIAL APPLICATIONS ... 168
vi
7.1.1 Introduction ... 170
7.1.1.1 Brief Review of Fuel Feeding Scheme of Entrained Coal Gasification ... 170
7.1.1.2 Motivation, Hypothesis, and Objectives ... 171
7.1.1.3 Experimental Facility ... 172
7.1.2 Global Gasification Chemical Reaction ... 176
7.1.3 Computational Model ... 177
7.1.3.1 Computational Domains ... 178
7.1.3.2 Boundary and Inlet Conditions ... 179
7.1.4 Results and Discussions ... 181
7.1.4.1 Comparison between the calculated results of material balance method and experimental data ... 181
7. 1.4.2 Comparison between CFD results and experimental data ... 184
7.1.4.2.1 Case 1 (100%-0% for Oxygen distribution) ... 185
7.1.4.2.2 Case 6 (60%-40% for Oxygen distribution) ... 187
7.1.4.2.3 Effect of Oxygen injection distribution under the experimental condition (Operating pressure: 2.5 bars, O2: 0.6 of stoichiometric amount) ... 193
7.1.4.2.4 Effect of Oxygen Injection Distribution under High Operating Pressure Condition (operating pressure: 25 bars, O2: 0.4 of stoichiometric amount)... 197
7.1.5 Conclusion ... 200
7.2 Investigation of a Syngas Quench Cooling Design ... 201
7.2.1 Introduction ... 201
7.2.2 Computational Model ... 203
7.2.3Results and Discussions ... 203
7.2.3.1 Calibration of WGS Rates ... 204
7.2.3.2 Effect of the Primary vs. the Secondary Injection ... 204
7.2.3.3 Effect of Water Level Gap in the Bottom Tank ... 207
7.2.4 Conclusion ... 210
8 TOPIC 5: STUDY OF COAL-TO-SYNTHETIC NATURAL GAS (SNG) ... 211
8.1 Introduction ... 211
8.1.1 Markets, Advantage and Challenge of SNG ... 213
8.1.2 Commercial SNG plants planned in the U.S. ... 216
8.1.3 Coal-SNG Technology... 217
8.1.3.1 Steam-oxygen gasification ... 217
8.1.3.2 Hydrogasification ... 221
8.1.3.3 Hydromethanation (Catalytic steam gasification) ... 223
8.1.4 Use of biomass for SNG ... 225
8.1.5 Recent research on SNG ... 228
8.1.6 Methanation reaction rates ... 233
8.2 Global Gasification Chemical Reactions ... 237
8.3 Computational Model ... 238
8.3.1 Computational Models and Assumptions ... 239
vii
8.4 Results and Discussions ... 240
8.4.1 Jones and Lindstedt’s forward and backward mathanation reaction rates (dry coal case)... 240
8.4.2 Investigation of the sensitivity of methane production by varying methanation reaction rates of dry coal cases ... 241
8.4.3 Investigation of the sensitivity of methane production by varying methanation reaction rates of coal slurry cases ... 242
8.5 Conclusion of Chapter 8 ... 243
9 TOPIC 6: INVESTIGATION OF ASH DEPOSITION BEHAVIOR IN AN ENTRAINED FLOW COAL GASIFICATION PROCESS ... 245
9.1 Abstract ... 245
9.2 Introduction ... 245
9.3 Global Gasification Chemical Reactions ... 249
9.4 Computational Model ... 252
9.4.1 Discrete Phase Modeling ... 253
9.4.2 Particle reactions ... 253
9.4.3 Ash deposition model ... 254
9.4.4 Coal particle motion theory ... 255
9.4.4.1 Virtual mass force ... 256
9.4.4.2 Brownian force... 256
9.4.4.3 Saffman's lift force ... 256
9.4.4.4 Magnus Force... 257
9.4.4.5 Thermophoretic Force ... 257
9.4.5 Turbulent Dispersion of Particles ... 258
9.4.6 Computational Models and Assumptions ... 258
9.4.7 Boundary and Inlet Conditions ... 259
9.5 Results and discussions ... 261
9.5.1 Effect of different coal injection schemes on ash deposition rate ... 261
9.5.2 Effect of different types of coal on ash deposition rate ... 266
9.6 Conclusion of Chapter 9 ... 270
10 CONCLUSIONS... 273
10.1 Summary ... 273
10.2 Conclusions ... 273
10.2.1 Calibration of WGS reaction rates ... 273
10.2.2 Effect of radiation models ... 275
10.2.3 Study of low-rank coal gasification ... 276
10.2.4 Study of Coal-to-Synthetic Natural Gas process (SNG) ... 277
10.2.5 Study of ash deposition model ... 278
10.2.6 Study of two-Stage oxygen feeding scheme ... 279
10.2.7 Study of a syngas quench cooling design ... 280
REFERENCES ... 281
APPENDIX ... 298
viii
LIST OF FIGURES
Figure 1.1 Schematic of an IGCC system (Source: Wikipedia) ... 3
Figure 1.2 Schematic of fluidized-bed gasifier (Holt, 2004) ... 7
Figure 1.3 Overview of GreatPoint Energy Bluegas™ Process (source: Great Point Energy) ... 8
Figure 1.4 U-GAS Gasifier Schematic (Source: Gas Technology Institute) ... 9
Figure 1.5 Schematic of a counter-current moving-bed gasifier (Holt, 2004) ... 11
Figure 1.6 Schematic of Lurgi moving-bed gasifier ... 12
Figure 1.7 Schematic of an entrained-flow gasifier (Holt, 2004) ... 13
Figure 1.8 Schematic of Shell gasifier ... 15
Figure 1.9 Schematic of General Electric gasifier ... 16
Figure 1.10 Schematic of Conoco-Phillips (E-Gas) gasifier ... 17
Figure 1.11 (a) PRENFLO with Steam Generation (PSG) and (b) PRENFLO with Direct Quench (PDQ) ... 18
Figure 1.12 Schematic of Siemens gasifier... 19
Figure 1.13 Schematic of MHI gasifier ... 20
Figure 1.14 Schematic of ECUST gasifier ... 21
Figure 1.15 Schematic of HCERI gasifier ... 22
Figure 1.16 (a) Schematic of EAGLE gasifier ... 23
Figure 1.16 (b) Schematic of the Overall EAGLE Gasifier Vessel ... 24
Figure 1.17 Schematic of Kellogg Brown & Root (KBR) transport gasifier ... 25
Figure 1.18 (a) Conceptual Drawing of the Rocketdyne Gasification System (Source: Pratt & Whitney Rocketdyne) ... 27
Figure 1.18 (b) Attributes of Rocketdyne Gasifier (source: Pratt & Whitney Rocketdyne) ... 28
Figure 1.19 Schematic of WPC plasma gasifier (source: Westinghouse Plasma) ... 29
Figure 1.20 Schematic of Exxon PDU (source: Fischer-Tropsch Archive) ... 30
Figure 1.21 (a) General process of UCG (source: Science & Technology Review) ... 32
Figure 1.21 (b) Schematic of the CRIP (source: Lawrence Livermore National Laboratory) .... 32
ix
Figure 1.23 Schematic of hypothetical coal molecule. (Solomon et al., 1988) ... 34
Figure 1.24 Schematic of pyrolysis reaction. (Solomon et al., 1988) ... 35
Figure 1.25 Volatiles yields from devolatilization experiments as a function of coal rank (Dominic, 1999) ... 37
Figure 1.26 Schematic of gas concentration and temperature distributions for one-film particle combustion model ... 38
Figure 1.27 Schematic of gas concentration and temperature distributions for two-film particle combustion model. ... 39
Figure 2.1 Two-stage entrained-flow gasifier studied ... 53
Figure 3.1 Outline of numerical procedures ... 76
Figure 3.2 Typical variable residuals during calculation ... 77
Figure 4.1 (a) Schematic diagram of ITRI downdraft coal slurry-fed gasifier (b) gasifier's quench section showing locations of water injections: primary at the inlet and secondary in the outer annular ... 92
Figure 4.2 Geometry, boundary conditions and meshed computational domain of the quench section of the ITRI Gasifier ... 96
Figure 4.3 Locations of water injections: (a) the primary injection consisting of two pairs of opposing jets and (b) the secondary injection consisting of eight injectors spraying downward against the up moving flow ... 96
Figure 4.4 CRIEPI research scale coal gasifier ... 99
Figure 4.5 Boundary conditions of the simulated gasifier ... 99
Figure 4.6 Variation of Temperature and syngas composition by changing the A value of Wade’s rate with the primary water injection. ... 103
Figure 4.7 Gas temperature and species mole fraction distributions for using the Jones's rate (A=2.75x10¹⁰, E=8.38x10⁷ J/kmol) (Note: the mole fractions in this figure are based on all gases and are not the same as those shown in Table 4.13) ... 107
Figure 4.8 Comparison of syngas composition at exit with the experimental data, original Jones’ rate, calibrated Jones’ rate (A=0.2512x10⁻³ and E=1.325x10⁵ J/kmol) ... 110
x
Figure 4.10 Mass-weighted averages of gas temperature and species mole fraction distributions
along gasifier height for the Case with modified Jones's rate (A=2.75 and
E=8.38x10⁷ J/kmol) ... 111
Figure 5.1 Schematic of the two-stage entrained-flow gasifier ... 133
Figure 5.2 Mid-plane syngas temperature contour and mass-weighted average of syngas temperature distribution along the gasifier for Cases 1 (coal slurry)... 139
Figure 5.3 Wall temperature contour and circumferential average of gasfier inner wall temperature distribution along the gasifier for Cases 1 (coal slurry)... 140
Figure 5.4 Mid-plane syngas temperature contour and mass-weighted average of syngas temperature distribution along the gasifier for Cases 2 (dry coal)... 142
Figure 5.5 Wall temperature contour and mass-weighted circumferential average of wall temperature distribution along the gasifier for Cases 2 (dry coal)... 143
Figure 5.6 Mid-plane syngas temperature contour and mass-weighted average of syngas temperature along the gasifier for Cases 3 (Coal slurry, 50%-50%) ... 145
Figure 5.7 Wall temperature contour and circumpherential average of inner wall temperature distribution along the gasifier for Cases 3 (Coal slurry, 50%-50%) ... 146
Figure 6.1 Meshed computational domain of the two-stage entrained-flow gasifier ... 153
Figure 6.2 Syngas temperature and species mole fraction distributions of Case 1... 156
Figure 6.3 Synas temperature and species mole fraction distributions of Case 2 ... 159
Figure 6.4 Contours of inner wall temperature distributions of Case 1 and Case 2 ... 160
Figure 6.5 Inner wall Temperature distribution along gasifier of Case 1 and Case 2 ... 160
Figure 6.6 Syngas temperature and species mole fraction distributions of Case 4... 163
Figure 6.7 Reaction rates of Case 1 and 4 ... 163
Figure 7.1 Actual IRTI gasifier ... 168
Figure 7.2 ITRI coal-slurry fed, oxygen blown, downdraft entrained-flow gasifier. The outline of the gasifier is based on the outside diameter of the refractory ... 173
Figure 7.3 Externally pre-mixed coal slurry/oxygen feeding system ... 174
Figure 7.4 The internally premixed slurry-coal/oxygen injector with the coal-slurry fed in the center with oxygen fed through the co-centric outer annular pipe ... 174
xi
Figure 7.6 Gas temperature and species mole fraction distributions for Case 1 (100%-0% for
oxygen distribution) ... 185
Figure 7.7 Gas temperature and species mole fraction distributions for Case 6 (60%-40% for
oxygen distribution) ... 188
Figure 7.8 Gas temperature distribution at the exit cross-sectional plane of the gasifier for Case
6 (60% - 40% for oxygen distribution) ... 189
Figure 7.9 Cross-sectional and mid-plane plots of velocity vector, contours of temperature
andmole fraction of CO2 at second injection for Case 3 (90%-10% for oxygen
distribution) ... 190
Figure 7.10 Gas temperature distribution at exit cross-sectional plane of the gasifier for Case 6
(60%-40% for oxygen distribution) ... 191
Figure 7.11 The effect of two-stage oxygen injection distribution on the syngas temperature(a)
experimental data (in wall cavities) (b) CFD redults of mass-weighted syngas
temperature for Case 2 to 8 (c) results for near-wall temperature (5mm to the wall)
(Note: The temperature locations T1, 2,3,4 in this figure correspond to TE-300-4,
8, 12, and 13 in Fig. 7.2) ... 195
Figure 7.12 The effect of two-stage oxygen injection distribution on the syngas composition
for(a) experimental data and (b) CFD results (Case 2 to 8) ... 196
Figure 7.13 The effect of two-stage oxygen injection distribution on the syngas temperature and
syngas composition (Mass fraction) for Case 9 to 12. (Note: The temperature
locations T1, 2, 3, 4 in this figure correspond to TE-300-4, 8, 12, and 13 in Fig. 7.2
... 199
Figure 7.14 Velocity vector fields on two selected planes for primary and secondary injection
cases, respectively ... 204
Figure 7.15 Syngas pathline for primary and secondary injection cases ... 204
Figure 7.16 Distribution of temperature and carious species on two selected planes for primary
and secondary injection cases using reaction rate A=0.2512,
E =1.325 x 10⁵J/mol ... 205 Figure 7.17 Distribution of various species for three different water bath level gaps ... 208
Figure 7.18 Effect of water level gap on WGS syngas temperature using reaction rate A=0.2512,
xii
Figure 8.1 U.S nature gas consumption, production and imports (Source: EIA short term energy
outlook, June 2013) ... 211
Figure 8.2 U.S nature gas prices (Source: EIA short term energy outlook, June 2013) ... 212
Figure 8.3 Sketch of Major Systems Comparison SNG Production Reference Plant (DOE report, 2007) ... 214
Figure 8.4 The steam-oxygen gasification process diagram (Chen, L., et al, 2009) ... 217
Figure 8.5 ADAM II 3-stage methanation process at 45 bar, 300-650 ºC (Hohlein, et al., 1984) ... 218
Figure 8.6 Detailed block flow diagram of the Great Plains Synfuel Plant. (Source: DOE report, April, 2006) ... 220
Figure 8.7 Hydrogasification process diagram (Chandel and Williams,2009) ... 221
Figure 8.8 A diagram of hyomethanation process (Chandel and Williams, 2009) ... 223
Figure 8.9 Simplified scheme of MILENA biomass gasification process (van der Meijden, 2010) ... 227
Figure 8.10 Block Flow Diagram of KBR TRIG Coal-SNG Process (Arivapadi et al, 2008) . 229 Figure 8.11 Schematic diagram of steam hydrogasification reaction (SHR) method to produce high CH4 production (Chan and Norbeck, 2009). ... 230
Figure 8.12 Schematic of the two-stage entrained-flow gasifier ... 238
Figure 9.1 Schematic of the two-stage entrained-flow gasifier ... 258
Figure 9.2 Coal particle trace for Case1, 2, 3 ... 263
Figure 9.3 Contour of the coal particle concentration for Case 1, 2, 3 ... 264
Figure 9.4 Area-weighted average ash deposition rates along the gasifier for Case 1 to 3 ... 265
Figure 9.5 Coal Particle trace for Case 2. 4 ... 268
xiii
LIST OF TABLES
Table 1.1 Comparison between combustion and gasification ...2
Table 1.2 Summary of coal gasifier comparisons ... 26
Table 1.3 Arrhenius rates of different coals (Smith, 1982) ... 43
Table 2.1 Kinetic reaction rate constants for solid-gas reactions ... 69
Table 2.2 Kinetic reaction rate constants for finite-rate gas phase reactions ... 71
Table 4.1 Water-gas shift (WGS) reaction equilibrium balance constant ... 83
Table 4.2 WGS Reaction Rate with Noble Metal Catalysts (Smith et al., 2010) ... 85
Table 4.3 WGS Reaction Rate with High-Temperature Catalysts (310°C-450°C) (Smith et al., 2010) ... 86
Table 4.4 WGS Reaction Rate with Low-Temperature Catalysts (200°C-250°C) (Smith et al., 2010) ... 86
Table 4.5 WGS Reaction Rates used in this study... 89
Table 4.6 Summary of reaction rate constants used in this study ... 93
Table 4.7 WGS Reaction Rates used in this study... 94
Table 4.8 Compositions of Japanese Black Coal ... 100
Table 4.9 CFD simulated syngas composition using three original published WGS reaction rates (Note, the experimental water vapor data is not available for comparison.) ... 102
Table 4.10 Effect of WGS rate constants on quenched syngas composition by changing A value of Wade’s rate (Note, experimental water vapor data is not available for comparison)... 102
Table 4.11 CFD simulated syngas composition using three calibrated WGS reaction rates (Note, experimental water vapor data is not available for comparison) ... 103
Table 4.12 CFD simulated syngas composition using original Wade’s rate, calibrated Wade’s rate (A=2.512x10⁻¹ E=1.325x10⁵ J/kmol) and thermodynamic equilibrium method. (Note, experimental water vapor data is not available for comparison) ... 104
Table 4.13 Comparison of exit temperature and syngas composition between the experimental data and the simulated cases using the 3 original WGS rates ... 107
Table 4.14 Comparison of the temperature and syngas composition at exit with the experimental
xiv
Table 4.15 Temperature and syngas composition at exit for six cases and experiment data based
on Wade’s rate and Sato’s rate... 112
Table 5.1 Summary of reaction rate constants used in this study ... 122
Table 5.2a Compositions of Indonesian sub-bituminous coal ... 123
Table 5.2b Moisture-free (MF) compositions of Indonesian sub-bituminous coal ... 123
Table 5.3 Syngas composition and temperature at exit for case 1 (1 stage slurry) with different radiation models (Syngas composition is normalized by CO + H2O + CO2 +H2=1.)138 Table 5.4 Syngas composition and temperature at exit for case 2 (dry coal, 100%-0%) with different radiation models (Syngas composition is normalized by CO + H2O +CO2 +H2 =1.) ... 141
Table 5.5 Syngas composition and temperature at exit for case 3 (2 stage slurry) with different radiation models (Syngas composition is normalized by CO + H2O + CO2 +H2=1 ... 144
Table 6.1 Summary of reaction rate constants used in this study ... 150
Table 6.2 The proximate and ultimate analyses of South Hallsville lignite ... 151
Table 6.3 The proximate and ultimate analyses of Illinois No.6 bituminous coal ... 151
Table 6.4 Parameter and operating conditions of the studied cases ... 155
Table 6.5 Comparison of the results of syngas temperature, composition, HHV at exit between Case1 and Case 3 ... 157
Table 6.6 Comparison of the results of syngas temperature, composition, HHV at exit between Case 1 and Case 2 ... 161
Table 6.7 Comparison of the results of syngas temperature, composition, HHV at exit between Case 1 and Case 4 ... 164
Table 6.8 Comparison of the results of syngas temperature, composition, HHV at exit between Case 1 and Case 5 ... 165
Table 7.1 Summary of reaction rate constants used in this study ... 175
Table 7.2 The proximate and ultimate analyses of Chinese Shanxi Pingshuo coal ... 176
Table 7.3 Parameters and operating conditions of the studied cases ... 179
xv
Table 7.5 Comparision of the syngas composition with the experimental data using the 2nd material mass balance method. The volume fraction is normalized without
water, which is separately listed as mass fraction in the last row ... 183
Table 7.6a Comparison of the CFD results with the experimental data at exit for Case l (oxygen distribution: 100%-0%) ... 185
Table 7.6b Comparison of the CFD results with the experimental data at exit for Case 1. The syngas composition is normalized without water (CO+CO2+H2+CH4=1) ... 186
Table 7.7 Comparison between the CFD result and the experimental data at exit for Case 6(60%-40% for oxygen distribution)... 191
Table 7.8 CFD results of syngas compositions, syngas temperature at different locations, carbon conversion rate, and HHV for Case 2 to 8. ... 193
Table 7.9 CFD predicted syngas conditions at 25 bars for Case 9 to 12 ... 198
Table 7.10 Effect of water injection location on syngas composition using reaction rate A=0.2512, E =1.325 x 10⁵ J/mol ... 206
Table 7.11 Effect of water level gap on WGS using reaction rate A=0.2512, E =1.325 x 10⁵ J/mol ... 207
Table 8.1 Proposed commercial scale coal-to-SNG projects in the U.S (Chandel and Williams, 2009) ... 215
Table 8.2 Typical operation conditions and gas compositions in the 2-stage methanation process. (Chen, et al, 2009) ... 219
Table 8.3 Summary of reaction rate constants used in this study ... 236
Table 8.4 The proximate and ultimate analyses of Illinois No. 6 bituminous coal ... 237
Table 8.5 exit syngas composition and temperature by using the Jones’ forward and backward rates (dry coal case) ... 240
Table 8.6 Sensitivity study of methane production and syngas composition on varying the pre-exponential value, A of the Jones’ reaction rate for dry coal cases ... 242
Table 8.7 Sensitivity study of methane production and syngas composition on varying the pre-exponential value, A of the Jones’ reaction rate for coal slurry cases ... 242
Table 9.1 Summary of reaction rate constants used in this study ... 250
Table 9.2 The proximate and ultimate analyses of Illinois No.6 bituminous coal ... 251
xvi
Table 9.4 syngas composition, temperature and higher heating value (HHV) at exit of gasifier
for Cases 1, 2, 3... 262
xvii
NOMENCLATURE
a local speed of sound (m/s)
c concentration (mass/volume, moles/volume)
cp heat capacity at constant pressure (J/kg-K)
cv heat capacity at constant volume (J/kg-K)
D mass diffusion coefficient (m2/s) DH hydraulic diameter (m)
Dij mass diffusion coefficient (m2/s)
Dt turbulent diffusivity (m2/s)
E total energy (J)
g gravitational acceleration (m/s2) G incident radiation
Gr Grashof number (L3.ρ2.g.β.∆T/µ2) H total enthalpy (W/m2-K)
h species enthalpy (W/m2-K)
J mass flux; diffusion flux (kg/m2-s) k turbulence kinetic energy (m2/s2) k thermal conductivity (W/m-K)
m mass (kg)
MW molecular weight (kg/kgmol)
M Mach number
p pressure (atm)
Pr Prandtl number (ν/α)
q heat flux
qr radiation heat flux
R universal gas constant
Sc Schmidt number (ν/D)
Sf source term due to exchange of momentum
Sh source term due to exchange of energy
xviii t time (s)
T temperature (K)
U mean velocity (m/s)
X mole fraction (dimensionless)
Y mass fraction (dimensionless)
Greek letter
β coefficient of thermal expansion (K-1) ε turbulence dissipation (m2/s3)
εw wall emissivity
κ von Karman constant µ dynamics viscosity (kg/m-s) µk turbulent viscosity (kg/m-s) ν kinematic viscosity (m2/s)
ν' stoichiometric coefficient of reactant ν'' stoichiometric coefficient of product ρ density (kg/m3)
ρw wall reflectivity
σ Stefan-Boltzmann constant σs scattering coefficient τ stress tensor (kg/m-s2)
Subscript
i index notation
j index notation
xix
ABSTRACT
The United States holds the world's largest estimated reserves of coal and is also a net
exporter of it. Coal gasification provides a cleaner way to utilize coal than directly burning it.
Gasification is an incomplete oxidation process that converts various carbon-based feedstocks
into clean synthetic gas (syngas), which can be used to produce electricity and mechanical
power with significantly reduced emissions. Syngas can also be used as feedstock for making
chemicals and various materials.
A Computational Fluid Dynamics (CFD) scheme has been used to simulate the
gasification process for many years. However, many sub-models still need to be developed and
improved. The objective of this study is to use the improved CFD modeling to understand the
thermal-flow behavior and the gasification process and to provide guidance in the design of
more efficient and cheaper gasifiers.
Fundamental research has been conducted to improve the gasification sub-models
associated with the volatile thermal cracking, water-gas-shift (WGS) reaction, radiation effect,
low-rank-coal gasification, coal to synthetic-natural-gas (SNG), and ash deposition
mechanisms. The improved volatile thermal cracking model includes H2S and COS contents. A
new empirical WGS reaction model is developed by matching the result with experimental data.
A new coal demoisturization model is developed for evaporating the inherent moisture inside
the coal particles during low-rank-coal gasification. An ash deposition model has also been
developed. Moreover, the effect of different radiation models on the simulated result has been
investigated, and the appropriate models are recommended.
Some improved model tests are performed to help modify an industrial entrained-flow
gasifier. A two-stage oxygen feeding scheme and a unique water quench design are
investigated. For the two-stage oxygen feeding design, both experimental data and CFD
predictions verify that it is feasible to reduce the peak temperature and achieve a more uniform
temperature distribution in the gasifier by controlling the injection scheme without changing the
composition and production rate of the syngas. Furthermore, the CFD simulation can acceptably
approximate the thermal-flow and reaction behaviors in the coal gasification process, which can
then be used as a preliminary screening tool for improving existing gasifiers’ performance and
xx
Keywords: Integrated Gasification Combined Cycle (IGCC), Entrained-flow Coal Gasification, Water-Gas-Shift, Radiation Model, Water Quench, Coal-to-Synthetic Natural Gas
1
CHAPTER ONE
INTRODUCTION
1.1 Background
Coal a combustible black or brownish-black sedimentary rock usually occurring in rock
strata in layers or veins called coal beds or coal seams. The harder forms, such as anthracite
coal, can be regarded as metamorphic rock because of later exposure to elevated temperature
and pressure. A fossil fuel, coal forms when dead plant matter is converted into peat, which in
turn is converted into lignite, then sub-bituminous coal, then bituminous coal, and
lastly anthracite. This involves biological and geological processes that take place over a long
period. Coal is composed primarily of carbon along with variable quantities of other elements,
chiefly hydrogen, sulfur, oxygen, and nitrogen [Blander, M., 2011].
Coal is the largest source of energy for the generation of electricity worldwide, as well
as one of the largest worldwide anthropogenic sources of carbon dioxide releases. EIA 2011
report shows that global carbon dioxide emissions from coal use is predicted to have the largest
absolute increase, from 13.0 billion metric tons in 2008 to 19.6 billion metric tons in 2035. One
quarter of the world's coal reserves are found in the United States. Energy content of those
reserves exceeds the energy content of the world's known oil reserves. Coal is the United
States' largest domestic energy resource, and coal generates more than 50 percents of the United
States’ electricity for many years until after 2012 when production of cheap shale gas reduces
coal usage. At the current rates of use, United States' coal reserves are enough to last for 250
years. The dependence by the U.S. on coal as source of energy will continue as the Energy
Information Administration projects a 26 percent increase in the United States’ electricity
demand from 2007 to 2030 with coal remaining as the main fuel source.
Unfortunately, coal is not a perfect fuel. Coal contains impurities such as nitrogen and
sulfur. Burning coal will release these impurities (NOx and SOx) into the air, which can react
with the air’s water vapor and form "acid rain." In addition, as with any other carbon-based fuel,
burning coal produces carbon dioxide. Carbon dioxide in the atmosphere can trap the earth's
2
Throughout history, coal has been a useful resource. It is primarily burned for the
production of electricity and/or heat, and is also used for industrial purposes, such as refining
metals. Methods of using coal can be divided into (a) combustion, (b) pyrolysis, (c)
liquefaction, and (d) gasification. In combustion, coal is directly burned to produce heat. In
pyrolysis, coal is decomposed through heating without oxygen, which releases volatile matter
inside the coal leaving only carbon (char) and tar. In liquefaction, coal is converted into liquid
fuels. In gasification, coal is converted into synthetic gas (syngas).
Gasification is a process that converts coal into primarily carbon
monoxide, hydrogen and carbon dioxide. This is achieved by reacting the material at high
temperatures (>700 °C), without combustion, with a controlled amount of oxygen and/or steam.
The resulting gas mixture is called syngas and is itself a fuel. The clean syngas can be used as a
fuel to produce electricity or valuable products such as chemicals, fertilizers, and transportation
fuels. In contrast to the combustion process, which takes place in excess oxidant conditions,
the gasification process takes place in sub-stoichiometric conditions. Generally, the amount of
O2 used is only 35% or less of the amount required for complete combustion. The main
differences between combustion and gasification are listed in Table 1.1.
Table 1.1 Comparison between combustion and gasification.
Combustion Gasification
Occurs in excess-oxidant conditions Releases heat (exothermic)
Produces heat
Occurs in oxidant-lean conditions Absorbs heat (endothermic)
Produces sygas as a fuel or feedstock for producing chemicals
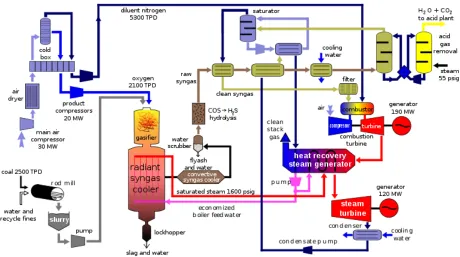
A very efficient way to use the syngas as fuel for electricity generation is by employing
the Integrated Gasification Combined Cycle (IGCC). A schematic of an IGCC system is
presented in Figure 1.1. IGCC is a technology that uses a gasifier to turn coal and other carbon
based fuels into syngas. It then removes impurities from the syngas before it is combusted.
Some of these pollutants, such as sulfur, can be turned into re-usable byproducts. This results in
lower emissions of sulfur dioxide, particulates, and mercury. With additional process equipment,
3
nearly carbon free fuel. The resulting carbon dioxide from the shift reaction can be compressed
and permanently sequestered. Excess heat from the primary combustion and syngas fired
generation is then passed to a steam cycle, similar to a combined cycle gas turbine. This results
in improved efficiency compared to buring conventional pulverized coal in a steam power plant.
Figure 1.1 Schematic of an IGCC system (Source: Wikipedia)
The plant is called "integrated" because: firstly, the syngas produced in the gasification
section is used as fuel for the gas turbine in the combined cycle; secondly, steam produced by
the syngas coolers in the gasification section is used by the steam turbine in the combined cycle;
and thirdly, the compressed air produced by the compressor of the gas turbine can be
"integrated" with the air separation unit (ASU) to produce oxygen. In this example the syngas
produced is used as fuel in a gas turbine which produces electrical power. In a normal combined
cycle, so-called "waste heat" from the gas turbine exhaust is used in a Heat Recovery Steam
Generator (HRSG) to make steam for the steam turbine cycle. An IGCC plant improves the
overall process efficiency by adding the higher-temperature steam produced by the gasification
process to the steam turbine cycle. This steam is then used in steam turbines to produce
4
1.2 Literature Review 1.2.1 History of Gasification
Coal gasification, the chemical conversion of coal to a gaseous state, was first used to
produce gas for lighting and heat in the US and UK in the early 19th century. Prior to the
discovery of 'natural' gas, it was the fuel of choice, lighting cities across the US and Europe. In
1812, the first gas company was established in London to produce gas from coal to light the
Westminster Bridge. The first gas plant to manufacture syngas from coal was built in the
United States in 1816 to light the streets of Baltimore. Soon, more gas plants followed in
Boston and New York. By 1875, manufactured gas was being widely used for home lighting.
At the time natural gas was discovered it was so abundant that coal gas was quickly abandoned
in the late 19th century.
The energy crisis of the 70's led to a resurgence of interest in coal gas as an energy
alternative. A major effort began to commercialize the technology on a large scale for clean
energy and chemical feedstock production. The abundant coal reserves of the United States and
other countries posed a challenge to engineers – how to utilize this reserve of fossil fuels in a
fashion that wouldnot cause the environmental harm of traditional methods of coal combustion.
Decades of research and development have resulted in a mature technology that is
currently being 'scaled up' as larger and larger plants are built, allowing further improvements in
the process. Recently announced projects are on the scale of large conventional PC (pulverized
coal) power plants. Worldwide there are 62 operational coal gasification units and 24 in the
planning stages. Generating unit construction costs are somewhat higher than PC combustion
units and will likely be on a par in the near future as design costs are amortized over more units
and standardized designs emerge.
1.2.2 Gasification Global Reactions
Coal gasification occurs when the coal is heated with limited oxygen and steam in a
gasification reaction chamber. The main global reactions involved in a gasification process are
as follows:
Heterogeneous reactions:
C(s) + ½ O2→ CO ∆H°R = -110.5 MJ/kmol (R1.1)
5
(Gasification, Boudouard reaction)
C(s) + H2O(g) → CO + H2 ∆H°R = +131.4 MJ/kmol (R1.3)
(Gasification)
C + 2H2→ CH4, ∆H°R = -87.4 MJ/kmol
(Direct methanation) (R1.4) Homogeneous reactions:
CO + ½ O2→ CO2 ∆H°R = -283.1 MJ/kmol (R1.5)
CO + H2O(g) ↔ CO + H2 ∆H°R = -41.0 MJ/kmol (R1.6)
(Water-gas-shift)
CHmOnNoSpClq→aCO+bH2+cCH4+dC2H2+eN2+fHCl+gH2S+hCOS
(Volatile cracking) (R1.7)
CH4+ ½ O2→ CO + 2 H2 ∆H°R = -35.7MJ/kmol (R1.8)
(Volatiles gasification via CH4)
C2H2 + O2→ 2 CO + H2 ∆H°R = -447.83 MJ/kmol (R1.9)
(Volatiles gasification via C2H2)
H2 + ½ O2→ H2O ∆H°R = -242MJ/kmol (R1.10)
The gasification of char by CO2 and H2O, reactions (R1.2) and (R.1.3), respectively, are
endothermic reactions. The endothermic two-step char combustion, reactions (R1.1) and
(R1.5), are needed to supply the energy needed in the gasification reactions. The sythentic gas
produced mainly consists of CO and H2 as fuels with other non-reactive gases such as H2O and
CO2. Reaction (R1.7) is the thermal cracking of the volatiles (CHmOnNoSpClq). The volatiles
released from the coal particles are thermally cracked into lighter gases. The volatile species for
different coals varies according to the ultimate composition of the coal.
1.2.3 Types of Gasifiers
There are four main gasifier types: (a) fluidized-bed gasifier, (b) moving/fixed-bed
gasifier, (c) entrained-flow gasifier, and (d) transport gasifier. Explanations of each type and its
examples are presented below. The comparison of these gasifiers is summarized in Table 1.2.
6
1.2.3.1 Fluidized-Bed Gasifier
In the fluidized-bed gasifier, the fuel is fluidized in oxygen and steam or air. The ash is
removed dry or as heavy agglomerates that defluidize. The temperatures are relatively low in dry
ash gasifiers, so the fuel must be highly reactive; low-grade coals are particularly suitable. The
agglomerating gasifiers have slightly higher temperatures, and are suitable for higher rank coals.
Fuel throughput is higher than for the fixed bed, but not as high as for the entrained flow gasifier.
The conversion efficiency can be rather low due to elutriation of carbonaceous material. Recycle
or subsequent combustion of solids can be used to increase conversion. Fluidized bed gasifiers are
most useful for fuels that form highly corrosive ash that would damage the walls of slagging
gasifiers. Biomass fuels generally contain high levels of corrosive ash, thus fluidized gasifiers are
commonly used for biomass gasifica tion..
The operating temperature of a fluidized-bed gasifier is around 1000°C (~1800°F),
which is roughly only half of the operating temperature of a coal burner. This lower
temperature has several advantages:
- Lower NOx emission; the temperature is not hot enough to break apart the nitrogen molecules
and cause the nitrogen atoms to join with oxygen atoms to form NOx.
- No slag formation; the temperature is not hot enough to melt ash. It is suitable for coals of
any rank (high or low ash content).
- Lower syngas temperature; that means cheaper syngas cooling system prior to gas clean up.
Fluidized-bed gasifiers display these characteristics:
• Fuel flexibility, can gasify a wide range of feedstocks
• Moderate oxidant and steam requirements
• Has a uniform, moderately high temperature throughout the gasifier
7
Figure 1.2 Schematic of the fluidized-bed gasifier (Holt, 2004)
Examples of commercial fluidized-bed gasifier are:
(i) Great Point Energy
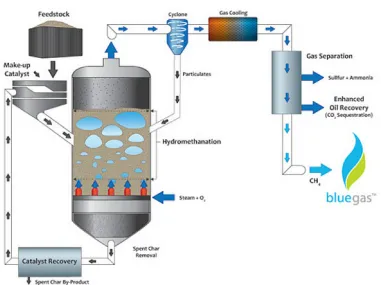
Great Point Energy is commercializing a fluidized-bed, catalytic gasification process,
called Bluegas™, to covert coal and other carbonaceous materials to synthetic natural gas
(SNG). In contrast to the conventional coal-to-SNG process, which is based on non-catalytic
coal gasification to first generate a syngas, then followed by water-gas-shift
(WGS) and methanation reaction to produce methane, Catalytic Gasification offers the
opportunity to combine these processes into a single step with improved thermal efficiency, i.e.
a once–through catalytic gasification and methanation in one reactor.
Figure 1.3 shows an overview of the GreatPoint Energy’s Bluegas™ catalytic
gasification SNG process. Partially dried coal and/or other carbonaceous are mixed and
catalyzed with a proprietary catalyst solution. The catalyzed coal is then dried and transported to
a fluidized-bed gasifier via a lock hopper system. Steam is also added. The syngas leaving the
catalytic gasifier undergoes a series of cleanup steps to remove particulates, water and acid
gases followed by a separation step to recover the methane product gas. The syngas from the
gasifier is not expected to contain tar, heavy oil byproducts, or volatile organic compounds
8
is processed in the catalyst recovery unit, in which the catalyst is recovered and recycled to the
process. Fresh makeup catalyst solution is used to supplement catalyst losses.
Figure 1.3 Overview of the GreatPoint Energy Bluegas™ Process – once –through catalytic
gasification and methanation in one reactor. (source: Great Point Energy)
(ii) U-GAS® Gasifier
The U-GAS® gasification technology, a single stage fluidized bed gasifier developed by
the Gas Technology Institute (GTI), was designed to process all ranks of coals and provide a
synthesis gas (syngas) of low-to-medium heating value. The fuel flexibility of the gasifier
allows for gasifying less expensive fuels, including all ranks of coals, petroleum cokes, biomass,
and industrial wastes, fed either individually or in combination. Gasifier fuel flexibility allows
industry to adapt to the rise and fall of fuel costs in order to maintain a cost effective operation.
The schematic U-GAS gasifier is shown in Figure 1.4. In a U-GAS® based gasification
9
steam and air or oxygen at temperatures from 840°C to 1,100°C (1,550°F to 2,000°F). The
gasifier’s operating pressure depends largely on the syngas’ end use, ranging anywhere from 3
to 30 bar (40 to 435 psia). After appropriate gas cleaning, the syngas can be used for heating
applications, generating power, or making chemicals or fuels. When the operating temperature
of the gasifier is high enough to begin melting the fuel ash (mineral content), the concentration
of ash particles within the gasifier increases until a point where the ash particles cluster
together, thus forming larger particles which are selectively removed from the bed. Ash is
removed from the fluidized bed by gravity (when the conglomerated particle’s weight becomes
greater than the upward force of the fluidizing gas), and falls into a lock hopper system for
depressurization and subsequent disposal. This gasifier design ensures that the larger (more
dense) ash particles exiting the gasifier contain minimal amounts of carbon (less than 5%), and
that 95% or more of the fuel’s carbon is gasified. The introduction of the reactant gases (steam
and air or oxygen) are introduced at the bottom of the gasifier, through a distribution grid, and at
the ash discharge port in the center of the distribution grid.
10
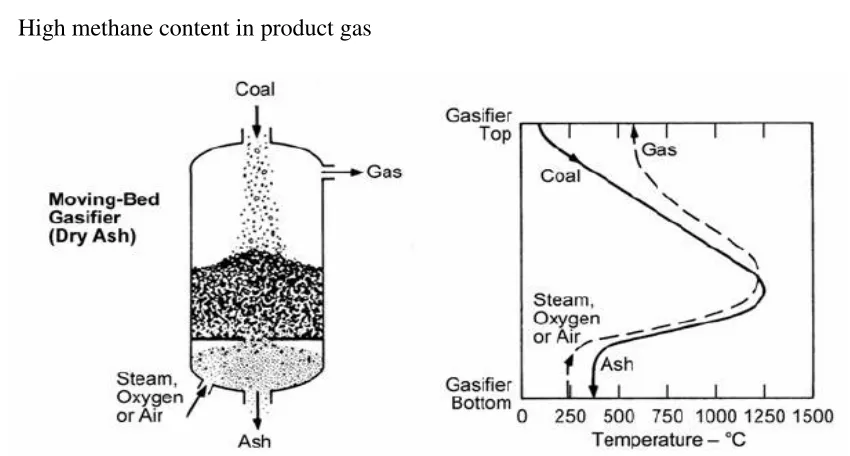
1.2.3.2 Moving-Bed Gasifiers
In moving-bed gasifiers, large coal particles move slowly downward through a bed
while reacting with gases moving in the opposite direction going upward through the
bed. Coarse particles are used in moving-bed gasifiers to ensure good bed permeability and
help to avoid excess pressure drop and chemical burning. Reactions within the gasifier occur in
different “zones”. In the “drying zone” at the top of the gasifer, the entering coal is heated and
dried, while cooling the product gas before it leaves the reactor. The coal is further heated and
devolatized by the higher temperature gas as it descends through the “carbonization zone”. In
the next zone, the “gasification zone”, the devolatized coal is gasified by reaction with steam
and carbon dioxide. Near the bottom of the gasifier, in the “combustion zone”, which operates
at the highest temperature, oxygen reacts with the remaining char. Figure 1.5 shows schematic
of a counter-current moving-bed gasifier.
Moving-bed gasifiers operate in two different modes. In the dry-ash mode of operation
(e.g., Lurgi dry ash gasifier), the temperature is moderated to below the ash-slagging
temperature by reaction of the char with excess steam. The ash below the combustion zone is
cooled by the entering steam and oxidant (oxygen or air) and produced as a solid ash. In the
slagging mode of operation (e.g., British Gas/Lurgi or BGL gasifier), much less steam is used,
and as the result, a much higher temperature is achieved in the combustion zone, melting the ash
and producing it in the form of a solid slag. The moisture content of the fuel is the main factor
which determines the discharge gas temperature. Lignite, which has very high moisture content,
produces raw gas at a temperature of around 600 °F. Lower moisture bituminous coal produces
gas temperatures of over 1000 °F. Typically, the product gas leaving the gasifier is quenched by
direct contact with recycle water to condense and remove tars and oils. After quench, heat can
be recovered from the gas by generation of low pressure steam.
Moving-bed gasifiers share the following characteristics:
• Relatively low oxidant (oxygen or air) requirement
• Less complex feedstock preparation with the use of coarse coal particles
• Product gas at relatively low temperatures, thus no need for using expensive heat
recovery equipment
• Suitable to handle coals with high reactivity and moisture
11
• Modifications of design may be needed to avoid caking coals
• Hydrocarbon liquids such as tars and oils are produced as byproducts
• High “cold-gas” thermal efficiency, when the heating value of the produced
hydrocarbon liquids is accounted for
• High methane content in product gas
Figure 1.5 Schematic of a counter-current moving-bed gasifier (Holt, 2004)
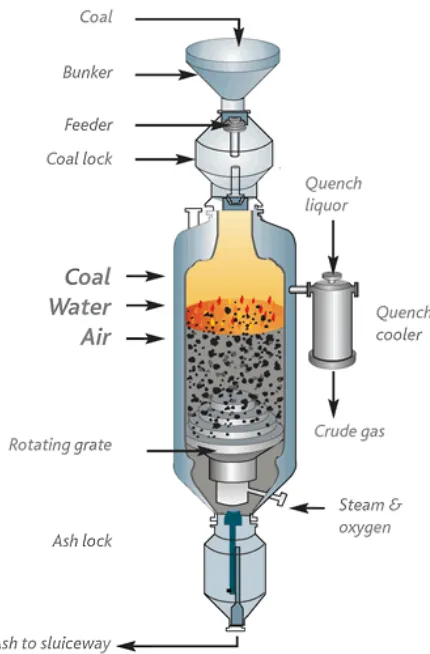
A typical example of moving-bed gasifier is Lurgi Gasifier, shown in Figure 1.6. The
Lurgi gasifier is a pressurized, dry-ash, moving bed gasifier that produces syngas from lump
coal, steam, and oxygen as an oxidant. A high ratio of steam to oxygen helps moderate the
temperature such that the ash does not melt, but rather is removed as dry ash. More reactive
feedstocks are preferred due to the relatively low-temperature operation. Coal enters the top of
the gasifier through a lock hopper and is handled by a rotary distributor as it begins its descent
through the gasifier. Steam and oxygen enter from the bottom, while ash is removed at the
bottom by a rotating grate and lock hopper. A top temperature of about 1,000°F and bottom
temperature of about 1,800°F creates a temperature gradient in the gasifier. Exiting raw syngas
at up to 1,000°F is cooled and quenched using recycle water to condense tars and oils. A water
12
Figure 1.6 Schematic of the Lurgi moving-bed gasifier
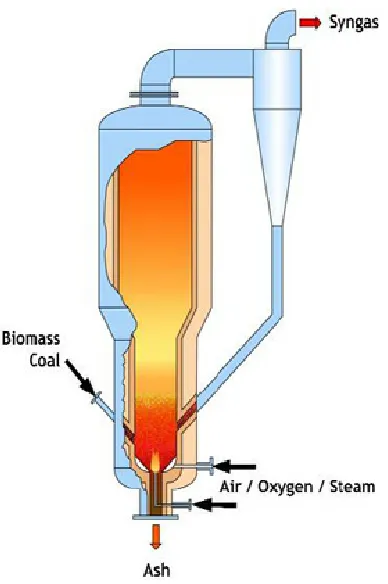
1.2.3.3 Entrained-Flow Gasifier
In entrained-flow gasifiers, the speed of flow (air or oxygen) is fast, resulting in entraining
the coal particles from the injection location to the exit. It can be designed as either upflow or
down-flow system. The coal and oxidant are fed either from top or bottom of the
gasifier. Gasifiers of this type typically operate at very high temperatures to melt coal ash into
inert slag. The fine coal feed and high operating temperature allow the gasification reaction to
occur at a very high rate (the typical residence time is on the order of few seconds), with high
carbon conversion efficiencies (98-99.5%). The tar, oil, phenols, and other liquids produced from
devolatization of coal inside the gasifier are decomposed into hydrogen (H2), carbon monoxide
(CO) and small amounts of light hydrocarbon gases. Entrained-flow gasifiers have the ability to
handle practically any coal feedstock and produce a clean, tar-free, syngas. The fine coal feed can
13
the latter relies on the use of high-pressure slurry pumps. The slurry feed is a simpler operation,
but it introduces water into the reactor which needs to be evaporated. The result of this additional
water is a product syngas with higher H2 to CO ratio, but with a lower gasifier thermal
efficiency. The feed preparation system is designed along with other process design alternatives,
for a particular application. Figure 1.7 presents an illustration of an entrained-flow gasifier.
Figure 1.7 Schematic of an entrained-flow gasifier (Holt, 2004)
Entrained-flow gasifiers typically exhibit the following characteristics:
• Fuel flexibility, can accept a variety of solid feedstocks
• Large oxidant requirements
• Can either be oxygen or air blown, but most commercial plants are oxygen blown
• Uniform temperature within the reactor
• Slagging operation
• Short reactor residence time
• Higher carbon conversion, but lower coal gas efficiency
• High level of sensible heat in product gas; heat recovery is required to improve
efficiency
• Environmentally most benign; produced syngas consists of mainly H2, CO and carbon
dioxide (CO2) with trace amount of other contaminates which can be removed
downstream of the reactor
14 Examples of entrained-flow gasifiers:
(1) Shell Coal Gasification Process (SCGP)
Shell’s coal gasification technology uses a dry-feed, pressurized, entrained-flow,
slagging gasifier that operates on a wide variety of feedstocks. Figure 1.8 shows the schematic
of Shell gasifier. Dried, pulverized coal is fed to the gasifier through pressurized lock hoppers
using a transport gas (syngas or nitrogen). Preheated 95% pure oxygen and steam (as a
moderator) are mixed and fed to the injector. The coal reacts with oxygen at typical conditions
of 2,700-2,900°F and 350-600 psi to produce syngas consisting of only small amounts of carbon
dioxide (CO2) and no hydrocarbon liquids or gases. Theraw syngas leaves the gasifier at a
relatively high temperature (typically 2,500-2,700°F) and is sent on to a syngas cooler for heat
recovery, generating high-pressure superheated steam. The syngas cooler typically consists of
three sections—superheat, convection, and economizer. To protect the syngas cooler from
fouling, corrosion, and erosion, the hot raw syngas leaving the gasifier is first quenched with
cooler, recycled product gas to convert any entrained molten fly slag to a hardened solid
material prior to entering the syngas cooler. The bulk of the fly ash contained in the raw syngas
leaving the syngas cooler is removed from the gas using commercial filter equipment or
cyclones. Any remaining fly ash is captured downstream with a wet scrubber. The syngas cooler
is an integral part of Shell gasifier technology.
The Shell technology uses a refractory-lined reactor vessel, equipped with an inner
membrane wall consisting of circulating water/steam-filled tubes. During operation, ash is
converted into molten slag. The molten slag, cooled by the membrane wall, vitrifies to form a
protective layer against slag erosion of the refractory. This specific reactor design contrasts
most rival gasification processes, which have brick refractory walls inside the gasifier that are
gradually eroded by the hot slag and must be routinely replaced. Shell’s gasifier membrane wall
is said to have a 20-year life. Inner reactor wall temperature is controlled by circulating water
through the membrane wall, producing steam. Produced slag flows down the reactor into a
15
Figure 1.8 Schematic of the Shell gasifier
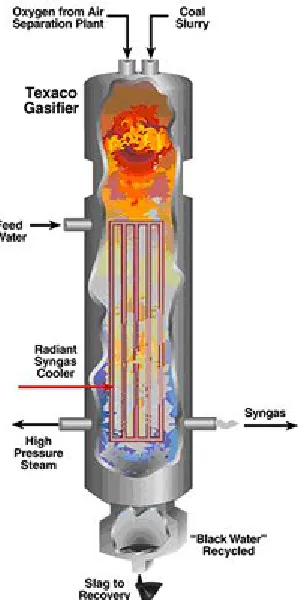
(2) General Electric Gasifier (Previously Texaco gasifier)
GE gasification uses a single-stage, downward-feed, entrained-flow refractory-lined
reactor to produce synthesis gas (syngas) from a coal/water slurry (~ 65% in wt) and oxygen (>
95% pure). The slurried feedstock is pumped to a custom-designed injector mounted at the top
of the gasifier. The coal reacts exothermically with oxygen at high temperature (~ 2,200 to
2,700°F) and pressure (>300 psi) to form syngas and slag. No hydrocarbon liquids are
produced in these high temperature conditions. The syngas produced contains mostly hydrogen
(H2) and carbon monoxide (CO). The raw syngas leaving the gasifier can be cooled by a radiant
and/or convective heat exchanger and/or by a direct quench system, where water or cool
recycled gas is injected into the hot raw syngas. The radiant cooling design uses a soot-tolerant
radiant syngas cooler that generates high-pressure steam. Slag is quenched in a water pool
located at the bottom of the reactor vessel, and removed through a lock hopper. This design
maximizes heat recovery as well as CO production. The syngas is further cooled after leaving
the gasifier by a water scrubber to recover the fine particulate matter and char for recycle to the
16
A direct quench system uses an exit gas water quench. Hot gas exiting the gasifier is
contacted directly with water via a quench ring; it is then immersed in water in the lower portion
of the gasifier vessel. The cooled, saturated syngas is then sent to a scrubber for soot and
particulate removal. The quench design is less efficient, but also less costly, and it is commonly
used when a higher hydrogen to CO ratio syngas is required.
Figure 1.9 Schematic of the General Electric gasifier
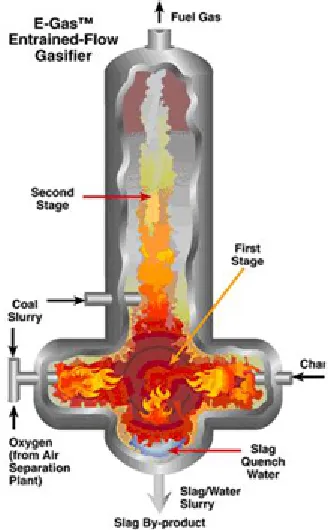
(3) Conoco-Phillips (E-Gas) Gasifier
The E-Gas coal gasifier is a pressurized, upflow, slurry-feed, entrained slagging design
with a unique two-stage operation. Wet crushers produce slurries from the raw feed coal. Coal
slurry concentrations typically range from 50 to 70% depending on the inherent moisture and
quality of the feed coal. About 75% of the total slurry feed is fed to the first (or bottom) stage of
the gasifier through mixer nozzles, along with 95% pure oxygen. This stage involves highly
exothermic oxidation reactions (i.e., combustion) and operates at typically 2,600°F and 400
psig. These conditions do not allow the formation of hydrocarbon gases and liquids. Ash in the
17
an inert vitreous slag product. The hot syngas from the first stage then enters the second (top)
stage where the remaining slurry feed is injected. Endothermic gasification and devolatization
reactions take place at 1,900°F, resulting in the formation of some hydrocarbons in the product
gas and the production of char, which are both recycled to the first stage where they are readily
gasified. The product gas exits the gasifier at 1,900°F and is cooled in a fire-tube cooler to
1,100°F, generating saturated steam. Particulates and chlorides are removed from the cooled
syngas in a wet scrubber and char is recycled to the gasifier. The syngas is then treated for
removal of carbonyl sulfide (COS) and hydrogen sulfide (H2S) before being used for energy
conversion or other applications.
Figure 1.10 Schematic of the Conoco-Phillips (E-Gas) gasifier
(4) PRENFLO (PREssurized ENtrained-FLOw) Gasifier
PRENFLO, which operates at the pressure above 40 bar, is a further development of the
Kopper-Totzek process developed in the 1940's. PRENFLO was developed by Uhde, which
later merged with Krupp Koppers. PRENFLO is a one-stage, high pressure, dry-fed,
18
(3600°F) and uses a membrane wall. PRENFLO gasifiers are used in the world's largest
solid-feedstock-based IGCC power plant in Puertolanno, Spain.
Figure 1.11 shows an illustration of a PSG (PRENFLO with Steam Generation) gasifier.
Coal is injected together with oxygen and steam through several injectors in the lower part of
the gasifier. Raw syngas is then sent through the waste heat boiler to cool down and produce
steam. The exit gas temperature is 1350-1600°C (~2450-2900°F). In a PDQ (PRENFLOW
with Direct Quench), illustrated in Figure 1.11b, coal and oxygen/steam are injected in the
upper part of the gasifier. Raw syngas is quenched by water in the direct quench section in the
lower part of the gasifier. The syngas is cooled down to 200-250°C (~390-480°F).
(a) PSG (b) PDQ
Figure 1.11 (a) PRENFLO with Steam Generation (PSG) and (b) PRENFLO with Direct Quench
19 (5) Siemens Gasifier
The Siemens gasifier, shown in figure 1.12, is a dry-feed, pressurized,
entrained-flow reactor, which can be supplied with either a refractory lining for low ash feedstocks or with
a cooling screen in the gasification section of the gasifier. The cooling screen consists of a
gas-tight membrane wall structure that is studded and refractory-lined with a thin layer of silicon
carbide for protection. The molten slag formed in the gasifier chamber cools and solidifies as it
contacts the cooling screen, forming a compact slag layer, protecting it from further damage by
the flowing slag. Once a slag layer is formed over the cooling screen, subsequent hot slag flows
down the reactor chamber into the quench section of the gasifier where it solidifies upon contact
with water from a ring of quench nozzles and is removed through a lock hopper. Feedstocks
with an ash content of greater than two percent by weight are preferred when using the cooling
screen design; in this scenario the gasifier can achieve carbon conversion rates higher than 99%.
Siemens gasifier is suited for coals from anthracite to lignite, as well as biomass, petcoke, and
residual oil.
20 (6) MHI (Mitsubishi Heavy Industries)Gasifier
The MHI gasifier is a pressurized, dry-feed, upflow, entrained-flow slagging reactor
with a unique two-stage operation. The current focus of the effort is on air-blown (or enriched
air blown) IGCC application. R&D activities are being carried out to develop an oxygen-blown
system for coal to fuels and chemicals applications.
Figure 1.13 shows a simplified drawing of the MHI gasifier. The reactor consists of two
sections (or stages): a lower combustor and an upper reductor. Dry milled coal is fed at two
separate points into the gasifier with a portion being fed into the combustor together with air (or
enriched air) where it is burned to produce carbon monoxide (CO) and carbon dioxide (CO2),
plus water vapor. The temperature generated at the combustor is sufficiently high to melt the
coal ash. The molten slag falls to the bottom of the gasifier where it is quenched in a water bath
and then removed using a lock hopper system. The gas produced in the combustor rises to the
reductor where the remaining coal is added, without any additional air. At the reductor stage,
heat provided by the hot combustor gas is used to drive the endothermic gasification reactions.
The reductor is operated at a lower temperature than the combustor. Any molten ash carried
over by the upward gas is solidified. The syngas produced exits the reductor through a syngas
cooler generating steam. A cyclone is used downstream of the sygnas cooler to collect
the char and recycle it to the combustor section to increase the overall carbon conversion
efficiency. The raw syngas leaving the reductor section of the gasifier is typically at 2,200°F,
high enough in temperature that very little hydrocarbon gases and liquids are formed.
21
(7) ECUST (East China University of Science and Technology) Gasifier
In the early 1990s, the Institute of Clean Coal Technology (ICCT) at the ECUST began
its development of coal gasification technology in partnership with the Yankuang Coal Mine
Group. The ECUST gasifier can accommodate either coal-water slurry feeding, or dry-feeding
(via N2 or CO2) applications. The entrained flow gasifier incorporates opposed multi-burner
(OMB) technology, and a water-quench in a down-flow configuration. Operating conditions are
dependent upon dry/wet feed, as well as the end product. The gasifier temperature and pressures
fall in the range of 1,300 to 1,400°C, and 1 to 3 MPa. Figure 1.14 shows schematic of ECUST
gasifier.
Figure 1.14 Schematic of the ECUST gasifier
(8) HCERI (Huaneng Clean Energy Research Institute) Gasifier
The Huaneng Clean Energy Research Institute (HCERI), formerly the Thermal Power
Research Institute (TPRI), has developed gasification technology that is being used in numerous
gasification facilities throughout China. HCERI gasification technology is a two-stage dry-feed
and water-cooled gasifier, as shown in figure 1.15. The first stage of the gasifier reacts 80 to
85% of the coal feed with pure oxygen and steam. The steam and the remaining 15 to 20% of
the feed coal are fed into the second stage, which operates at about 1400 to 1500°C. The
temperature of the outlet syngas is decreased to 900°C due to the second stage's endothermic
reaction - helping the slag particles to solidify, as well as improving the gasifier's thermal