Polymer film sensor for sampling and remote analysis of polycyclic
aromatic hydrocarbons in clear and turbid aqueous environments
Chanan Sluszny, Vladimir V. Gridin, Valery Bulatov, Israel Schechter
∗Department of Chemistry, Technion-Israel Institute of Technology, Technion City, Haifa 32000, Israel Received 10 April 2004; received in revised form 7 June 2004; accepted 7 June 2004
Available online 3 August 2004
Abstract
A sensor for remote analysis of polycyclic aromatic hydrocarbons (PAHs) has been developed. It is based on direct solid phase extraction of the pollutants on a polymeric film, followed by monitoring the laser induced fluorescence, emitted from the film, via optical fibers. The proposed sensor has been applied to direct PAH analysis in clear and turbid aqueous environments. Linear calibration plots have been obtained for PAH solutions containing both humic substances and clay suspensions. Detection limits in the range of 10 ppt have been achieved. Results are obtained almost instantaneously (in drinking water) or within minutes, in more complicated matrices. This set-up has provided considerable improvement of the detection limits, when compared to the traditional fiber-optic fluorescence probe. In case of pyrene, a 100-fold and a 250-fold improvement in the detection limits have been obtained for the clay and humic substances-containing water, respectively. The spectral response of the polymeric film has been studied under various conditions and the feasibility of the method for analysis of PAH mixtures has been addressed.
© 2004 Elsevier B.V. All rights reserved.
Keywords: Pyrene; Sensor; PAH; Environment; Polymer
1. Introduction
Water pollution by organic substances has caused sub-stantial worldwide concern [1]. With regards to such pol-lutants, contamination of water resources by polycyclic aromatic hydrocarbons (PAHs) has received considerable attention because of the documented carcinogenicity related to these substances[1,2]. On these grounds, the importance of fast and in situ monitoring of PAHs in water resources has been recognized[3,4].
Most often, conventional methods, which are based on field sampling and laboratory analysis, are employed [5]. Since PAHs are usually found at trace amounts in water (<ppb)[1], an extraction or pre-concentration step must usu-ally be performed prior to analysis; separation and detection by conventional chromatography is ultimately applied.
In this regard, various extraction procedures have been developed. In particular, solid phase extraction (SPE) meth-ods are most often used for environmental analyses [6–9].
∗Corresponding author. Tel.:+972 48 291607; fax:+972 48 292579. E-mail address: [email protected] (I. Schechter).
SPE procedures are used not only to extract traces of organic compounds from environmental samples, but also to remove the interfering components of such complex matrix[6]. The resulted solution contains a cleaner extract that can be di-rectly analyzed by conventional methods. In natural water resources, the relevant interfering components are inorganic suspended materials and humic substances (HS)[10].
SPE methods are usually based on application of con-ventional sorbents, such as the C18 reversed-phase medium. However, in recent years, application of polymers as the solid medium for extraction of organic pollutants has gained considerable interest[7,11–14]. Moreover, various applica-tions of polymer films as selective sorbents for organic pollu-tants have been suggested[13,15,16]. Some of which could be used for on-line and real-time detection of organic pollu-tants[17–21]. These are usually based on extraction of the organic substances into the original or the modified cladding of an optical fiber[17,18,21]. For these, detection of PAHs is usually based on the UV–vis absorption spectra of the relevant substances[17,18].
Most of these methods are limited to analysis of rather high PAH concentrations (in the ppm range). Since, in
PAHs are selectively (with respect to interfering substances) adsorbed and concentrated. Detection of the adsorbed PAHs is performed directly by fluorescence spectroscopy. Physi-cal aspects related to the application of the polymeric film sensor for direct and on-site analysis of PAHs, are dis-cussed. The potential of remote analysis, based on cou-pling the polymeric sensor to optical fiber technology, was examined.
2. Experimental
Pyrene and anthracene were used as target materials for this study. Both pyrene and anthracene are included in the US EPA priority pollutant list and may represent the PAH contaminants family[1]. Hence, the rapid and direct analy-sis of such compounds is of considerable interest. Moreover, these materials possess different physicochemical character-istics[1], some of which will be shown to affect the poly-meric film (PF) analysis. These include the different affinity to polymeric media, solubility and fluorescence characteris-tics (quantum yield and spectral features).
2.1. Chemicals
2.1.1. PAH solutions
Pyrene (Fluka, 99%) and anthracene (Fluka, 99%) were used without further purification. Stock solutions of the PAHs (pyrene 50g l−1 and anthracene 40g l−1 were prepared by first dissolving the materials in acetonitrile and then diluting with double-deionized water. Several concentrations were obtained by serial dilution. Maximum concentrations were set at approximately 50% solubility in water, in order to insure complete dissolution of the PAHs).
Stock solution of humic substances (HS) (100 mg l−1, Aldrich humic acids, sodium salt) were prepared by dissolv-ing 100 mg of the solid material in double-deionized wa-ter. Sample solutions of the PAHs (in the relevant concen-tration range), and the humic substances (10 and 50 mg l−1 in the PAH solution) were prepared from the stock solu-tions. Clay (sodium-montmorilonite) suspensions (0.5 and
imately 50m. The rather high amount of softening agent that was added in the preparation of the polymer, resulted in elastic and cohesive (with respect to any surface) films that could easily be manipulated. These films were transparent forλ> 300 nm.
2.2. Measurements
2.2.1. Sampling procedure
Sampling the PAH contaminated water was performed by placing the prepared polymer film into the solutions con-taining the dissolved PAHs. A magnetic stirrer, rotated at 1000 rpm, was applied for 45 min (unless other sampling du-ration is mentioned). Ten replicates were performed at each PAH concentration.
2.2.2. Remote laser induced fluorescence (LIF) analysis
Schematic experimental set-up for remote LIF analysis is shown in Fig. 1. A dual-branch fiber-optic fluorescence probe was used for direct excitation of the PAH-containing polymer, as well as for the collection of the emitted fluo-rescence. A specially designed holder coupled the polymer film to the fiber-optic assembly. This holder was adjusted at an angle of 55◦ with respect to the fiber-optic head. A Nd:YAG laser (Minilite, Continuum; 355 nm, 1 mJ in 5 ns pulses at 4 Hz) was used for excitation. The laser light was focused onto the optical fiber by a microscope objective. The back-emitted fluorescence was transmitted through the opti-cal fibers and the spectra were obtained by a PC-interfaced spectrometer, equipped with an intensified photodiode ar-ray detector (Princeton Instruments), gated by PG-200 HV pulser. Each LIF spectrum was obtained in a 500 ns gate and the final spectra were averaged over 20 such events.
2.2.3. Reference fluorimetry
Fig. 1. Schematic presentation of the polymeric film sensor.
3. Results and discussion
This section is arranged as follows: first, we demonstrate the extraction capabilities of the polymeric film (PF), in re-lation to PAHs. Next, we present the advantage of the PF sampling over direct fluorescence analysis in solutions. The latter is exemplified by measurements carried out in the pres-ence of humic substances. Then, we provide a quantitative evaluation of the method, when fluorescence quenchers are present at various concentrations (represented by humic sub-stances) and when micro-particulates are suspended in the water (represented by various clay suspensions). Finally, the potential of this method for remote analysis under various conditions is evaluated in terms of sampling time required for obtaining given detection limits.
3.1. Extraction capabilities of the polymer film
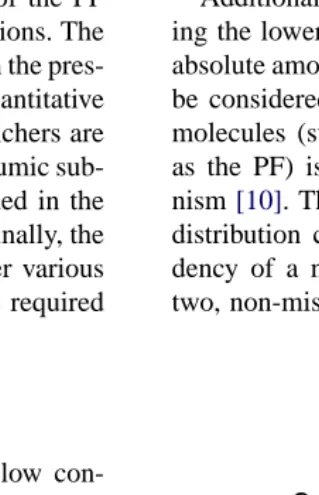
The capability of the polymer film to handle low con-centrations of PAHs (usually below ppb) is exemplified in
Fig. 2for pyrene and anthracene. In this figure the fluores-cence intensities obtained directly from the PAH-containing polymer are plotted versus increasing the concentrations of pyrene and anthracene; the linear regression plots and the standard error bars are given.
The limits of quantification (LOQ) were calculated from the 95% confidence intervals (at the linear regression per-formed on the lower concentration range). The resulted LOQ for pyrene and anthracene were, respectively, 0.06 and 0.4 ppb. Note that the corresponding slopes of the linear regression fit were 0.56 and 0.05 in respect of the former and the latter PAH solutes. Such a 10-fold difference in the slope values reflects poor fluorescence intensity obtained from the anthracene containing PF. This is, possibly, due to the reduced quantum efficiency of anthracene, compared to that of pyrene.
Indeed, the preliminary conducted experiments, where equal amounts of the PAH powders were directly embed-ded into the polymer film, have resulted in a 5-fold reduced
intensity of the anthracene fluorescence relative to that ob-tained from the corresponding pyrene containing film. These findings are in accord with previously reported studies on such PAH solutions[33].
[image:3.842.346.506.460.708.2]Additional processes could also be envisaged for explain-ing the lower fluorescence of anthracene. For example, the absolute amount of each PAH absorbed within the PF should be considered. In this regard, the sorption of hydrophobic molecules (such as PAHs) into non-polar substrates (such as the PF) is usually attributed to a partition-like mecha-nism[10]. This is usually represented by the octanol/water distribution coefficient (Kow). The latter quantifies a ten-dency of a non-polar molecule to be partitioned between two, non-miscible solvents, such as octanol and water. The
Fig. 3. Normalized fluorescence spectra obtained from clean pyrene so-lution (10g l−1) and from solutions containing 10 and 50 mg l−1 hu-mic substances. The corresponding spectral features obtained from the pyrene-containing polymer, which were obtained from the 50 mg l−1 hu-mic substances solution, are also given.
corresponding log(Kow) values for pyrene and anthracene are, respectively, 5.3 and 4.5[1]. Hence a lower partitioning of anthracene into the PF might be anticipated. As a result, the corresponding fluorescence intensity would decrease. It should be noted, however, that the lower LOD for anthracene is attributed to a variety of physical factors and it may not be only due to its smaller Kow value.
The data presented here indicate that PAHs in water can be properly sampled by the polymeric film and analysis can be based of the film fluorescence. Clearly, the PF concentrates the PAHs, which allows for low limits of detection. However, this is not the only reason for the application of the PF. In the following we will show that the PF overcomes problems related to analysis in complex matrixes, such as commonly faced in environmental analyses.
3.1.1. PF sampling versus direct solution fluorescence
In order to demonstrate the advantage of the polymeric film sensor for handling complex matrixes, we will compare the fluorescence spectra obtained from remote LIF measure-ments in solutions (without the PF) to the spectra obtained with the assistance of the film. In these experiments, humic substances (HS) were added to the PAH solutions, to mimic a common matrix effect.
The results are shown in Fig. 3, for pyrene solutions at a constant concentration of 10g l−1. The fluorescence spectrum obtained from the pure solution is compared to those obtained from similar solutions containing also 10 and 50 mg l−1humic substances (HS). The corresponding spec-tral features obtained from the polymeric film immersed in the same solutions, are also given.
Observe that the presence of 50 mg l−1 HS completely eliminated the fluorescence of pyrene, when direct analy-sis of the aqueous solution was performed. In this case, the well-resolved spectral features of pyrene were replaced with a broad, featureless spectrum that has been widely
recog-Fig. 4. Effects of dissolved humic substances on the quantification of pyrene (sampling time: 45 min).
nized[32]to be related to the presence of humic substances. The presence of 10 mg l−1HS also considerably affects the fluorescence spectrum, which severely interferes with pyrene analysis.
The corresponding spectral features of the PF that sampled the same pyrene solutions, in the presence of 50 mg l−1HS, are also shown in the previous figure. Evidently, the presence of humic substances within the pyrene solutions did not af-fect the fluorescence spectrum of the pyrene-containing PF. This quite clearly points out the selective sorption charac-teristics of the PF in favor of PAH compounds.
Inferred by the data of Fig. 3, it is evident that humic substances can act as quenchers that prevent direct fluores-cence measurements of PAHs. Moreover, since the absorp-tion spectra of both HS and PAHs occur at the same spectral range[34], inner-filtering effects should be considered. This even further complicates any direct analysis of PAHs in the presence of humic substances.
Now, after pointing out the necessity of the PF sensor, we shall describe its performance in handling complex matrixes.
3.1.2. Pyrene analysis in complex matrixes: effects of humic substances
Environmental samples often contain high amounts of nat-ural materials such as humic substances and clay suspen-sions. Firstly, we consider the interference of humic sub-stances upon analysis of pyrene and anthracene using the polymeric film sensor.
Pyrene molecules might similarly interact with both PF and HS. Such an assumption seems plausible, since HS and PF both act as non-polar matrices, which are imbedded in the aqueous solution. The partition of PAH is then expected to occur between such non-polar hosts as the PF and the HS. In such cases, a rather complex sequence of processes, associated with the sorption of hydrophobic substances take place[35].
[image:4.842.323.539.69.225.2]Fig. 5. Effects of clay suspensions on the quantification of pyrene. The case of mixed clay suspension and humic substances is also given (sampling time: 45 min).
50 mg l−1 HS, and for reference clear solution. The linear regression slopes were 2.4 and 3.5, for the 50 and 10 mg l−1 HS solutions, respectively, and 4.7 for the clean pyrene so-lution. Observe that a 5-fold increase of the HS concentra-tion (from 10 to 50 mg l−1) results in less than 30% reduc-tion of the corresponding linear regression slope (from 3.5 to 2.4). The overall decrease of the fluorescence readouts for the 50 mg l−1data was ca. 50% (from slope=4.7 for clean pyrene to slope=2.4).
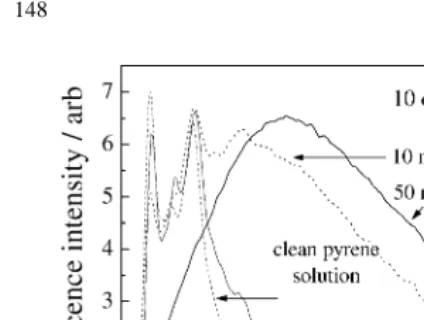
3.1.3. Pyrene analysis in complex matrixes: effects of clay suspension
Next, the effect of the presence of water suspensions is studied. These are represented by clay suspensions, which are quite common in environmental water. The suspension is responsible for light scattering, which has been shown to affect the LIF analysis of PAHs [36]. Calibration plots for pyrene in the presence of clay suspension at two concentra-tions are shown inFig. 5. The reference plot (correspond-ing to clean pyrene solution) is also shown for comparison. Moreover, results for a more complex matrix, containing both clay suspension and humic substances, are also pro-vided.
The corresponding linear regression slopes were 2.7 and 2.0 for the 0.25 and 0.5% (w/w) clay suspension, respectively, and 1.7 for the mixed case (i.e., 0.5% clay
+50 mg l−1HS). The slope of the clean solution was 4.7. When compared with the HS-related data (refer toFig. 4), observe that any considerable decrease of fluorescence oc-curs only when a large amount of clay is used. For example, as little as 50 mg l−1HS produces roughly the same reduc-tion of pyrene fluorescence as an addireduc-tion of 5000 mg l−1 of clay. In relative terms, therefore, pyrene quantification within the PF matrix is by far larger hindered by HS than by its interaction with clay particulates.
In this regard, it is well known[10]that the interactions of clays with hydrophobic pollutants are usually weaker
Fig. 6. Effects of dissolved humic substances and clay suspension on the quantification of anthracene (sampling time: 45 min).
compared to those with HS. Therefore, the clay–PAH in-teractions should not be considered as a major cause for the decreased pyrene fluorescence. In turn, the decreased fluorescence in the case of clay suspensions is attributed, most likely, to the coating of the polymeric film by clay particles.
Moreover, when both humic substances and clay were present within the same pyrene solution, a further decrease of the fluorescence took place. Observe that a subsequent treatment of the 0.5% clay suspension with 50 mg l−1 HS did not produce the same effect as was recorded (for this amount of HS) inFig. 4. We believe that a mutual interac-tion between clay particles and humic substances[10]might effectively result in reduction of pyrene partition by HS.
Let us now examine the same effects upon analysis of another PAH compound.
3.1.4. Anthracene analysis in complex matrixes
The calibration plots for anthracene in the presence of hu-mic substances or clays are presented inFig. 6. The linear regression slopes were 0.25 for the 0.5% (w/w) clay suspen-sion, 0.3 for the 50 mg l−1HS solution and 0.4 for the clean anthracene solution. Here too, the addition of HS resulted in the reduction of the respective fluorescence signals from the anthracene-containing PF. However, the effect of the dis-solved HS on the fluorescence signals was considerably less prominent than that for pyrene. Recall that for pyrene solu-tions, addition of 50 mg l−1 HS resulted in a 50% decrease of the fluorescence, however, under the same conditions, only a 25% decrease of the fluorescence was observed for anthracene.
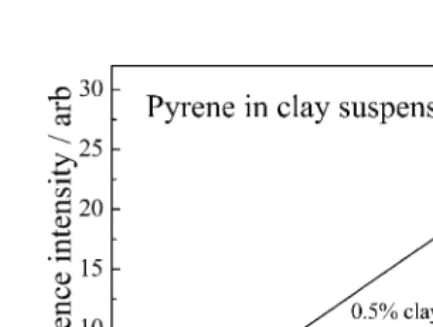
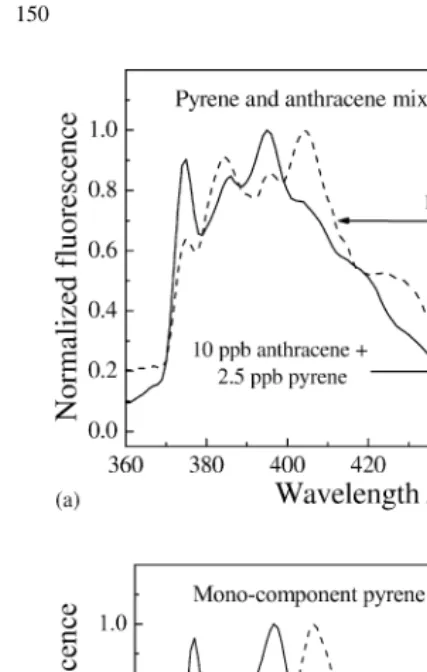
[image:5.842.315.535.68.229.2]Fig. 7. (a) Fluorescence spectra obtained from mixed pyrene and anthracene solutions. The spectra were obtained directly from the PAHs-containing polymer. (b) Fluorescence spectra of mono-component solutions of pyrene and anthracene, obtained directly from the PAHs-containing polymer.
The effect of clay suspensions upon anthracene quan-tification is also shown in Fig. 6. Here too, similar to the HS-related findings, the fluorescence decrease is consider-ably less prominent than that for pyrene. Therefore, in re-spect of the experimental observations presented here, we suggest that chemical and physical characteristics of such matrices as HS and/or clay particles would affect different PAHs through similar mechanisms.
3.1.5. Analysis of PAH mixtures
Contaminated water resources are expected to contain var-ious PAH pollutants. In this section we examine the feasibil-ity of proper sampling and analysis of PAH mixtures using the PF sensor.
[image:6.842.64.278.65.401.2]PAH solutions containing 10g l−1anthracene and vari-ous concentrations of pyrene (0.3–2.5g l−1) were prepared and analyzed using the PF sensor. The fluorescence spec-tra, obtained from two mixed PAH solutions, are shown in Fig. 7a. The corresponding reference spectra, obtained from the mono-component solutions of pure pyrene and an-thracene are given inFig. 7b. Inspection of the spectral de-tails indicates that the relative contribution of the individual
Fig. 8. Calibration plots pyrene in PAH mixtures (anthracene concen-tration was 10g l−1). The data for both pyrene and anthracene in the mono-component solutions, as well as the data from the corresponding mixed solutions are given. The arithmetic summation of the fluorescence from the mono-component solutions is also shown.
components to the mixture spectra is mainly affected by the corresponding fluorescence quantum efficiencies.
The full-featured spectra obtained from the PAH mixture, could presumably allow for analysis of the individual com-ponents, as long as the s/n ratio is adequate. The binary data presented here indicates that chemometric techniques, such as principal component regression (PCR) or partial least squares (PLS), could resolve more complicated mix-tures. However, handling real PAH mixtures requires further chemometric investigation[37].
Apparently, the spectra obtained using the PF sensor and the s/n ratio reached here, indicate that mixture analysis is feasible at the relevant concentration range. It is well known from similar spectral analysis cases, that good performance is only possible in simple mixtures (not too many compo-nents) and proper relative concentrations (comparable inten-sities). Improved results can be obtained by a proper selec-tion of the spectral range used [38]. However, a complete chemometric investigation of analysis of PAH mixtures, is out the scope of this paper.
It is important to find out whether the spectra obtained from the mixture are a linear combination of the spectra of the individual components. This characteristic determines the applicability and the performance of the chemometric algorithms applied for analysis. This issue has been exam-ined, and the results are shown inFig. 8.
[image:6.842.324.541.67.244.2]The fluorescence of the mixed solutions and the arithmetic summation of the relevant mono-component data, are the same, within the experimental error bars. This indicates that in the PAH concentration range studied in this experiment, non-linear effects, such as self-absorption related processes, do not affect PAH quantification. Therefore, reliable identi-fication and quantiidenti-fication of composite solutions could be assessed through application of rather simple chemometric algorithms.
3.1.6. Overall evaluation of the PF sensor
In the previous sections we have examined the applica-bility of the PF sensor to remote analysis of PAHs within complex environments. We have varied the conditions and pushed them to the limits where severe changes in the calibration plots were observed. In principle, the observed changes in the slopes of the calibration plots can be handled by multivariate analysis. However, this requires construc-tion of a large enough training set, which has to be obtained before the actual analysis is performed. Therefore, finding the operational conditions where simple analysis can still be carried out, is of interest. For this purpose, we checked the limiting concentrations of humic compounds and clay sus-pensions that still allow for accurate analysis using a simple calibration scheme. When accepting deviations of up to 5% from the true values, we found that the presence of humic substances at concentrations up to 2 ppm do not interfere with the PAH analysis. Under the same conditions, we found that the presence of clay suspension at concentrations up to 300 ppm (w/w) do not interfere with the analysis either.
Since the actual concentration of these (and similar) com-pounds in clean water are usually lower than the above val-ues, we conclude that the PF sensor can be safely applied for PAH analysis under such conditions. Note, that the sensor’s LOD for PAHs are much below the ppb range, which is the relevant range for clean water, where indeed, the HS and clay concentrations are low enough.
When considering the overall capabilities of the PF sen-sor, we have to emphasize that this is a pre-concentrating device and its performance depends of the integrating time (the time that the sensor is immersed in water). If the PAH concentration is high enough, a very short integration time is required. One should wait longer for handling very low concentrations. Moreover, when interfering compounds are present, a longer sampling time might be needed.
[image:7.842.305.545.100.179.2]We carried out several series of experiments in order to quantitatively evaluate the above effects. In these experi-ments, we measured the time required for obtaining a given detection limit, under various conditions. The results are presented in Table 1. Note that detection limit of 1 ppb is reached practically instantaneously in clean water, and when the concentration of interfering compounds is at a standard level for drinking water. In the presence of very high con-centrations of HS and clay suspensions, a few minutes are needed for PAH analysis. Note also the lowest detection limit of 0.01 ppb, which is also reached within an acceptable time.
Table 1
Time needed to reach given LODs (s/n=3) for pyrene, in various complex solutions
LOD (g l−1)
Clean solution
25 mg l−1 HS solution
0.25% (w/w) clay suspension
1 Instantaneous 2 min 10 min
0.1 10 min 20 min 60 min
0.05 20 min 40 min 150 min
0.025 40 min 60 min 10 h
0.01 4 h 8 h Not tested
The detection limits obtained by the PF sensor in the pres-ence of either HS or clay suspension were similar to those of the clean PAH solution. For these, however, considerably longer duration was needed to reach such detection limits. This is obviously related to the previously addressed matrix effects. The conclusion is that the PF sensor is applicable to PAH analysis in a variety of conditions, and various inter-ferences can be overcome by extending the sampling time.
Another very important point is that the absolute perfor-mance of the PF sensor depends on the optical set-up and the LIF instrumentation used. The same polymeric film would perform differently when coupled to different fluorescence detecting devices. Therefore, and in order to allow for a sort of universal calibration, we report here also the performance of the fluorescence probe itself (without the PF). For this purpose, we carried out analyses with the same probe (just without the film), and under the same experimental condi-tions. The results are presented inTable 2.
The data of this table indicate a significant improvement of the PF sensor relative to the bare LIF probe. A 100-fold decrease of the detection limit resulted by applying the PF for the analysis of pyrene within the clay suspension. Even more, a 250-fold increase of the detection limit resulted in the analysis within the HS solution. Note also that the best reported limit of detection of the PF sensor is much lower than the best figure obtained by the regular LIF probe.
The reached limits of detection of the LIF probe itself are between 0.2 and 2.5 ppb, for various interferences. This is acceptable (compared to similar probes[26]), but definitely not the best probe available in the market. It is expected that the performance of the PF sensor is improved when using a better LIF probe.
Another important point is the reproducibility of the PF, which has been examined using a set of films prepared under the same conditions and exposed to the same contamination. The standard deviation was of ca. 0.5%, when applying the procedure described in the experimental section. Note,
how-Table 2
LODs (s/n=3,g l−1) for pyrene, using conventional fluorescence probe
Clean solution 25 mg l−1 HS solution 0.25% (w/w) clay suspension
[image:7.842.306.547.704.735.2]ered the calibration plot slopes only at very high concen-trations. The maximum concentration of these interfering agents that still allow for direct calibration have been estab-lished. Beyond these limits, multivariate analysis must be applied.
Our results indicate potential application for remote anal-ysis, through optical fibers. This sensor performs better than a standard remote LIF probe. It was shown that the PF sen-sor improves the detection limits of PAHs within complex water samples by a factor of a 100, for clay suspensions and by a factor of 250 for humic substances containing water.
Acknowledgements
This study was supported by the James Franck Program in Laser Matter Interaction, by the Grand Water Research Institute and by the Israel Ministry of Labor. VVG and VB are grateful for financial support by the Israel Ministry of Adsorption, provided to new immigrant scientists.
References
[1] E. Manoli, C. Samara, Tren. Anal. Chem. 18 (1999) 417. [2] D.A. Lane, in: L.D. Hansen, D.J. Eatough (Eds.), Polycyclic
Aro-matic Hydrocarbons: Atmospheric Physics and Chemistry, Organic Chemistry of the Atmosphere, CRC Press, Boca Raton, 1991, Chap-ter 5.
[3] R. Kotzick, R. Niessner, Fresen. J. Anal. Chem. 354 (1996) 72. [4] W. Chudyk, Environ. Sci. Technol. 23 (1989) 504.
[5] M. Fisher, I. Schechter, in: R.A. Meyers (Ed.), Polynuclear Aro-matic Hydrocarbons Analysis in Environmental Samples,
Encyclo-[16] C. Zhu, G.M. Hieftje, Anal. Chem. 62 (1990) 2079.
[17] S.A. Merschman, D.C. Tilotta, Appl. Spectrosc. 52 (1998) 106. [18] G. Schwotzer, I. Latka, H. Lehmann, R. Willsch, Sens. Actuators B
39 (1997) 150.
[19] Y. Lu, L. Han, J.B. Brinker, T.M. Niemczyk, G.P. Lopez, Sens. Actuators B 35 (1996) 517.
[20] F.L. Dickert, M. Tortschanoff, W.E. Bulst, G. Fischerauer, Anal. Chem. 71 (1999) 4559.
[21] A. Abdelghani, J.M. Chovelon, N.J. Renault, M. Lacroix, H. Gang-naire, C. Veillas, B. Berkova, M. Chomat, V. Matejec, Sens. Actua-tors B 44 (1997) 495.
[22] P.S. Schwarz, S.P. Wasik, Anal. Chem. 48 (1976) 524. [23] J.J. Jandris, R.K. Force, Anal. Chim. Acta 175 (1985) 333. [24] W.R. Biggs, J.C. Fetzer, Trend Anal. Chem. 15 (1996) 196. [25] R. Kotzick, R. Niessner, Fresen. J. Anal. Chem. 354 (1996) 72. [26] S. Hassoon, I. Schechter, Anal. Chim. Acta 368 (1998) 77. [27] T. Inoue, V. Gridin, T. Ogawa, I. Schechter, Anal. Chem. 70 (1998)
4333.
[28] M. Fisher, Ch. Sluszny, B. Horowitz, V. Bulatov, V. Gridin, S. Hassoon, I. Schechter, Int. J. Environ. Anal. Chem. 74 (1999) 9. [29] V. Gridin, T. Inoue, T. Ogawa, I. Schechter, Instrum. Sci. Technol.
28 (2000) 131.
[30] C. Sluszny, V. Gridin, V. Bulatov, I. Schechter, Rev. Anal. Chem. 19 (3–4) (2000) 303.
[31] C. Sluszny, V. Gridin, V. Bulatov, I. Schechter, Fresen. J. Anal. Chem. 370 (2001) 69.
[32] C. Sluszny, V. Bulatov, V. Gridin, I. Schechter, Photochem. Photobiol. 74 (2001) 780.
[33] C.A. Parker, Photoluminescence of Solutions, Elsevier, Amsterdam, 1968.
[34] G. Jones, L.I. Indig, New J. Chem. 20 (1996) 221.
[35] B. Xing, J.J. Pignatello, B. Gigliotti, Environ. Sci. Technol. 30 (1996) 2432.
[36] B. Horowitz, V. Gridin, V. Bulatov, I. Schechter, Anal. Chem. 70 (1998) 3191.