The visual reaction time distribution in the tasks with different demands
on information processing
Rudolf Psotta*
Faculty of Physical Culture, Palacký University, Olomouc, Czech Republic
Copyright: © 2014 R. Psotta. This is an open access article licensed under the Creative Commons Attribution License (http://creative-commons.org/licenses/by/4.0/).
Background: Reaction tests are a part of the neuropsychological assessment of the individual. The design of these tests and selection of the appropriate measures of reaction time (RT) should come out from the distribution qualities of RTs. According to the newer general theory of RT distribution, the quality of RTs also depends on the specific properties of a reaction task. Objective: The aim of the study was to examine the dependency of RT distribution on an amount of processed information in a visual reaction test, and to verify the stability of RT distribution between two series of RTs in male adolescents. Methods: 25 male adolescents, aged 17.1 ± 1.1 years, performed four different eye–hand visual reaction tests which differed in a number of choices – simple reaction test (RT1), two, three and four-choice RT tests (RT2, RT3, RT4). Each test involved 2 series with 20 reaction trials in each series, using the computer-based reactometer device. The first, second and third moments of the RT distribution were assessed – the measures of central tendency (mean, median), variability (% CV, median absolute deviation/median ratio – MAD/Mdn, inter-quartile range) and normality (Kolmogorov-Smirnov test, skewness and kurtosis coefficient α and β). Significance of differences of RTs was assessed by the Wilcoxon test (α = .05). Results: The analysis showed the non-Gaussian distributions of RTs (α = .01) with the skew to the right (α = 1.18–4.38) and leptocurtic distribution (β = 1.89–34.15) in all types of the RT tests. The measures of RT variability % CV and MAD/Mdn (%) were lower for the RT1 test as compared to the RT2, RT3 and RT4 tests. No significant differences in RTs measured in the 1st and 2nd series of trials
were found in the RT1 test and RT2 test in contrast to significantly shorter RTs in the 2nd series of trials in the RT 3
test and RT4 test (p = .006 and p < .001). RTs measured in the 2nd series of trials of RT
1, RT2 and RT4 tests manifested
distribution with a higher skewness to the right and higher peakedness than the RTs in the 1st series. Conclusions: The
study supported the hypothesis on asymmetric distribution of RTs, specifically when measured in the both eye–hand visual simple and multiple-choice reaction tasks with two up to four choices. Thus, the nonparametric statistics show to be more appropriate for analysis of RTs than the parametric statistics. For both clinical and research purposes, the two series of twenty reaction trials in a computer-based test can provide a sufficient number of the RT data for reliable assessment of visual simple and choice-reaction abilities in the male adolescents.
Keywords: choice reaction, simple reaction, RT distribution, skewness, data stability, adolescent
Reaction time (RT) measured in a simple reaction test reflects the time interval needed to detect the stimulus, select and program a movement response, and conduct of the neural commands from the central neural system to muscles. In comparison to a simple reaction time (SRT), the choice reaction time (CRT) includes the more complex cognitive information pro-cessing including distinguishing the exposed stimulus from other alternative stimuli and selection of appro-priate response (Schmidt & Lee, 2011).
With an increase in the number of choices in a reac-tion task the amount of informareac-tion needed to be pro-cessed increases. This relation has been described by
Introduction
The visual simple and multiple-choice reaction tests are a part of the neuropsychological assessment of indi-viduals in the various domains as evaluation of precon-ditions for professions in military, security and traffic services, further in sport, and diagnostics in medicine, physiotherapy and developmental psychology.
the Hick-Hyman law with definition of RT as a logarith-mic function of the number of choices (Seow, 2005). SRTs and CRTs are usually used as the indicators of information processing capacities and psycho-motor executive functions in individuals (Moskowitz, 2003).
One of the issues of the visual RT tests is the set-ting of their appropriate length, e.g. the number of reaction trials needed for valid and reliable prediction of individual’s psychomotor functioning. There is the psychometric rule that too short or too long a test may reduce the test validity (Blahuš, 1989). Because of the considerable sensitivity of RT to a range of psycho-logical and physiopsycho-logical factors (e.g. Cote et al., 2009; Davranche, Audiffren, & Denjean, 2006) rather long test procedures with hundreds of the reaction trials have been used in research on RTs (e.g. Sanders, 1998; Saville et al., 2011).
However, in both research and clinical practice the shortened test procedures with 20–60 reaction trials are used, exposed in one to three series of trials with short rest intervals between the series (e.g. Chmura, Krysztofiak, Ziemba, Nazar, & Kaciuba-Uścilko, 1998; Czech Ministry of Transport, 2010; Dykiert, Der, Starr, & Deary, 2012a; Zemková, Miklovič, & Hamar, 2009a, 2009b). Then, several methodological problems may be connected to assessment of reaction abilities from a small number of RTs (Whelan, 2008). The first question is how many RTs or series (sets) of RTs are sufficient to obtain valid and reliable informa-tion. In some studies the mean of a certain count of the best RTs in the better or best of two or three series, respectively, of reaction trials was used to assess reac-tion ability of an individual (e.g. Zemková & Hamar, 2009; Zemková et al., 2009a). This problem relates to the stability over repeated trials of RTs. Although using random ordering of stimuli and variable time intervals of their exposure, it is necessary to consider the pos-sible influence of familiarization, learning effect and also the sequential effects of the immediately preced-ing stimulus and earlier stimuli on the response to a current stimulus (Gao, Wong-Lin, Holmes, Simen, & Cohen, 2009).
Another problem is which outlying RTs to elimi-nate as potentially false, and so what method to use for their elimination from the data for calculation of outcome measures in a individual. Neurophysiological limits of visual perception and response selection form a clearer criterion for eliminating extremely short RTs, which could be caused by fast guessing (Hervey et al., 2006). According to Luce (1986) genuine RTs are at least 100 ms.
The choice of a method for eliminating extremely long RT as the outliers is markedly more difficult. One of the possible approaches is to use an absolute time,
percentage of the data or a proportion of standard deviations above mean as cutoffs (Whelan, 2008; Rat-cliff, 1993). The disadvantage of using absolute cutoffs is that there is no reliable rule for setting such cut-offs due to high dependence on the particular observed data. Therefore, a proportion of SD above the mean seems to be more advantageous. However, the slow RTs located far from the RT mean or median demonstrate strong relationships with a number of cognitive and neurological conditions and thus diagnostic validity rather than the mean or best RTs (Saville et al., 2011).
The problem mentioned above is connected with a problem of the RT distribution. Although the para-metric statistics is traditionally used for assessment of the central tendency and variability of RTs, the current studies on RT clearly have demonstrated the asymmet-ric (non-Gaussian) RT distribution characterized by a skew to the right, e.g. rise rapidly on the left to short RTs and having a long tail on the right to longer RTs (e.g. Whelan, 2008; Hervey et al., 2006). According to the newer general theory of RT distributions by Mos-coso del Prado Martín (2008), the shape of RT distri-bution depends, besides the participants, on concrete properties of a reaction task. However, the potencial effect of the amount of information processing, e.g. a number of alternative couples of stimulus-response (R-S) involved in a visual reaction task has not been systematically investigated.
Therefore on the basis of the methodogical prob-lems with the reaction tests highlighted above, the aim of the study was to examine the dependency of RT dis-tribution on a number of choices (R-S) in an eye–hand visual reaction time test, and to verify the stability of reaction times and RT distribution between two series of RTs in male adolescents.
Methods
Participants
This study has been realized in a frame of the project which was approved by the faculty ethics com-mittee before submitting to the Czech Science Founda-tion followed by the approval by the psychology and education panel of the Czech Science Foundation. The testing was carried out after receiving informed written consent from school principals, the participants and their parents unless the sons were 18.0 years of age.
Data procedures
In the four visual reaction tests with the different num-ber of choices (S-R) – the simple reaction test (RT1) and two, three and four-choice reaction tests (RT2, RT3 and RT4, respectively), the RT distribution was assessed by the three moments of distribution (Saville et al., 2011) – by the central tendency measures of RTs as the first moments, variability measures of RTs as the second moments, and skewness and kurtosis as the third moments of RT distribution. The selected mea-sures of these moments of RT distribution were also analysed on their stability between two series of reac-tion trials.
The visual reaction time tests
The visual RT tests were carried out using the com-puter-based reactometer device FiTRO Reaction Check (Fitronic s. r. o., Bratislava, Slovakia). The device was composed of buttons (75 × 75 mm) connected through an interface to a computer with the software (more technical details on the device – see Zemková & Hamar, 2009).
During one testing session each participant per-formed the RT1, RT2, RT3 and RT4 tests in a random order with a 5 min rest interval between individual tests. Each test included two series of twenty reaction trials on exposed visual stimuli, with 1 min rest interval between these two series of reaction trials. The task for the participant was to react as fast as possible with a correct response to each visual stimulus that appeared on the 380 × 210 mm screenof, by pressing the appro-priate button.
The geometric figures of a red colour on a white background were exposed as stimuli – a circle in the RT1 test, a circle and cross in the RT2 test; circle, square and cross in the RT3 test; and circle, square, triangle and cross in the RT4 test. The figures were generated by software in a random order with same probability, in random variable intervals of 100–3000 ms after press-ing the button on the precedpress-ing stimulus. An incorrect response was not accepted. The RT was measured to the time of pressing the relevant button for the given stimulus.
In the case of the RT1 test, the participant con-trolled the button with the index finger of his preferred
(writing) hand. For the choice reaction tests the but-tons were placed on the table in a row at a distance of 20 cm from inner sides of two adjacent buttons. In the RT2 and RT4 tests one, and two buttons, respectively, were controlled with the right and left index fingers, and with right and left index and middle fingers, respec-tively. In the RT3 test two buttons were controlled with the index and middle finger of the preferred hand, and the rest third button with the index finger of the non-preferred hand. Before each RT test, the participant was provided with verbal task instruction and per-formed ten practice trials.
Statistical analysis
The statistical analysis was carried out with the follow-ing sequential steps:
1st step: elimination of outlying short RT ≤ 100 ms.
2nd step: calculation of the parametric and
non-para-metric measures of the 1st moment of RT distribution,
e.g. central tendency – mean (M) and median (Mdn) of RTs; the measures of the 2nd moment of the RT
distribution, e.g. variability – standard deviation (SD) and coefficient of variation % CV (SD/M · 100) as the parametric measures, and the median absolute devia-tion (MAD), ratio MAD/Mdn and interquartile range (IQR) as the non-parametric measures.
These measures were calculated from all RTs of all participants, achieved in a given series of reaction trials of a given RT test, e.g. from 500 individual RTs (25 participants × 20 RTs). The intra-individual means, medians and % CV of RTs were also calculated from 20 RTs achieved by a participant in a given series of RTs in the given RT test.
3rd step: testing of normality of the RT distribution
for each series of reaction trials of a given RT test using the Kolmogorov-Smirnov test (α = .01) (RTs from the entire group, n = 500).
4th step: because the non-normal distribution of RTs
in both 1st and 2nd series of reaction trials in the all RT
tests was found in the 3rd step, the following detailed
measures of non-normality were calculated:
a) skewness as the deviation of the distribution from symmetry by calculation of the skewness coefficient
α, with the following interpretation: α = 0 implies the symmetry; α < 0 and α > 0 indicates the skew of the distribution to the left and right, respectively. b) kurtosis of the distribution by calculation of the
Testing of normality of intra-individual RTs and calculation of skewness and kurtosis as 3rd moment
of RT distribution were not carried out due to their irrelevance in the case of calculation them from a small number of RTs (n= 20) in one series of reactions trials.
5th step: testing of difference between RTs achieved
in the 1st and 2nd series of reaction trials in a given type
of the RT test using the Wilcoxon matched-pairs test (α = .05). The RTs from the entire group were included.
For statistical analysis statistical software Statistica (Version 10; StatSoft, Inc., Tulsa, OK, USA) was used.
Results
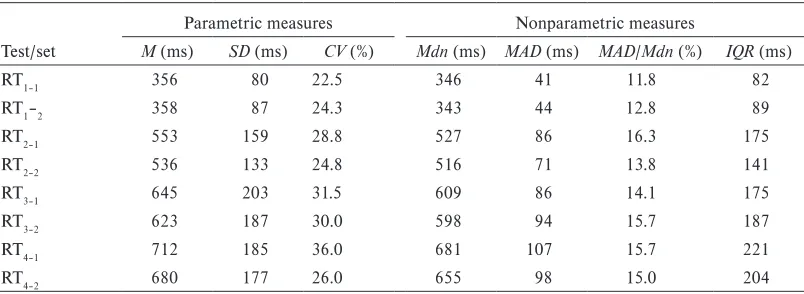
Both mean and median of all RTs of all the group found in both 1st and 2nd series of reaction trials increased
with an increasing a number of choices in the RT tests, e.g. from the RT1 test up to the RT4 test (Table 1). From the 600 intra-individual comparisons of the RT means and RT medians among all couples of the different types of the RT tests (while the series of trials of the same order compared), only seven and six compari-sons, respectively, showed lower values in the RT test with a higher number of choices as compared to the RT test with lower number of choices.
As the measures of relative variability of RTs, both the parametric CV (%) and nonparametric MAD/Mdn
ratio (%) of the RTs of all the group were shown to be lower for the RT1 test than in the all multiple-choice reaction tests (Table 1). The intraindividual % CV
of RTs in the RT1 test were slightly lower than in the multiple-choice reaction tests – the mean of % CV of RTs was in the 1st and 2nd series of reaction trials 18.8%
and 21.4% in the RT1 test in comparison with 23.4% and 19.1% in the RT2 test, 22.4% and 24.4% in the in the RT3 test, and 21.2% and 22.6% in the RT4 test. In each type of the RT test and series of the reaction trials, the median of the RTs of all the group was lower than the mean of these RTs (Table 1). This finding sug-gested the non-normal RT distributions subsequently confirmed by the results of the Kolmogorov-Smirnov test (Figures 1–4). In addition, the medians of intra-individual RTs were shorter than intra-intra-individual RT means in the 76%, 80%, 86% and 82% of the individual series of 20 reaction trials in the RT1, RT2, RT3 and RT4 test, respectively. These results suggested a high prevalence of asymmetrical distribution of the intra-individual RTs.
Positive values of the skewness coefficient α found for the distribution of RTs of all the group in all the types of RTtests indicated a clear skew of the RT dis-tribution to the right, e.g. to longer RTs (Figures 1–4). Concurrently with this skewness, the RT distribution in all the RT tests was shown to be more peaked than the normal one is as the kurtosis coefficients β were positive (Figures 1–4).
Results of the Wilcoxon test showed no significant difference in RTs of all the group achieved in the 1st
series and 2nd series of reaction trials, both in the RT 1
test and RT2 test (z = 0.423, p = .672, and z = 1.412,
p = .157). On the other hand, RTs of all the group
Table 1
The parametric and nonparametric measures of reaction times (RTs) of all the group achieved in the 1st and 2nd series of twenty reaction trials (calculated from 500 RTs; 25 subjects × 20 trials) in the RT 1,
RT2, RT3 and RT4 test
Test/set
Parametric measures Nonparametric measures
M (ms) SD (ms) CV (%) Mdn (ms) MAD (ms) MAD/Mdn (%) IQR (ms)
RT1–1 356 80 22.5 346 41 11.8 82
RT1–2 358 87 24.3 343 44 12.8 89
RT2–1 553 159 28.8 527 86 16.3 175
RT2–2 536 133 24.8 516 71 13.8 141
RT3–1 645 203 31.5 609 86 14.1 175
RT3–2 623 187 30.0 598 94 15.7 187
RT4–1 712 185 36.0 681 107 15.7 221
RT4–2 680 177 26.0 655 98 15.0 204
Figure 1. Reaction time distributions found in the simple reaction test. RT1–1, RT1–2 = reaction times in the 1st and 2nd series of reaction trials, respectively, of the simple reaction test. K-S test =
Kolmogorov--Smirnov test, p = a level of significance, α = skewness coefficient, β = kurtosis coefficient.
Figure 2. Reaction time distributions found in the two-choice reaction test. RT1–1, RT1–2 = reaction times in the 1st and 2nd series of reaction trials, respectively, of the simple reaction test. K-S test =
Kol-mogorov-Smirnov test, p = a level of significance, α = skewness coefficient, β = kurtosis coefficient.
Figure 3. Reaction time distributions found in the three-choice reaction test. RT1–1, RT1–2 = reaction times in the 1st and 2nd series of reaction trials, respectively, of the simple reaction test. K-S test =
achieved in the 2nd series of reaction trials of both
the RT3 test and RT4 test were significantly shorter than those in the 1st series (z = 2.756, p = .006, and z = 3.552, p < .001). However, if the intra-individual comparisons of RTs were performed, only three and four participants achieved significantly shorter RTs in the 2nd series of reaction trials than in the first one in
the RT3 test and RT4 test, respectively.
When the coefficients α and β for RTs of all the group measured in the 1st and 2nd series of reaction
trials were compared, the RT distribution measured in the 2nd series of trials showed to be more skewed to
the right and concurrently more peaked in comparison with the RTs in 1st trials, in the all types of RT tests
with exception of the RT3 test (Figures 1–4).
If the M + 3 SD value was used as the cutoffs crite-rion, the elimination of long outlying RTs would affect 0.8%, 1.1%, 1.4% and 1.4% of RTs in the RT1, RT2, RT3 and RT4 test, respectively.
Discussion
The aim of the study was to examine the distribution of visual RTs including central tendency, variability and normality of RTs, with the focus on the dependency of these distribution qualities of RTs on the amount of processed information, e.g. a number of the choices involved in a reaction task. The mean of RTs of all the group achieved in the 1st and 2nd series of the
reac-tion trials prolonged with the increase in a number of choices – by 55.3% and 49.7%, respectively, in the RT2 test as compared to the RT1 test, by 16.6% and 16.2%, respectively, in RT3 test as compared to the RT2 test,
and by 10.4% and 8.4%, respectively, in the RT4 test as compared to the RT3 test.
The same trend of prolongation of RTs with an increase in a number of choices was observed if the median of RTs of all the group was used. This trend was confirmed in other studies focused on the visual reac-tion; specifically the shorter RTs in the simple reaction task as compared with the RTs in the two-choice reac-tion task in the football players (Straume-Naesheim, Andersen, & Bahr, 2005) and four-choice reaction task in the children and adolescents (Der & Deary, 2006; Dykiert et al., 2012a).
Even though the aim of the study was not to verify the fit of the RTs to the logarithmic function accord-ing to the Hick-Hyman law (Seow, 2005), the progres-sive reduction in increment of the RT with increasing number of choices (see the data above in the 1st
para-graph of the discussion) suggested the relevance to the logarithmic model of RTs and so the validity of the RTs obtained in this study. This conclusion was also sup-ported by the results of the intra-individual compari-sons of both the mean RT and median RT achieved in any couple of the RT tests with the different number of choices. 94.3% and 94.7% of these intra-individual comparisons corresponded to the following theoretical suggestion: RT1 < RT2 < RT3 < RT4.
An interesting trend observed was the lower vari-ability of RTs of all the group indicated by % CV and the MAD/Mdn ratio in the simple reaction (RT1) test than in the multiple-choice reaction tests. As calcu-lated from the RTs from all participants, these mea-sures reflect both inter- and intra-individual variability of RTs. However, the findings of slightly lower % CV
of the intra-individual RTs in the RT1 test than in the
Figure 4. Reaction time distributions found in the four-choice reaction test. RT1–1, RT1–2 = reaction times in the 1st and 2nd series of reaction trials, respectively, of the simple reaction test. K-S test =
multiple-choice tests (see 2nd paragraph of the results)
could support the suggestion about the tendency of the lower intra-individual variability of RTs in the visual simple reaction task as compared with the multiple-choice reaction tasks. In the study by Dykiert et al. (2012a) it is possible clearly deduce the lower intra-individual variability of RTs in the simple reaction task in the participants under 18 years. This deducation is based on the fact that the mean intra-individual stan-dard deviation of RTs was found more than seven times lower in the simple reaction task than in the four-choice reaction task while intra-individual mean of RTs in the simple reaction task was roughly two times lower only. One can hypothesized that with more complex cogni-tive information processing and decision about motor response the more extensive fluctuation of RTs could be expected.
Also the inter-individual variability of RTs seemed to be lower in the simple reaction test than in the multiple-choice reaction tests. This suggestion was deduced from the fact that differences between the inter-individual % CV of RTs (Table 1) and the mean intra-individual % CV of RTs (see results) were larger for the multiple-choice reaction tests as compared with the slight difference between these two types of % CV of RTs in the simple reaction test. Because multiple-choice reactions are associated with higher demands on cogni-tive information processing, the individual differences in perceptual and cognitive functioning could reflect into the larger inter-individual differences in RTs. It has been considered the inter-individual variability in a wide range of basic and higher cognitive functions including perception, motor control, memory, atten-tion and metacogniatten-tion (Kanai & Rees, 2011).
The Kolmogorov-Smirnov test applied on RTs of all the group indicated the non-normal RT distributions, both in the RT1 test and multiple-choice reaction tests. According to the skewness coefficients α (Figures 1–4) the cause of the RT non-normality was a skew to the right towards longer RTs. Although the distribution normality of intra-individual RTs was not analysed for a small number of individual RTs in one series (n = 20), 80% of the individual series of the trials had the shorter median RT in comparison to the mean RT. The findings of the kurtosis coefficient β > 0 (Figures 1–4) presented the leptocurtic RT distributions and indicated a larger number of RTs around the RT mean. The shapes of the non-normal RT distribution revealed for both visual simple and choice reaction tests in the study correspond to the respected model of the non-Gaussian RT distribution (Palmer & Horowitz, 2011; Whelan, 2008).
The study was also focused on examination of RT stability between two exposed series of RTs separated
with one-minute rest interval in each type of the RT test used. When RTs from all the group were included, no significant difference between RTs performed in the 1st and 2nd series of reaction trials were found in
the RT1 test and RT2 test (α = .05). In addition, while doing the intra-individual comparisons, only one from 25 participants achieved significantly shorter RTs in the 2nd series of trials than in the 1st series of trials
in the RT2 test, and even one participant significantly shorter RTs already in the 1st series of trials than in the
2nd series of trials of the RT
1 test (α = .05).
In contrast to the RT1 and RT2 tests, in the RT3 and RT4 tests RTs in the 2nd series of trials were significantly
shorter than RTs in 1st series (α = .05) when RTs of all
the group were included into the analysis. When intra-intraindividual comparisons of RTs were completed (α = .05), 11 and 15 of 25 participants demonstrated for the RT3 test and the RT4 test, respectively, a shorter median of RTs in the 2nd series of trials as compared to
the RTs in the1st series of trials. However, these
differ-ences were significant only in the three and four par-ticipants, respectively. In spite of the suggestion about the improvement in RTs during three or four series of reaction trials due to familiarization and/or learning effect (Zemková & Hamar, 2009), these results indicate that if the particular stimuli are exposed in a random order and in randomly variable time intervals, and a preceding short practice (ten trials in the study), RT in the 2nd repeated series of reaction trials may not differ
significantly from RT from the 1st series, especially in
the RT1 and RT2 tests.
The RT stability between two series of reaction trials was also evaluated by the stability of the third moment of RT distribution – the skewness. A slight increase in skewness of RT distribution to the right was observed in the 2nd series of RTs in all RT tests with
exception of the RT3 test. While the non-significant dif-ferences of RT in 1st and 2nd series of trials mentioned
above, the increased skewness to the right could indi-cate some reduction in the proportion of outlying long RT with concurrent increasing of their “outlyingness” from the mean.
Despite the study by Saville et al. (2011) suggesting twenty reaction trials not to be sufficient number of trials for acceptable reliability of the intra-individual RT variability measures, this study has suggested quite good stability of RTs for the first series of twenty trials, however, rather for the simple and two-choice reaction tests than for the tests with higher number of choices.
computerized RT tests involved in the neuropsycho-logical test batteries as the ImPact with 1 week test-retest reliability ICC = .78–.88 in young adults subjects (Resch et al., 2013), the ANAM battery with 1 week test-rest reliability r = .29–.46, and ICC = .24–.38 in the adolescents (Segalowitz et al., 2007), and the Cog-sport tests with 2 weeks test-retest reliability ICC = .73 for SRTs, and ICC = .65 for CRTs in football players (Straume-Naesheim, Andersen & Bahr, 2005). The logical limitation of the study is that interpretation of the findings are valid for male adolescents only due to age and sex differences in RTs and their intra-individual variability (Dykiert et al., 2012a, 2012 b; Silverman, 2006).
Conclusion
The study showed the both simple and two, three and four-choice eye–hand visual reaction times measured in male adolescents have an asymmetric distribution with a skew to the right and concurrently higher peak-edness in comparison to the normal Gaussian model. Therefore, in contrast to traditional use of parametric measures, nonparametric measures should be used for the both inter- and intra-individual analyses of reaction times. The study showed the two series of twenty reac-tion trials in a computer-based test provide a sufficient number of reaction times for reliable assessment of visual simple reaction and choice-reaction abilities in the male adolescents.
Acknowledgment
The study was supported by the Czech Science Foun-dation in the frame of the project No. P407/11/0946.
I thank the principals, teachers and students of two high schools in Prague and Olomouc for participation in the study. I would like to thank my students Michal Bělovský, Mgr. Ludvík Valtr and Bc. Svatoslav Valenta for assistance during data collecting, and prof. Jan Hendl for consultation about the statistics.
References
Blahuš, P. (1989). Základní pojmy statistické teorie psycho-logických testů [Basic concepts of the statistical theory of psychological testing]. Československá psychologie, 33, 223–241.
Chmura, J., Krysztofiak, H., Ziemba, A. W., Nazar, K., & Kaciuba-Uścilko, H. (1998). Psychomotor performance during prolonged exercise above and below the blood
lactate threshold. European Journal of Applied Physiology, 77, 77–80.
Cote, K. A., Milner, C. E., Smith, B. A., Aubin, A. J., Grea-son, T. A., Cuthbert, B. P., … Duffus, S. E. G. (2009). CNS arousal and neurobehavioral performance in a short-term sleep restriction paradigm. Journal of Sleep Research, 18, 291–303.
Czech Ministry of Transport. (2010). Manuál doporučených
psychodiagnostických metod pro vyšetřování a posuzování psy-chické způsobilosti k řízení motorických vozidel [Manual of diagnostic psychological methods for screening and assess-ment of psychological competency to driving cars]. Praha: Author. Retrieved from http://www.contexo.cz/files/ other/filemanager/Files/Doprava/Manual_doporucene_ psdg_postupy.pdf/
Davranche, K., Audiffren, M., & Denjean, A. (2006). A dis-tributional analysis of the effect ofphysical exercise on a choice reaction time task. Journal of Sports Sciences, 24, 323–330.
Der, G., & Deary, I. J. (2006). Age and sex differences in reaction time in adulthood: Results from the United King-dom health and lifestyle survey. Psychology and Aging, 21, 62–73.
Dykiert, D., Der, G., Starr, J. M., & Deary, I. J. (2012a). Sex differences in reaction time mean and intraindividual variability across the life span. Developmental Psychology, 48, 1262–1276.
Dykiert, D., Der, G., Starr, J. M., & Deary, I. J. (2012b). Age differences in intra-individual variability in simple and choice reaction time: Systematic review and
meta-analysis. PLOS ONE, 7(10), e45759. doi:10.1371/journal.
pone.0045759.
Gao, J., Wong-Lin, K., Holmes, P., Simen, P., & Cohen, J. (2009). Sequential effects in two-choice reaction time
tasks: Decomposition and synthesis of mechanisms.
Neu-ralComputation, 21, 2407–2436.
Hervey, A. S., Epstein, J. N., Curry, J. F., Tonev, S., Arnold, L. E., Conners, C. K., … Hechtman, L. (2006). Reaction time distribution analysis of neuropsychological
perfor-mance in an ADHD sample. Child Neuropsychology, 12,
125–140.
Kanai, R., & Rees, G. (2011). The structural basis of inter-individual differences in human behaviour and cognition.
Neuroscience, 12, 231–242.
Luce, R. D. (1986). Response times: Their role in inferring elementary mental organization. New York, NY: Oxford University Press.
Moscoso del Prado Martín, F. (2008). A theory of
reac-tion time distribureac-tions. Retrieved from http://cogprints. org/6310/1/recinormal.pdf
Moskowitz, H. (2003). New directions – processing (response) time as an indicator of cognitive processes and its possible link with sensory attributes. Journal of Sensory Studies, 18, 144–162.
Palmer, E. M., & Horowitz, T. S. (2011). What are the shapes of response time distributions in visual search?
Journal of Experimental Psychology: Human Perception and Performance, 37, 58–71.
Resch, J., Driscoll, A., McCaffrey, N., Brown, C., Ferrara, M. S., Macciocchi, S., … Walpert, K. (2013). ImPact test-retest reliability: Reliably unreliable? Journal of Athletic Training, 48, 506–511.
Sanders, A. F. (1998). Elements of human performance: Reac-tion processes and attenReac-tion in human skill. Mahwah, NJ: Lawrence Erlbaum Associates Publishers.
Saville, C. W. N., Pawling, R., Trullinger, M., Daley, D., Intri-ligator, J., & Klein, C. (2011). On the stability of instabil-ity: Optimising the reliability of intra-subject variability of reaction times. Personality and Individual Differences, 51,
148–153.
Schmidt, R. A., & Lee, T. D. (2011). Motor control and
learn-ing (5th ed.). Champaign, IL: Human Kinetics.
Segalowitz, S. J., Mahaney, P., Santesso, D. L., MacGregor, L., Dywan, J., & Willer, B. (2007). Retest reliability in adolescents of a computerized neuropsychological battery used to assess recovery from concussion. NeuroRehabilita-tion, 22, 243–251.
Seow, S. C. (2005). Information theoretic models of HCI: A
comparison of the Hick-Hyman law and Fitt’s law.
Human-Computer Interaction, 20, 315–352.
Silverman, I. W. (2006). Sex differences im simple visual reaction time: A historical meta-analysis. Sex roles, 54, 57–68.
Straume-Naesheim, T. M., Andersen, T. E., & Bahr, R. (2005). Reproducibility of computer based neuropsycho-logical testing among Norwegian elite football players. Brit-ish Journal of Sports Medicine, 39(Suppl. I), 64–69. Whelan, R. (2008). Effective analysis of reaction time data.
The Psychological Record, 58, 475–482.
Zemková, E., & Hamar, D. (2009). Toward an understanding of agility performance. Boskovice: Albert.
Zemková, E., Miklovič, P., & Hamar, D. (2009a). There is a relationship between intensity of exercise and reaction time on laterally concordant and discordant stimuli. Acta Kinesiologica, 3(1), 59–63.