R E S E A R C H
Open Access
Recognizing emotion from Turkish speech
using acoustic features
Caglar Oflazoglu and Serdar Yildirim
*Abstract
Affective computing, especially from speech, is one of the key steps toward building more natural and effective human-machine interaction. In recent years, several emotional speech corpora in different languages have been collected; however, Turkish is not among the languages that have been investigated in the context of emotion recognition. For this purpose, a new Turkish emotional speech database, which includes 5,100 utterances extracted from 55 Turkish movies, was constructed. Each utterance in the database is labeled with emotion categories (happy, surprised, sad, angry, fearful, neutral, and others) and three-dimensional emotional space (valence, activation, and dominance). We performed classification of four basic emotion classes (neutral, sad, happy, and angry) and estimation of emotion primitives using acoustic features. The importance of acoustic features in estimating the emotion primitive values and in classifying emotions into categories was also investigated. An unweighted average recall of 45.5% was obtained for the classification. For emotion dimension estimation, we obtained promising results for activation and dominance dimensions. For valence, however, the correlation between the averaged ratings of the evaluators and the estimates was low. The cross-corpus training and testing also showed good results for activation and dominance dimensions.
Keywords: Turkish emotional speech database; Emotion recognition; Emotion primitives estimation; Cross-corpus evaluation
1 Introduction
Recognizing the emotional state of the interlocutor and changing the way of communicating accordingly play a crucial role for the success of human-computer inter-action. However, many technical challenges need to be resolved before integrating a real-time emotion recog-nizer into human-computer interfaces. These challenges include, as in any pattern recognition problem, data acqui-sition and annotation, feature extraction and finding the most salient features, and building a robust classifier. In this paper, we address each of these problems in the con-text of emotion recognition from Turkish speech and perform a cross-corpus evaluation.
The lack of data is a major challenge in emotion recogni-tion. Even though great efforts have been made to collect emotional speech data in recent years, there is still a need for emotional speech recordings to cope with the
*Correspondence: [email protected]
Computer Engineering Department, Mustafa Kemal University, Iskenderun, 31200, Hatay, Turkey
problem of data sparseness. One way to obtain emo-tional speech data is to use human subjects reading utter-ances, generally with a certain number of pre-determined and emotionally neutral sentences, in specified emotional states. Berlin database of emotional speech [1], Danish Emotional Speech [2], LDC Emotional Prosody Speech and Transcripts [3], and Geneva Multimodal Emotion Portrayals (GEMEP) [4] are examples of studio-recorded emotional speech databases.
Even though studio-recorded (acted) databases provide us more balanced data in terms of the number of utter-ances per emotion, emotions are less natural and real-istic compared to those we encounter in real life. One way to overcome this problem is to create environments so that the subjects produce the desired emotions. Sen-sitive Artificial Listener (SAL) [5], Airplane Behaviour Corpus (ABC) [6], Speech Under Simulated and Actual Stress (SUSAS) [7], TUM Audiovisual Interest Corpus (AVIC) [6], Interactive Emotional Dyadic Motion Cap-ture (IEMOCAP) [8], the SEMAINE database [9], and the FAU Aibo emotion corpus [10] are examples of such
databases. For example, the FAU Aibo emotion corpus consists of 9 h of German spontaneous speech of 51 chil-dren interacting with Sony’s pet robot Aibo. A Wizard-of-Oz technique was used for data collection and then the speech data was annotated with 11 emotion cate-gories by five annotators at word level [10]. Audio-visual recordings obtained from TV shows and movies are also used for data acquisition, e.g., Vera-Am-Mittag (VAM) database [11], Situation Analysis in Fictional and Emo-tional Corpus (SAFE) [12], and the Belfast Naturalistic Database [13]. For example, the VAM corpus consists of audio-visual recordings taken from German TV talk show called Vera-Am-Mittag. The corpus contains 946 sponta-neous speech from 47 participants of the show. The SAFE corpus [12] contains 7 h of audio-visual data extracted from English fiction movies and is mainly constructed for the purpose of fear-type emotion recognition system. In this paper, we utilized Turkish movies and TV shows to obtain speech data since the emotional speech extracted from movies is more realistic than studio-recorded emo-tions expressed by actors reading some pre-defined sentences.
An important requirement of most data-driven systems is the availability of annotated data. The goal of annotation is to assign a label to data. For the emotion recogni-tion task, the annotarecogni-tion is needed to determine the true emotion expressed in the collected speech data. Largely motivated from psychological studies, two approaches were employed within the emotion recognition research for emotion annotation. The classical approach is to use set of emotion words (categories) to describe emotion-related states. Even though there are ongoing debates concerning how many emotion categories exist, the emo-tion categories (fear, anger, happiness, disgust, sadness, and surprised) defined by Ekman [14] are commonly used in most of the studies on automatic emotion recogni-tion. However, the main disadvantage of the categorical approach is that it fails to represent a wide range of real-life emotions. The second approach is to use continuous multidimensional space model to describe emotions. In this approach, the emotion is defined as points in multi-dimensional space rather than a small number of emotion categories. Dimensions in this approach are called emo-tion primitives. The most commonly used dimensions are valence, activation, and dominance. Valence represents negative to positive axis, activation represents calm to excited axis, and dominance represents weak to strong axis in 3D space. The most common databases such as the FAU Aibo emotion corpus, Situation Analysis in Fictional and Emotional Corpus (SAFE), Airplane Behaviour Cor-pus (ABC), and TUM Audiovisual Interest CorCor-pus (AVIC) were annotated with the categorical approach. Only a few databases exist where emotions are represented by emo-tion primitives. Sensitive Artificial Listener (SAL) [5] and
Vera-Am-Mittag (VAM) [11] are labeled with the dimen-sional approach. To our knowledge, among the common databases, only a few of them includes both categori-cal and dimensional labeling such as IEMOCAP [8] and Belfast Naturalistic Database [15].
Many previous efforts have addressed emotion recog-nition by employing pattern recogrecog-nition techniques using segmental and/or supra-segmental information obtained from speech [6,16-26]. Acoustic parameters of speech sig-nal have been used extensively to separate emotiosig-nal col-oring present in the speech. Acoustic features are obtained from low-level descriptors (LLDs) such as pitch, energy, duration, Mel-frequency cepstral coefficients (mfcc), and voice quality parameters by applying functionals (mean, median, percentiles, etc.). Comprehensive list of LLDs and functionals is given in [27]. Linguistic information can also be used for emotion recognition especially when the speech data is spontaneous [16,18,22,25,28-31]. In this study, we only considered acoustic features and used the same feature set given in the INTERSPEECH 2010 Paralinguistic Challenge [32].
In this paper, we also performed cross-corpus evalua-tions where the system is trained on one corpus and tested on another. Only a few studies provide such cross-corpus results [33,34]. In [34], cross-corpus evaluation results of six well-known emotional speech databases were pro-vided. In this work, we provided cross-corpus results using the VAM database.
This paper is organized as follows. Section 2 describes Turkish emotional speech database. Section 3 explains the feature extraction and selection procedures. Experimen-tal setup and results are given in Section 4. Section 5 concludes the paper.
2 Turkish emotional speech database
In recent years, several corpora in different languages have been collected; however, Turkish is not among the languages that has been investigated in the context of emotion recognition. As an attempt to create a TURkish
Emotional Speech databasea (TURES), we have recently
extracted and annotated a large amount of speech data from 55 Turkish movies [35].
2.1 Acquisition
0 100 200 300 400 500 582 0
20 40 60 80 100 120 140 160
Number of Utterances
Speaker ID Figure 1The number of utterances per speaker.
format that contains audio data in Dolby Digital (AC-3) (six channel) format. Then, the audio channel that con-tains the dialogues was separated from other audio chan-nels for each movie and saved as a separate file at 48 kHz, 16 bit, mono, PCM-wave format. In the final stage of the data acquisition process, the audio data containing dia-logue sequences were segmented into utterances manually by two native Turkish speakers. During the segmentation procedure, the utterances that are affected by background noise/music were removed from the database, resulting in 5,303 utterances. The utterances that have low intelligi-bility were also removed from the database. As a result, 5,100 utterances from 582 (188 females, 394 males) speak-ers were obtained. The average length of the utterances is 2.34 s. The distribution of the utterances over the speak-ers is given in Figure 1 and Table 1. Note that having 448 of the speakers with less than ten utterances shows how diverse the database is, thus introduces a difficulty to the emotion recognition.
2.2 Annotation of emotional content
The annotation is needed to determine the true emo-tion expressed in the speech data. In this study, we employed both categorical and dimensional approaches for emotion annotation. In categorical approach, a set of emotion words are used to describe emotion-related states. On the other hand, in the dimen-sional approach, the emotion is defined as points in
Table 1 Distribution of utterances over speakers
Number of utterances Number of speakers
≥100 4
50 to 99 10
25 to 49 39
10 to 24 81
2 to 9 279
1 169
multidimensional space rather than a small number of emotion categories.
The emotion in each utterance was evaluated in a lis-tener test by a large number of annotators (27 university students) independently of one another. The annota-tors were asked to listen to the entire speech record-ings (randomly permuted) and assign an emotion label (both categorical and dimensional) for each utterance. The annotators only took audio information into consid-eration.
2.2.1 Categorical annotation
Utterances were labelled in seven emotional states:happy, surprised, sad, angry, fear, neutral, andothers. For each utterance, the final emotion label was computed from the majority label of the 27 annotators. The distribution of the utterances over emotion classes is given in Figure 2, and the distributions of the utterances over speakers for each emotion class are given in Figure 3. As expected, neutral is the majority of the expressed emotions.
For assessing the quality of the annotations (i.e., inter-annotator reliability), we used the Fleiss’ kappa metric [36]. The kappa,κ, is defined as,
κ = Pa−Pc 1−Pc
, (1)
0 200 400 582 0
20 40 60
Number of Utterances
Neutral
0 200 400 582 0
20 40
60 Sad
0 200 400 582 0
20 40
60 Happy
0 200 400 582 0
20 40
60 Angry
0 200 400 582 0
20 40 60
Number of Utterances
Surprised
0 200 400 582 0
20 40 60
Fear
SpeakerID
0 200 400 582 0
20 40 60
Other
Figure 3The distribution of utterances over speakers for each emotion class.
wherePais the proportion of times that thenevaluators
agree, andPcis the proportion of times we would expect
the nevaluators to agree by chance. The details of how Pa andPc can be calculated are as in [36]. If there is no
agreement among the evaluators,κ =0, andκ =1 when
there is full agreement. The kappa score computed for the agreement level of the emotion categories between the 27 annotators is 0.32. A score between 0.2 and 0.4 may be considered moderate inter-evaluator agreement.
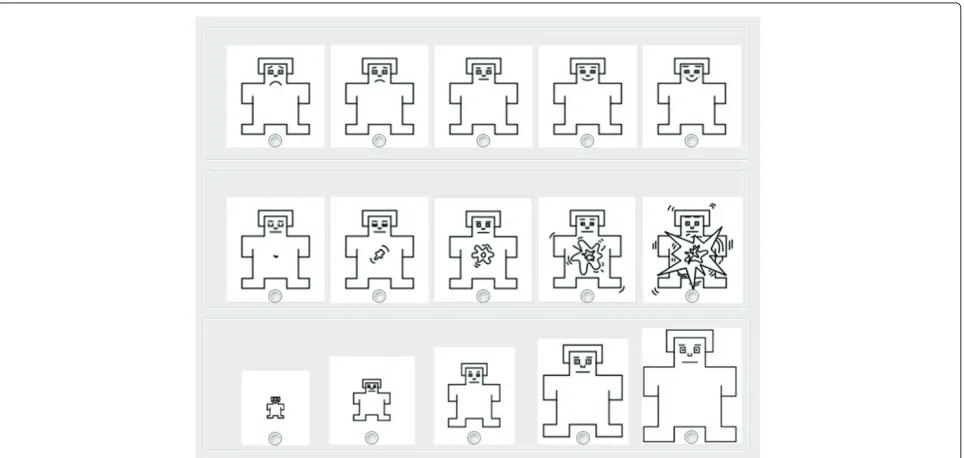
2.2.2 Annotation in 3D space
For the emotion labelling in 3D space, we followed the same procedure proposed in [11] for emotion primi-tives evaluation. Self-assessment manikins (SAMs) [37] (Figure 4) were used for measuring the emotional con-tent of each audio clip with ratings on a five-level scale between one and five for valence, activation, and domi-nance. Valence represents negative to positive axis, acti-vation represents calm to excited axis, and dominance
−1 0 1 0
500 1000 1500 2000
Frequency
Valence
−1 0 1
0 500 1000 1500 2000
Activation
−1 0 1
0 500 1000 1500 2000
Dominance
Figure 5Histograms of the emotions in the database.
represents weak to strong axis of three-dimensional emo-tion space. For each utterance in the database, anno-tators were asked to select one of the iconic image from the corresponding row for each of three dimen-sions. The ratings for each emotion dimension were later transformed to unity space [-1,1] [11]. To esti-mate the true emotion (ground truth) of each utterance based on 27 annotators, we simply took the mean of the annotator’s ratings. Figure 5 shows the histograms of the emotions based on the mean of the annotator’s ratings.
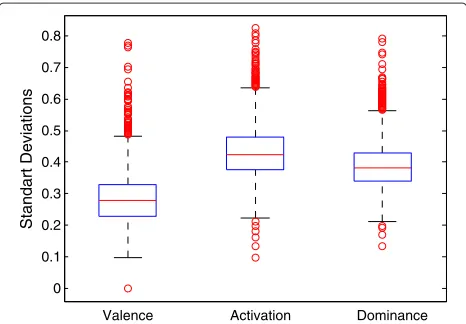
To measure the agreement among the annotators, the standard deviations can be calculated for each utter-ance. The correlation coefficients between the annota-tor’s ratings and the average ratings of all annotators can also be used to describe the inter-annotator reli-ability. In Figure 6, the distributions of the standard deviations are given in terms of box plots. The aver-ages of standard deviations are 0.28, 0.43, and 0.39 for valence, activation, and dominance, respectively, indicat-ing good agreement between annotators. The distribu-tion of the correladistribu-tion coefficients is given in Figure 7, and the related statistics are shown in Table 2. As can
0 0.1 0.2 0.3 0.4 0.5 0.6 0.7 0.8
Valence Activation Dominance
Standart Deviations
Figure 6The distributions of the standard deviations for each emotion primitives.Utterances with low standard deviation show high inter-annotator agreement.
0.2 0.3 0.4 0.5 0.6 0.7
Valence Activation Dominance
Correlation Coefficients
Figure 7The distribution of the correlation coefficients between the annotator’s ratings and the average ratings.High correlation coefficients show high inter-annotator agreement.
be observed from Table 2, the mean values of corre-lations between the annotator’s ratings and the average ratings for all dimensions show also high agreement (0.65, 0.61, and 0.56 for valence, activation, and dominance, respectively).
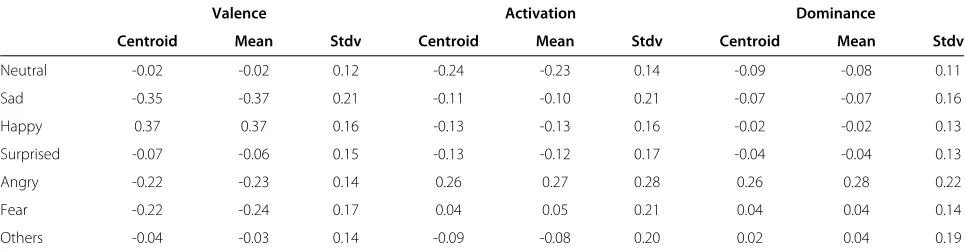
The distribution of categorical emotions in 3D space is shown in Figure 8. The class centroid, the mean, and the standard deviation of valence, activation, and dom-inance values of each emotion category are given in Table 3. The results show that angry speech data is neg-ative and strong, and has high activation. Sad speech data is very negative, whereas happy speech data is very positive compared to other emotions. It is worth to note that the standard deviation values of emotion classes are high, and this might be the reason for the moderate inter-evaluator agreement in the categorical space.
3 Acoustic features
In this study, we used the same feature set, a set of 1,532 acoustic features based on several acoustic low-level descriptors (LLDs) and statistics (functionals), used in the INTERSPEECH 2010 Paralinguistic Challenge [32]. We extracted these features using the openSMILE toolkit [27]. The LLDs include fundamental frequency (F0), loudness, voicing probability, 0-14 mfcc, 0 to 7 logarithmic power
Table 2 Statistics from the distribution of the correlation coefficients between the annotator’s ratings and the average ratings
Mean Stdv Min Max
Valence 0.65 0.08 0.44 0.75
Activation 0.61 0.10 0.43 0.76
Figure 8Distribution of emotion categories in 3D emotion space.
of Mel-frequency bands (logMelFreqBand), 0 to 7 line spectral pair frequencies computed from 8 LPC coeffi-cients (lspFreq), and the voice quality measures (shimmer and jitter). Delta coefficients of each these LLDs are also included.
Functionals applied to descriptors are absolute posi-tion (frame) of the maximum value (maxPos), absolute position (frame) of the minimum value (minPos), arith-metic mean of the contour (amean), slope of a linear approximation of the contour (linregc1), onset of a lin-ear approximation of the contour (linregc2), linlin-ear error computed as the difference of the linear approxima-tion and the actual contour (linregerrA), quadratic error computed as the difference of the linear approximation and the actual contour (linregerrQ), standard deviation of the values in the contour (stddev), skewness, kurto-sis, three first quartiles (quartile1: 25% percentile, quar-tile2: 50% percentile, and quartile3: 75% percentile), three inter-quartile ranges (iqr1-2: quartile1-quaritle2, iqr2-3: quartile2-quaritle3, and iqr1-iqr2-3: quartile1-quaritle3), outlier-robust minimum value of the contour (per-centile1.0), outlier-robust maximum value of the contour (percentile99.0), outlier robust signal range (pctlrange0-1), percentage of time the signal is above 75%×range+ minimum value (upleveltime75), and percentage of time the signal is above 90%×range+minimum signal value
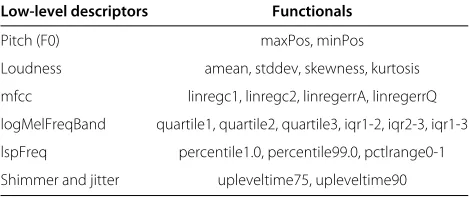
(upleveltime90). A summary of the acoustic features is given in Table 4.
3.1 Feature selection
To identify the most salient features and thus reduce the number of feature size, we performed feature selection. For this purpose, we used correlation-based feature selec-tion (CFS) [38]. The idea behind the correlaselec-tion-based feature selection technique is to find a subset in which features are uncorrelated with each other but highly cor-related to the class [38]. CFS is a filter-based subset feature evaluation algorithm that evaluates each feature subset using simple objective functions. The algorithm computes a heuristic measure of the ‘merit’ of the feature subsetS using Equation 2.
MeritS= √ krcf
k+k(k−1)rff
, (2)
where k is the number of features in subfeature
space S, rcf is the average class-feature correlation, and rff is the average feature-feature inter-correlation. CFS
calculates rcf and rff using a symmetric information
gain.
Since exhaustive search through all possible feature sub-sets is not feasible, sub-optimal but faster search functions such as hill climbing, genetic, best first, and random are
Table 3 Comparison of emotion class centroids, mean, and standard deviations (stdv) in the 3D emotion space
Valence Activation Dominance
Centroid Mean Stdv Centroid Mean Stdv Centroid Mean Stdv
Neutral -0.02 -0.02 0.12 -0.24 -0.23 0.14 -0.09 -0.08 0.11
Sad -0.35 -0.37 0.21 -0.11 -0.10 0.21 -0.07 -0.07 0.16
Happy 0.37 0.37 0.16 -0.13 -0.13 0.16 -0.02 -0.02 0.13
Surprised -0.07 -0.06 0.15 -0.13 -0.12 0.17 -0.04 -0.04 0.13
Angry -0.22 -0.23 0.14 0.26 0.27 0.28 0.26 0.28 0.22
Fear -0.22 -0.24 0.17 0.04 0.05 0.21 0.04 0.04 0.14
Table 4 Overview of low-level descriptors and functionals
Low-level descriptors Functionals
Pitch (F0) maxPos, minPos
Loudness amean, stddev, skewness, kurtosis
mfcc linregc1, linregc2, linregerrA, linregerrQ
logMelFreqBand quartile1, quartile2, quartile3, iqr1-2, iqr2-3, iqr1-3
lspFreq percentile1.0, percentile99.0, pctlrange0-1
Shimmer and jitter upleveltime75, upleveltime90
usually chosen. In this work, we used best-first search method.
4 Emotion classification
In this paper, we focused on four major emotion classes neutral, sad, happy, and angry, and did not include surprised, fear, and other classes in the classification experiments. We evaluated performances of support vec-tor machine (SVM) with radial basis kernel function (SVM-RBF) implemented in the LIBSVM library [39] and Bayesian Networks (BayesNet) provided by the Weka pat-tern recognition tool [40,41]. The performance of SVM highly depends on the parameters used. In order to opti-mize the SVM performance, we used grid search with fivefold cross validation to select the penalty parameter for mislabeled examplesCand Gaussian parameterγ. We also linearly scaled each attribute to the range [0,1]. The scaling parameters for each attribute were calculated from the training data of each fold, and same scaling factors are applied to both corresponding training and testing data.
The performance of the classifiers was evaluated by tenfold cross-validation. To ensure the speaker indepen-dence, no instance of a test subject is allowed to be in the train dataset of each fold. For each experiment, the feature selection is performed using CFS to the train-ing set of each fold. The results are presented in terms of confusion matrix, weighted average (WA) recall, and unweighted average (UA) recall. WA recall is defined as the ratio of the number of correctly classified instances to the total number of instances in the database. As classes are unbalanced in the databases, we also reported UA recall. UA recall is the average of per-class accuracies and more useful than WA recall when the distribution of classes is highly skewed.
4.1 Categorical classification results
First, we evaluated the relative importance of the seven low-level descriptors of acoustic features using BayesNet classifier. The performances are shown in Figure 9 in terms of UA recall. It can be seen that logarithmic power of Mel-frequency bands and mfcc seem to have more discriminative power than other LLDs.
0.32 0.34 0.36 0.38 0.4 0.42 0.44
Unweighted Average Recall (%)
Loudness VQ
VoiceProp F0
LspFreq LMelFB Mfcc
Figure 9The classification performances of each LLD in terms of unweighted average recall.VQ, voice quality (jitter and shimmer); LMelFB, log mel frequency band.
The classification results are given in Table 5 in terms of confusion matrix. We obtain 70.9%, 26.8%, 13.1%, and 62.4% recall rates using SVM and 48.5%, 41.4%, 22.5%, and 69.7% recall rates using BayesNet forneutral, sad, happy, andangryclasses, respectively. Overall, we obtain good recall rates forneutral, sad, andangryclasses. However, the recognition accuracy for thehappyclass is about the chance level.
4.2 Emotion primitives estimation
Support vector regression (-SVR) with the radial basis kernel function [42] is used in this paper as it has shown promising results in performing emotion primitives
esti-mation [19]. The -SVR design parameters, the
com-plexity C, , and the kernel parameter γ are selected using grid-search with fivefold cross validation. For all regression experiments, LIBSVM [39] implementation
of -SVR was used. The performance of the estimators
was evaluated in terms of correlation coefficient (CC), mean absolute error (MAE), and root-mean-square error (RMSE).
Table 5 Performances for categorical emotion classification
SVM-RBF BayesNet
Neutral Sad Happy Angry Neutral Sad Happy Angry
Neutral 1,524 205 133 288 1,042 485 271 352
Sad 289 152 42 84 172 235 72 88
Happy 218 39 53 94 122 66 91 125
Angry 381 63 74 859 209 65 143 960
WA recall 57.5% 51.8%
UA recall 43.3% 45.5%
0 0.1 0.2 0.3 0.4 0.5 0.6 0.7 0.8
CC
Loudness VQ
VoiceProp F0
LspFreqLMelFB Mfcc
0.12 0.14 0.16 0.18 0.2 0.22
MAE
Loudness VQ
VoiceProp F0
LspFreqLMelFB Mfcc
0.16 0.18 0.2 0.22 0.24 0.26 0.28
RMSE
Loudness VQ
VoiceProp F0
LspFreqLMelFB Mfcc
V A D
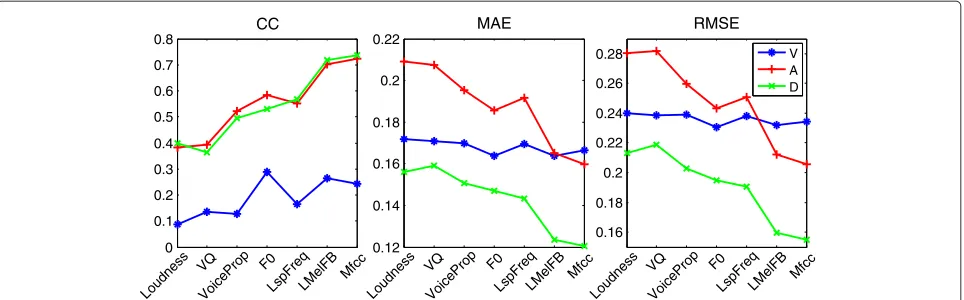
Figure 10Performance comparisons of different acoustic feature groups for each emotion primitive for TURES database.Results are shown in terms of correlation coefficient (CC), mean absolute error (MAE), and root-mean-square error (RMSE).
CC=
N
i=1(xi− ¯x)(yi− ¯y)
N
i=1(xi− ¯x)2
N
i=1(yi− ¯y)2
(3)
MAE= 1
N N
i=1
xi−yi (4)
RMSE=
1
N N
i=1
(xi−yi)2, (5)
whereNis the number of speech data in the database,xis the true value, andyis the predicted value.
For the cross-corpus experiments, we employed the VAM database [11]. The VAM corpus consists of audio-visual recordings taken from German TV talk show called Vera-Am-Mittag. The corpus contains 946 spontaneous utterances from 47 participants of the show, and each utterance was labeled using a discrete five-point scale for three-dimensional emotion space of valence, activation, and dominance by 6 to 17 labelers.
4.2.1 Estimation results
First, we evaluated the relative importance of each LLD in emotion estimation. The performance comparisons of dif-ferent acoustic feature groups for each emotion primitives using support vector regression are given for the TURES
database in Figure 10. For this task, the -SVR parame-tersC,γ, andwere set to 1, 0.01, and 0.001, respectively. The results are based on tenfold cross validation. As can be seen from Figure 10, for activation and dominance, mfcc are the most informative low-level descriptors fol-lowed by logarithmic power of Mel-frequency bands (LogMelFreqBand). For valence, F0, LogMelFreqBand and mfcc have more discriminative power than other LLD groups.
The regression results for emotion primitives are given in Table 6. The results show that all emotion primitives are estimated with a small mean absolute error, 0.166, 0.156, and 0.119 for TURES database and 0.149, 0.160, and 0.153 for the VAM database, for valence, activation, and dominance, respectively. The regression results in terms of correlation coefficient show good results for activation and dominance for both databases. For valence, how-ever, the correlation between the averaged ratings of the annotators (reference values) and the SVR estimates was low (only 0.288 for TURES and 0.310 for VAM).
Research shows that language and culture play an important role in how vocal emotions are perceived [43]. Recently, a few studies present results on cross-corpus evaluations, i.e., training on one and testing on a different one [34]. However, most of the work employed either different databases of the same language or Germanic
Table 6 The estimation performances for TURES and VAM databases
Valence Activation Dominance
Train Test CC MAE RMSE CC MAE RMSE CC MAE RMSE
TURES TURES 0.288 0.166 0.232 0.739 0.156 0.201 0.743 0.119 0.153
VAM TURES 0.131 0.204 0.275 0.624 0.191 0.246 0.649 0.165 0.208
VAM VAM 0.310 0.149 0.196 0.810 0.160 0.202 0.761 0.153 0.196
TURES VAM 0.289 0.170 0.219 0.743 0.189 0.238 0.717 0.178 0.225
Speech
Signal Feature Selection
Valence Estimator
Activation Estimator
Dominance Estimator
Classifier
Emotion Class Neutral
Hapy Sad Angry
Figure 11Block diagram of the approach to classify emotional classes using emotion primitives.
languages. Turkish is an agglutinative language, i.e. new words can be formed from existing words using a rich set of affixes. In this study, we performed cross-corpus exper-iments between the Turkish emotional speech database and the VAM corpus. The cross-corpus results were given in Table 6. It can be seen from the table that the cross-corpus training and testing seems to work especially for activation and dominance dimensions. For example, when TURES is chosen for training and VAM for test-ing, the correlation coefficients of 0.743 and 0.717 with 0.189 and 0.178 mean absolute errors were obtained for activation and dominance, respectively. For valence, like intra-corpus experiments, the cross-corpus results were not promising. This result indicates that acoustic infor-mation alone is not enough to discriminate emotions in valence dimension. These results are consistent with previous research [44]. Other sources of information, such as linguistic information, are needed in order to obtain better discrimination results in valence dimension [31].
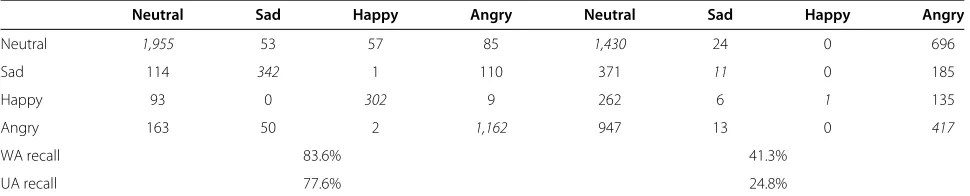
4.2.2 Emotion classification from the emotion primitives As a final experiment, we used the emotion primitives to classify emotion classes. A block diagram of the approach is shown in Figure 11. We used SVR to estimate the emotion primitives from acoustic features, and for the classification, BayesNet classifier is employed. First, we assumed perfect primitive estimation and used true labels as a feature set for training and testing the classifier. This
experiment will show the upper bound of the classifica-tion performance. Table 7 shows that a recogniclassifica-tion rate of 77.6% in terms of UA recall can be achieved using true emotion primitive values. However, when we used regres-sion estimates, the classification performance is about random. The underlying reason is the low regression performance for the valence dimension.
5 Conclusion
In this work, we carried out a study on emotion recog-nition from Turkish speech using acoustic features. In recent years, several corpora in different languages have been collected; however, Turkish is not among the lan-guages that has been investigated in the context of emotion recognition. In this paper, we presented the Turkish Emotional Speech Database and reported the baseline results. Categorical representations and dimen-sional descriptions are two common approaches to define emotion present in speech. In categorical approach, a fixed set of words is used to describe an emotional state, whereas in the dimensional approach, emotion is defined as points in the multidimensional space. The three most common dimensions used are valence, activation, and dominance which represent the main properties of emotional states. In this work, both categorical evalua-tion and emoevalua-tion primitive estimaevalua-tion were performed. An unweighted average recall of 45.5% was obtained for the classification. For emotion dimension estimation, the regression results in terms of correlation coefficient are promising for activation and dominance, with 0.739 and 0.743, respectively. For valence, however, the correlation between the averaged ratings of the evaluators (reference values) and the SVR estimates was low (only 0.288). In this study, we also performed cross-corpus evaluations, and the results were promising especially for activation and dominance dimensions. This result indicates that acoustic information alone is not enough to discriminate emotions in valence dimension. Future work includes the use of linguistic information to improve the classification and regression results especially for valence.
Table 7 Emotion classification results from three-dimensional emotion primitives
Neutral Sad Happy Angry Neutral Sad Happy Angry
Neutral 1,955 53 57 85 1,430 24 0 696
Sad 114 342 1 110 371 11 0 185
Happy 93 0 302 9 262 6 1 135
Angry 163 50 2 1,162 947 13 0 417
WA recall 83.6% 41.3%
UA recall 77.6% 24.8%
Endnotes
a The Turkish emotional speech database is available to
the research community through the website http://www. turesdatabase.com.
Competing interests
The authors declare that they have no competing interests.
Acknowledgements
This work was supported by the Turkish Scientific and Technical Research Council (TUBITAK) under project no. 109E243.
Received: 14 May 2013 Accepted: 14 October 2013 Published: 5 December 2013
References
1. F Burkhardt, A Paeschke, M Rolfes, W Sendlmeier, B Weiss, A database of, German emotional speech. Paper presented at the Interspeech 9th European conference on speech, communication and technology. Lisbon, Portugal, 4–8 Sept 2005
2. IS Engberg, AV Hansen,Documentation of the Danish Emotional Speech
Database. (Aalborg University, Aalborg, 1996)
3. M Liberman, K Davis, M Grossman, N Martey, J Bell,Emotional Prosody,
Speech and Transcripts. (Linguistic Data Consortium, Philadelphia, 2002)
4. T Banziger, M Mortillaro, K Scherer, Introducing the Geneva multimodal expression corpus for experimental research on emotion perception. Emotion.12, 1161–1179 (2012)
5. E Douglas-Cowie, R Cowie, I Sneddon, C Cox, O Lowry, M Mcrorie, J Claude Martin, L Devillers, S Abrilian, A Batliner, N Amir, K Karpouzis, in Affective Computing and Intelligent Interaction: Lecture Notes in Computer
Science, ed. by ACR Paiva, R Prada, and RW Picard. The HUMAINE
Database: addressing the collection and annotation of naturalistic and induced emotional data, vol. 4738 (Springer Berlin, 2007), pp. 488-500 6. B Schuller, B Vlasenko, F Eyben, G Rigoll, A Wendemuth, inIEEE Workshop
on Automatic Speech Recognition Understanding. Acoustic emotion
recognition: a benchmark comparison of performances (IEEE Merano, Italy, 13 Nov–17 Dec 2009)
7. JHL Hansen, S Bou-Ghazale, Getting started with SUSAS: a speech under simulated and actual stress database. Paper presented at the fifth European conference on speech communication and technology, EUROSPEECH 1997. Rhodes, Greece 22–25 Sept 1997
8. C Busso, M Bulut, CC Lee, A Kazemzadeh, E Mower, S Kim, J Chang, S Lee, S Narayanan, IEMOCAP: Interactive emotional dyadic motion capture database. J. Lang. Resour. Eval.42(4), 335–359 (2008)
9. G McKeown, M Valstar, R Cowie, M Pantic, inIEEE ICME. The SEMAINE corpus of emotionally coloured character interactions (Suntec City, 19–23 Jul 2010)
10. S Steidl,Automatic Classification of Emotion Related User States in
Spontaneous Children’s Speech. (University of Erlangen-Nuremberg,
Germany, 2009)
11. M Grimm, K Kroschel, S Narayanan, inIEEE International conference on
multimedia and expo (ICME). The Vera am Mittag German audio-visual
emotional speech database (IEEE Hannover, Germany, 23 Jun–26 Apr 2008)
12. C Clavel, I Vasilescu, L Devillers, T Ehrette, G Richard, inLREC. The SAFE Corpus: fear-type emotions detection for surveillance applications (Genoa, Italy, 24–26 May 2006)
13. E Douglas-Cowie, N Campbell, R Cowie, P Roach, Emotional speech: towards a new generation of databases. Speech Commun. Spec. Issue, Speech and Emotion.40, 33–60 (2003)
14. P Ekman, inHandbook of Cognition and Emotions, ed. by L Dalgleish, M Power. Basic emotions (Wiley New York, 1999), pp. 409–589 15. E Douglas-Cowie, R Cowie, M Schroder, inISCA Workshop on speech and
emotion. A new emotion database: considerations, sources and scope
(Newcastle UK, 5–7 Sept 2000)
16. J Ang, R Dhillon, A Krupski, E Shriberg, A Stolcke, inICSLP 2002. Prosody-based automatic detection of annoyance and frustration in human-computer dialog (ISCA Denver, Colorado, 16–20 Sept 2002) 17. TL Nwe, SW Foo, L De Silva, Speech emotion recognition using hidden
Markov models. Speech Commun.41(4), 603–623 (2003)
18. CM Lee, S Narayanan, Towards detecting emotions in spoken dialogs. IEEE T Speech Audi. P.13(2), 293–303 (2005)
19. M Grimm, K Kroschel, E Mower, S Narayanan, Primitives-based evaluation and estimation of emotions in speech. Speech Commun.49, 787–800 (2007)
20. BS Schuller, A Batliner, D Seppi, S Steidl, T Vogt, J Wagner, L Devillers, L Vidrascu, N Amir, L Kessous, V Aharonson, ineighth conference on
InterSpeech. The relevance of feature type for the automatic classification
of emotional user states: low level descriptors and functionals (ISCA Antwerp, Belgium, 27–31 Aug 2007)
21. C Clavel, I Vasilescu, L Devillers, G Richard, T Ehrette, Fear-type emotion recognition for future audio-based surveillance systems. Speech Commun.50(6), 487–503 (2008)
22. S Yildirim, S Narayanan, A Potamianos, Detecting emotional state of a child in a conversational computer game. Comput. Speech and, Lang. 25, 29–44 (2011)
23. EM Albornoz, DH Milone, HL Rufiner, Spoken emotion recognition using hierarchical classifiers. Comput. Speech and Lang.25(3), 556–570 (2011) 24. CC Lee, E Mower, C Busso, S Lee, S Narayanan, Emotion recognition using
a hierarchical binary decision tree approach. Speech Commun.53(9-10), 1162–1171 (2011). [Special issue: Sensing Emotion and Affect - Facing Realism in Speech Processing]
25. T Polzehl, A Schmitt, F Metze, M Wagner, Anger recognition in speech using acoustic and linguistic cues. Speech Commun.53(9-10), 1198–1209 (2011)
26. A Batliner, S Steidl, B Schuller, D Seppi, T Vogt, J Wagner, L Devillers, L Vidrascu, V Aharonson, L Kessous, N Amir, Whodunnit - searching for the most important feature types signalling emotion-related user states in speech. Comput. Speech Lang.25, 4–28 (2011)
27. F Eyben, M Wöllmer, B Schuller, ininternational conference on multimedia. openSMILE: the Munich versatile and fast open-source audio feature extractor (ACM Firenze, Italy, 25–29 Oct 2010)
28. S Arunachalam, D Gould, E Andersen, D Byrd, S Narayanan, inInterSpeech. Politeness and frustration language in child-machine interactions (Aalborg Denmark, 3–7 Sept 2001)
29. A Batliner, S Steidl, B Schuller, D Seppi, K Laskowski, T Vogt, L Devillers, L Vidrascu, N Amir, L Kessous, V Aharonson, infifth Slovenian and first
international language technologies conference. Combining efforts for
improving automatic classification of emotional user states (IS-LTC’06 Ljubljana, Slovenia, 9–10 Oct 2006)
30. B Schuller, A Batliner, S Steidl, D Seppi, inIEEE international conference on
acoustics, speech, and signal processing. Emotion recognition from speech:
putting ASR in the loop (IEEE Taipei, Taiwan, 19–24 Apr 2009) 31. B Schuller, Recognizing affect from linguistic information in 3D
continuous space. IEEE Trans. Affect. Comput.2(4), 192–205 (2012) 32. B Schuller, S Steidl, A Batliner, F Burkhardt, L Devillers, C Muller,
S Narayanan, inInterSpeech. The INTERSPEECH 2010 paralinguistic challenge (Makuhari Japan, 26–30 Sept 2010)
33. M Shami, W Verhelst, inSpeaker Classification II LNCS, ed. by C Müller. Automatic classification of expressiveness in speech: a multi-corpus study (Springer Berlin, 2007), pp. 43–56
34. B Schuller, B Vlasenko, F Eyben, M Wollmer, A Stuhlsatz, A Wendemuth, G Rigoll, Cross-corpus acoustic emotion recognition: variances and strategies. IEEE Trans. Affect. Comput.1(2), 119–131 (2010) 35. C Oflazoglu, S Yildirim, inIEEE 19th conference signal processing and
communications applications. Turkish emotional speech database
(IEEE Antalya, Turkey, 20–22 Apr 2011)
36. J Fleiss, Measuring nominal scale agreement among many raters. Psychol. Bull.76(5), 378–382 (1971)
37. M Bradley, PJ Lang, Measuring emotion: the self-assessment manikin and the semantic differential. J. Behav. Ther. Exp. Psychiatry.25, 49–59 (1994) 38. M Hall,Correlation-based feature selection for machine learning.
(PhD thesis, University of Waikato, New Zealand, 1999) 39. CC Chang, CJ Lin, LIBSVM: a library for support vector machines.
ACM Trans. Intell. Syst. Technol.2, 1–27 (2011)
40. M Hall, E Frank, G Holmes, B Pfahringer, P Reutemann, IH Witten, The WEKA data mining software: an update. SIGKDD Explor. Newsl.11, 10–18 (2009) 41. R Bouckaert. Bayesian Network Classifiers in Weka for Version 3-5-7,
42. AJ Smola, B Schölkopf, A tutorial on support vector regression. Stat. Comput.14(3), 199–222 (2004)
43. KR Scherer, R Banse, H Wallbott, Emotion inferences from vocal expression correlate across languages and cultures. J Cross Cult, Psychol. 32, 76–92 (2001)
44. M Grimm, K Kroschel, S Narayanan, inIEEE international conference on
acoustics, speech and signal processing. Support vector regression for
automatic recognition of spontaneous emotions in speech (Honolulu, HI, 15–20 Apr 2007)
doi:10.1186/1687-4722-2013-26
Cite this article as:Oflazoglu and Yildirim:Recognizing emotion from Turkish speech using acoustic features.EURASIP Journal on Audio, Speech, and Music Processing20132013:26.
Submit your manuscript to a
journal and benefi t from:
7Convenient online submission 7Rigorous peer review
7Immediate publication on acceptance 7Open access: articles freely available online 7High visibility within the fi eld
7Retaining the copyright to your article