Non-contiguous finished genome sequence of
type strain 4401737
TVéronique Roux1*, Catherine Robert 1 and Didier Raoult1.
1Aix Marseille Université, URMITE, Faculté de médecine, Aix-Marseille Université
*Correspondence: Véronique Roux ([email protected])
Keywords:
T is a member of the genus which contains
anaerobic Gram-negative bacteria. It was isolated from a human breast abscess. In this work, we describe a set of features of this organism, together with the complete genome sequence and annotation. The 3,169,464 bp long genome contains 2,746 protein-coding genes and 56 RNA genes, including 3 or 4 rRNA operons.
Introduction
T
(CIP 108522
T=
CCUG 50105
T) is the type strain of
bacterium was isolated from a human breast abscess
[1]. The genus
Gram-negative bacteria. It currently contains 47
members [2]. Recently, many species of the genus
often associated with the oral cavity [3-8], but also
from feces [9], amniotic fluid [10], blood cultures,
lung abscess pus, broncho-alveolar lavages [11] and
pleural fluids [12].
Here we present a summary classification and a set
of features for
description of the non-contiguous finished genomic
sequencing and annotation.
Classification and features
The 16S rRNA gene sequence o
4401737
Twas compared with sequences deposited
in the Genbank database, indicating that the initial
taxonomic classification is correct.
Figure 1 shows the phylogenetic neighborhood of
The bacterium was first characterized in 2004; it
was isolated from a 40-year-old woman who
underwent a breast abscess puncture. The organism
was in the liquid from the punctured abscess and
was cultured in the Timone Hospital microbiology
laboratory.
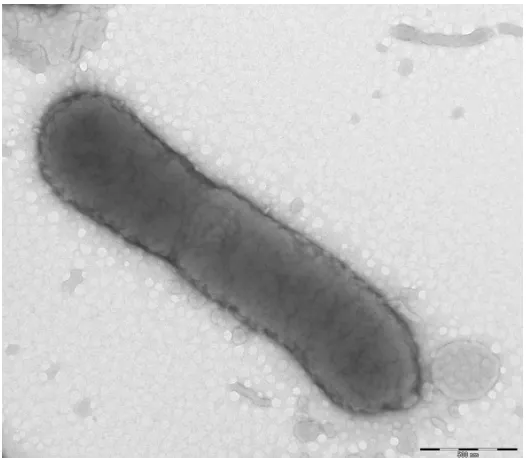
Cells are rods 0.8-1.4 µm long and 0.3-0.5 µm wide
and usually occurred singly. Optimal growth of
strain 4401737
Toccurs at 37°C with a range for
growth between 25 and 37 °C. After 72 hours growth
on blood sheep agar at 37°C, surface colonies are
circular, white-greyish, smooth, shiny,
non-pigmented and 1-2 mm in diameter. Carbon sources
utilized include ribose, glucose, lactose, maltose and
tagatose. Activities of alkaline phosphatase,
β-galactosidase, α-glucosidase,
N-acetyl-β-glucos-aminidase, α fucosidase, arginine arylamidase, leucyl
glycine arylamidase, alanine arylamidase are
detected. The fatty acid profile is characterized by
the predominance of C14:0 (19.5%), C16:0 (15.3%),
iso-C14:0 (14%) and a mixture of C18:2 ω6,9c and
C18:0 (16%). The size and ultrastructure of cells
were determined by negative staining transmission
electron microscopy. The rods were 0.8-1.4 μm long
and 0.3-0.5 μm wide (Figure 2, Table 1).
Genome sequencing and annotation
Genome project history
The organism was selected for sequencing on the
basis of its phylogenetic position and 16S rDNA
similarity to other members of the genu
and is part of study of the new species characterized
in our laboratory. A summary of the project
information is shown in Table 2. The EMBL
accession number is CBQQ010000001 and consists
of 148 contigs (
≥
500 bp) and 25 scaffolds (> 1,500
Roux, et al.
http://standardsingenomics.org 1345
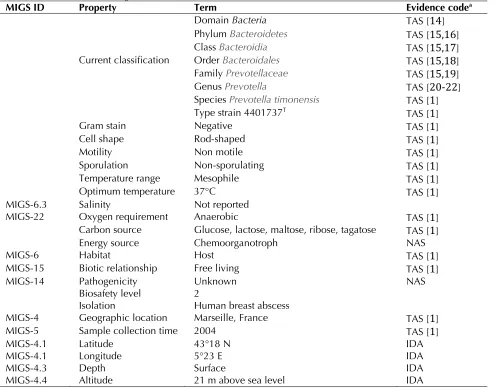
Table 1. Classification and general features ofT
MIGS ID Property Term Evidence codea
Domain Bacteria TAS [
14
]Phyl TAS [
15,16
]Clas TAS [
15,17
]Current classification Order TAS [
15,18
]Famil TAS [
15,19
]Genus TAS [
20-22
]Species TAS [
1
]Type strain 4401737T TAS [
1
]Gram stain Negative TAS [
1
]Cell shape Rod-shaped TAS [
1
]Motility Non motile TAS [
1
]Sporulation Non-sporulating TAS [
1
]Temperature range Mesophile TAS [
1
]Optimum temperature 37°C TAS [
1
]MIGS-6.3 Salinity Not reported
MIGS-22 Oxygen requirement Anaerobic TAS [
1
]Carbon source Glucose, lactose, maltose, ribose, tagatose TAS [
1
]Energy source Chemoorganotroph NAS
MIGS-6 Habitat Host TAS [
1
]MIGS-15 Biotic relationship Free living TAS [
1
]MIGS-14 Pathogenicity Biosafety level Isolation
Unknown 2
Human breast abscess
NAS
MIGS-4 Geographic location Marseille, France TAS [
1
]MIGS-5 Sample collection time 2004 TAS [
1
]MIGS-4.1 Latitude 43°18 N IDA
MIGS-4.1 Longitude 5°23 E IDA
MIGS-4.3 Depth Surface IDA
MIGS-4.4 Altitude 21 m above sea level IDA
Evidence codes - IDA: Inferred from Direct Assay; TAS: Traceable Author Statement (i.e., a direct report exists in the literature); NAS: Non-traceable Author Statement (i.e., not directly observed for the living, isolated sample, but based on a generally accepted property for the species, or anecdotal evidence). These evidence codes are from the Gene Ontology project [
23
]. If the evidence is IDA, then the property was directly observed for a live isolate by one of the authors or an expert mentioned in the acknowledgements.Figure 1. Part of a phylogenetic tree highlighting
the position o
4401737T relative to other type strains within
the genus
Figure 2. Transmission electron micrograph of
268D (Philips) at an operating voltage of 60kV. The scale bar represents 500 μm.
Table 2. Project information
MIGS ID Property Term
MIGS-31 Finishing quality High-quality draft
MIGS-28 Libraries used One paired end 3-kb library and two Shotgun libraries
MIGS-29 Sequencing platforms 454 GS FLX Titanium
MIGS-31.2 Fold coverage 78.12×
MIGS-30 Assemblers Newbler version 2.5.3
MIGS-32 Gene calling method Prodigal
EMBL ID CBQQ010000001
EMBL Date of Release June 18, 2013
Project relevance Study of new species isolated in the URMITE
Growth conditions and DNA isolation
T
was grown
anaerobically on 5% sheep blood-enriched Columbia
agar at 37°C. Five petri dishes were spread and
colonies resuspended in 3 ml of TE buffer. Three
hundred μl of 10% SDS and 150 μl of proteinase K
were then added and incubation was performed
over-night at 56°C. The DNA was then extracted
using the phenol/chloroform method. The yield and
the concentration were measured by the Quant-it
Picogreen kit (Invitrogen) on the Genios Tecan
fluorometer at 84.3 ng/µl.
Genome sequencing and assembly
Shotgun and 3-kb paired-end sequencing strategies
were performed. A shotgun library was constructed
with 500 ng of DNA with the GS Rapid library Prep
kit (Roche). For the paired-end sequencing, 5 µg of
DNA was mechanically fragmented on a Hydroshear
device (Digilab) with an enrichment size at 3-4 kb.
The DNA fragmentation was visualized using the
2100 BioAnalyzer (Agilent) on a DNA labchip 7500
with an optimal size of 3.7 kb. The library was
constructed according to the 454 GS FLX Titanium
paired-end protocol. Circularization and
nebulization were performed and generated a
pattern with an optimal size of 574 bp. After PCR
amplification through 17 cycles followed by double
size selection, the single stranded paired-end library
was then quantified using the Genios fluorometer
(Tecan) at 1070 pg/µL. The library concentration
equivalence was calculated as 3.42 x 10
9Roux, et al.
http://standardsingenomics.org 1347
Rapid Library Preparation Method Manual GS FLX+
Series – XL+ except that fragmentation was obtained
on Covaris® M220 focused-ultrasonocator
TMinstead
of on a Hydroshear device.
The shotgun and paired-end libraries obtained with
the GS-FLX Titanium technology were
clonally-amplified with 1 cpb in 4 SV-emPCR reactions, and
0.5 cpb in 2 SV-emPCR reactions with the GS
Titanium SV emPCR Kit (Lib-L) v2 (Roche). The
yields of the emPCR were 18.7% and 10.9%,
respectively, in the 5 to 20% range from the Roche
procedure. The shotgun library obtained with the
GS-FLX+ technology was clonally-amplified with 3
cpb in 2 SV-emPCR reactions. The yield of the
emPCR was 23.95%. Approximately 790,000 beads
for the shotgun application and for the 3kb paired
end were loaded on the GS Titanium PicoTiterPlate
PTP Kit 70x75 and sequenced with the GS FLX
Titanium Sequencing Kit XLR70 (Roche). The run
was performed overnight and then analyzed on the
cluster through the gsRunBrowser and Newbler
assembler (Roche). A total of 573,130 passed filter
wells were obtained and generated 249.97 Mb with
an average length of 424 bp. The passed filter
sequences were assembled using Newbler with 90%
identity and 40 bp as overlap. The final assembly
identified 25 scaffolds and 105 large contigs (>1,500
bp).
Genome annotation
Open Reading Frames (ORFs) were predicted using
Prodigal [24] with default parameters but the
predicted ORFs were excluded if they were spanning
a sequencing GAP region. The predicted bacterial
protein sequences were searched against the
GenBank database [25] and the Clusters of
Orthologous Groups (COG) databases [26] using
BLASTP. The tRNAscan-SE tool [27] was used to find
tRNA genes, whereas ribosomal RNAs were found by
using RNAmmer [28]. Transmembrane domains and
signal peptides were predicted using TMHMM [29]
and SignalP [30], respectively. ORFans were
identified if their BLASTp E-value was lower than 1 x
10
-3for alignment length greater than 80 amino
acids. If alignment lengths were smaller than 80
amino acids, we used an E-value of 1 x 10
-5. Such
parameter thresholds have been used in previous
works to define ORFans.
To estimate the mean level of nucleotide sequence
similarity at the genome level between
and
compared the only those ORFs only that could be
found on the RAST server [31] with a query
coverage of
≥
60% and a minimum nucleotide length
of 100 bp.
Genome properties
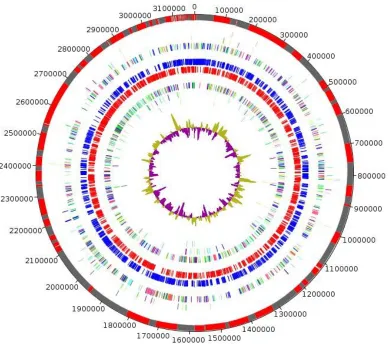
The genome is 3,169,464 bp long with a 40.50% GC
content (Table 3, Figure 5). Of the 2,802 predicted
genes, 2,746 were protein-coding genes, and 56
were RNAs. A total of 1,795 genes (65.37%) were
assigned a putative function. 198 genes were
identified as ORFans (7,21%). The remaining genes
were annotated as hypothetical proteins (673 genes
(24,51%)). The remaining genes were annotated as
either hypothetical proteins or proteins of unknown
function. The distribution of genes into COGs
functional categories is presented in Table 4. The
properties and the statistics of the genome are
summarized in Tables 3 and 4.
Table 3. Nucleotide content and gene count levels of the genome
Attribute Value % of totala
Genome size (bp) 3,169,464 100
DNA coding region (bp) 2,758,009 87.02
DNA G+C content (bp) 1,347,151 42.50
Total genes 2,802 100
RNA genes 56 2.00
Protein-coding genes 2,746 98.00
Genes with function prediction 1,795 65.37
Genes assigned to COGs 1,479 53.86
Genes with peptide signals 678 24.69
Figure 5. Graphical circular map of COG category of genes on the forward strand (three circles), genes on forward strand (blue circle), genes on the reverse strand (red circle), COG category on the reverse strand (three circles), GC content.
Comparison with other
To date 33 genomes from species belonging to the
genu
Whole genome sizes ranged between 2.42 Mb
G+C content of the genomes was was between
36.5% for
rRNA gene sequence comparison was performed to
obtain phylogenetic analysis of
cluster including
saccharivorax
group. the genomes of
note that these genomes showed the highest G+C
contents (47.6-55.9%) among the bacteria included
in the genus
allow us to determine if this group of bacteria
represent a particular evolutionary lineage.
The genome of another strain of the specie
genome of
related species to
encoding gene sequences were compared, has also
been sequenced.
T
shared a mean sequence similarity of 96.45%
(60.2-100%) with
84.02% (60-100%) with
Roux, et al.
http://standardsingenomics.org 1349
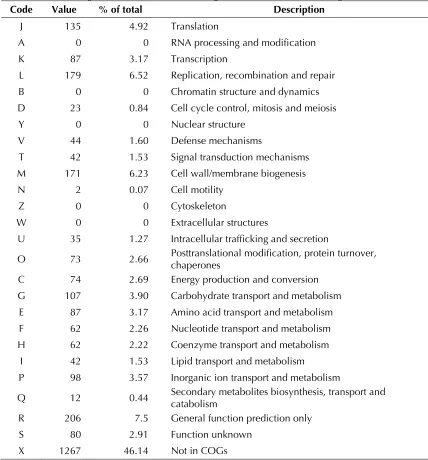
Table 4. Number of genes associated with the 25 general COG functional categories
Code Value % of total Description
J 135 4.92 Translation
A 0 0 RNA processing and modification
K 87 3.17 Transcription
L 179 6.52 Replication, recombination and repair B 0 0 Chromatin structure and dynamics D 23 0.84 Cell cycle control, mitosis and meiosis
Y 0 0 Nuclear structure
V 44 1.60 Defense mechanisms
T 42 1.53 Signal transduction mechanisms M 171 6.23 Cell wall/membrane biogenesis
N 2 0.07 Cell motility
Z 0 0 Cytoskeleton
W 0 0 Extracellular structures
U 35 1.27 Intracellular trafficking and secretion
O 73 2.66 Posttranslational modification, protein turnover, chaperones C 74 2.69 Energy production and conversion
G 107 3.90 Carbohydrate transport and metabolism E 87 3.17 Amino acid transport and metabolism F 62 2.26 Nucleotide transport and metabolism H 62 2.22 Coenzyme transport and metabolism
I 42 1.53 Lipid transport and metabolism
P 98 3.57 Inorganic ion transport and metabolism
Q 12 0.44 Secondary metabolites biosynthesis, transport and catabolism R 206 7.5 General function prediction only
S 80 2.91 Function unknown
X 1267 46.14 Not in COGs
The total is based on the total number of protein coding genes in the annotated genome.
Acknowledgements
The authors thank Mr. Julien Paganini at Xegen Company
for automating the genomic annotation process and Laetitia Pizzo, Audrey Borg and Audrey Averna for their technical assistance.
References
1. Glazunova OO, Launay T, Raoult D, Roux V.
human breast abscess. Int J Syst Evol Microbiol 2007; 57:883-886
2. Euzéby JP. List of Bacterial Names with Standing in
Nomenclature: a folder available on the Internet. Int J Syst Bacteriol 1997; 47:590-592
3. Downes J, Wade WG
4. Downes J, Tanner ACR, Floyd E, Dewhirst FE, Wade
WG
from the human oral cavity. Int J Syst Evol Microbiol 2010; 60:2458-2461
5. Sakamoto M, Natsuko Suzuki N, Okamoto M.
human oral cavity. Int J Syst Evol Microbiol 2010;
60:500-503
6. Downes J, Hooper SJ, Melanie J, Wilson MJ, Wade
WC
human oral cavity. Int J Syst Evol Microbiol 2008;
58:1788-1791
7. Downes J, Sutcliffe IC, Booth V, Wade WG.
human oral cavity. Int J Syst Evol Microbiol 2007;
57:2936-2939
8. Downes J, Liu M, Kononen E, Wade WG
cavity. Int J Syst Evol Microbiol 2009; 59:771-774 9. Hayashi H, Shibata K, Sakamoto M, Tomita S,
Benno Y
Int J Syst Evol Microbiol 2007; 57:941-946
10. Lawson PA, Moore E, Falsen E nov., isolated from human amniotic fluid. Int J Syst Evol Microbiol 2008; 58:89-92
11. Alauzet C, Mory F, Carlier JP, Marchandin H,
Jumas-Bilak E, Lozniewski A
nov., isolated from human clinical samples. Int J Syst Evol Microbiol 2007; 57:2216-2220
12. Sakamoto M, Ohkusu K, Masaki T, Kako H, Ezaki T,
Benno Y
from pleural fluid. Int J Syst Evol Microbiol 2007;
57:1725-1728
13. Tamura K, Peterson D, Peterson N, Stecher G, Nei M, Kumar S. MEGA5: Molecular Evolutionary Genetics Analysis using Maximum Likelihood, Evolutionary Distance, and Maximum Parsimony Methods. Mol Biol Evol 2011; 28:2731-2739 14. Woese CR, Kandler O, Wheelis ML. Towards a
natural system of organisms: proposal for the domains, and Eucarya.Proc Natl Acad Sci USA 1990; 87:4576-4579 15. Validation List No. 143. Int J Syst Evol Microbiol
2012; 62:1-4.
16. Krieg NR, Ludwig W, Euzéby J, Whitman WB.
Phylum XIV.
Staley JT, Brown DR, Hedlund BP, Paster BJ, Ward NL, Ludwig W, Whitman WB (eds), Bergey's Manual of Systematic Bacteriology, Second Edition, Volume 4, Springer, New York, 2011, p. 25.
17. Krieg NR. Class
NR, Staley JT, Brown DR, Hedlund BP, Paster BJ, Ward NL, Ludwig W, Whitman WB (eds), Bergey's Manual of Systematic Bacteriology, Second Edition, Volume 4, Springer, New York, 2011, p. 25.
18. Krieg NR. Order
NR, Staley JT, Brown DR, Hedlund BP, Paster BJ, Ward NL, Ludwig W, Whitman WB (eds), Bergey's Manual of Systematic Bacteriology, Second Edition, Volume 4, Springer, New York, 2011, p. 25.
19. Krieg NR. Family V
Krieg NR, Staley JT, Brown DR, Hedlund BP, Paster BJ, Ward NL, Ludwig W, Whitman WB (eds), Bergey's Manual of Systematic Bacteriology, Second Edition, Volume 4, Springer, New York, 2011, p. 85.
20. Shah HN, Collins DM
include
species formerly classified in the genus Int J Syst Bacteriol 1990; 40:205-208 21. Willems A, Collins MD. 16S rRNA gene similarities
indicate tha
anet al.) are genealogically highly related and are members of
the genus
genus
ofInt J Syst Bacteriol 1995; 45:832-836
22. Sakamoto M, Moriya Ohkuma M. Reclassification of
the genusInt J Syst Evol Microbiol 2012;
62:2637-2642
Roux, et al.
http://standardsingenomics.org 1351
Consortium. Nat Genet 2000; 25:25-29
24. Prodigal
http://prodigal.ornl.gov/
25. GenBank database.http://www.ncbi.nlm.nih.gov/genbank
26. Tatusov RL, Galperin MY, Natale DA, Koonin EV.The COG database: a tool for genome-scale analysis of protein functions and evolution. Nucleic Acids Res 2000; 28:33-36
27. Lowe TM, Eddy SR. tRNAscan-SE: a program for improved detection of transfer RNA genes in genomic sequence. Nucleic Acids Res 1997;
25:955-964
28. Lagesen K, Hallin P, Rodland EA, Staerfeldt HH, Rognes T, Ussery DW. RNAmmer: consistent and
rapid annotation of ribosomal RNA genes. Nucleic Acids Res 2007; 35:3100-3108
29. Krogh A, Larsson B, von Heijni G, Sonnhammer EL. Predicting transmembrane protein topology with a hidden Markov model: application to complete genomes. J Mol Biol 2001; 305:567-580 30. Bendtsen JD, Nielsen H, von Heijne G, Brunak S.
Improved prediction of signal peptides: SignalP 3.0. J Mol Biol 2004; 340:783-795
31. Aziz RK, Bartels D, Best AA, DeJongh M, Disz T,
Edwards RA, Formsma K, Gerdes S, Glass EM, Kubal M, et al. The RAST Server: Rapid Annotations using Subsystems Technology. BMC Genomics 2008;
9:75-89