Metric based Approach for Measuring Data
Quality
Shivani Gaba Deepika Gaba
Quality Assurance Analyst Student
Parametric Technology India Ltd University of Applied Sciences, Kiel, Germany
Atul Tomar Quality Assurance Analyst Parametric Technology India Ltd
Abstract
Due to the increase in the predicaments of data handling, the need for improving the quality of data arises to reduce its insidious effects over the performance. If the cause of the hindrance is analyzed, it is better to commence the data quality improvement plan by assessing all the scenarios affected previously. Values for measuring the quality of data should be constituted in this. The quality of data should be measured so as to evaluate the importance of the information and how can it be improved. Nevertheless, the primitive matter is to understand that what and how quality should be measured as it is said, "if you can’t measure it, you can’t manage it”. [Peter Drucker] The foremost step here is to focus on the elements of the data that are considered critical based on the needs of the user in the business. The quality of data can be measured and improved using the metrics methodology. This writing tries to represent how quality of can be quantified for selected dimension. At first, several requirements for defining a metric for measurement are stated. Furthermore, analysis of metrics is discussed with respect to the requirement of the company to improve data quality. After that, on the basis of available approaches, new metrics for the dimensions completeness and timeliness that meets the defined requirements are derived. Lastly, evaluation of the derived metric for timeliness is done in a case study.
Keywords: Data Quality, Metric, Measurement, Timeliness, Completeness
_______________________________________________________________________________________________________
I.
I
NTRODUCTIONIn order to support business and scientific conduct, the necessity for preserving the high quality of data has been highly recognized. To test the quality of data, metrics are used and it has become a regular practice that prevails in most of the academic and professional fields. Most importantly, it is used in the field of business, where developing the data metrics into analytical tools is known to be an integral part of case management applications. Many companies face glitches to ensure Data Quality (10) and according to a research by Redman (8) “the total cost of poor data quality” is between 8% and 12% of company’s revenues.
An example is taken as a series of assessment that are based on the ratings of RAE and academic selectivity in the United Kingdom. The academic excellence is calculated by incorporating such types of indexes as a degree granting, fund receiving and publishing of into several pre-designed formulas as performance metrics. The quantitative data assessment plays an important role in the process of decision-making about the quality of data and research. [6]
The data quality metric serves multi-faceted purposes. In simple words, it helps in (1) setting the objectives for the quality of information from the creators of data, and managers to achieve, (2) establishing standards for producing the data and (3) providing techniques to judge and measure the quality of data. Rules have been made for such metrics so as to define the thresholds in order to meet the expectations of the professionals and governing the aspects and levels of measuring the quality of data. An underlying structure has to be used in the way of organizing and configuring the rules. This helps to specify the process of transformation from data quality expectations of the group and works to prevent unprofessional conduct.
II.
D
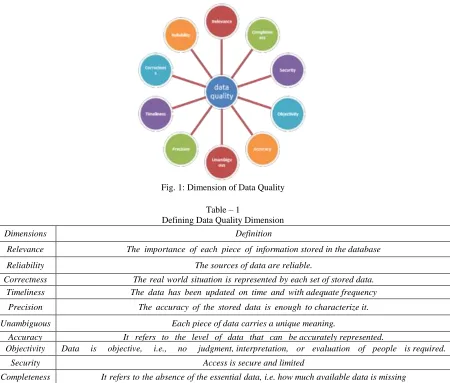
EFINING QUALITYFig. 1: Dimension of Data Quality
Table – 1
Defining Data Quality Dimension
Dimensions Definition
Relevance The importance of each piece of information stored in the database
Reliability The sources of data are reliable.
Correctness The real world situation is represented by each set of stored data.
Timeliness The data has been updated on time and with adequate frequency
Precision The accuracy of the stored data is enough to characterize it.
Unambiguous Each piece of data carries a unique meaning.
Accuracy It refers to the level of data that can be accurately represented.
Objectivity Data is objective, i.e., no judgment, interpretation, or evaluation of people is required.
Security Access is secure and limited
Completeness It refers to the absence of the essential data, i.e. how much available data is missing
It is to be noted that by getting a “high score” in any of the dimensions does not simply mean that a high quality of data has been achieved. For instance, the timelines may be important only in conjunction with correctness (Correct information about users is available, but if it is not updated, then it is of no use). In some or the other way, these attributes complement to each other.
III.
D
ATA QUALITY AND METRICSMeasuring and Defining the Quality of Data
Interesting and relevant dimensions should be chosen: all the dimensions are not relevant in all the situations. The metrics for the chosen dimension should be defined
The value or range that represents good and bad quality data should be defined for each metric.
It should be determined for each metric that whether the quality of data is acceptable or not, and appropriate corrective actions should be taken: If the scores for data quality that were obtained do not match with the expected ones, there are several possibilities. For example, if the value is “not so bad” there is no compulsion to take action to improve the data quality. However, if the values are bad but the costs to correct them seems higher than the expected benefits, and then also nothing has to be done. If the effects of the dimension are crucial, or decision is taken to correct the data anyway, appropriate decision to clean the data and the process of generating the data are used to improve the data quality.[7]
Fig. 2: Assessment of Data Quality
Defining Metrics
The following principles have to be considered while defining data quality metrics:
While operating in an economic oriented DQ management, various requirements on the DQ metrics can be stated so as to enable a practical application. [1,6]
1) Metric should be normalized as it is important to assure that the results are interpretable and comparable. In this context, DQ metrics values usually have value ranging between 0 (completely bad) and 1 (flawlessly good).[9]
2) Metrics should not subject to changes in the number of records in the warehouse.
3) Metrics should not be dependent on each other, such that the two metrics does not measure the same effect;
4) In order to quantify the DQ in a goal-oriented way, it is important for the metrics to be adapted in the context of a particular application.
5) Metric should accurately reflect the Degree to which the data meets the associated data quality.
6) In order to enable their application, determinable input parameters for the metrics should be used. In the way of defining metrics, it would be better to define the measurement methods and in few circumstances where it is not possible to exactly measure, the cost-intensive, other methods can be used.
7) The chosen metrics should be kept to a reasonable number, because using several metrics at a time may usually create confusion instead of clarification.
8) The measurement that is demanded should be “easy to interpret by the users of business concerns”. In such cases, the DQ metrics should be clear. E.g., when a metric for timeliness is estimated, there is a possibility that it could be interpretable as the probability of updating the attribute value within the database on time.
9) A flexible application shall be allowed by the metrics if the case is related to a relational data model. The metric should have aggregation so that it can be applied to correspondent objects (data model, database instance, documentation, etc.), whenever possible.
Choosing Dimensions of Data Quality
To measure the data Quality, metrics are required for quantifying Data Quality in order to provide solution questions like the following: Which measure progresses Data Quality the most and which one provides the best benefit/costs ratio?
Figure 3 shows a closed loop for management of Data Quality. This closed loop can be inclined via DQ measures. Taking appropriate measures will improve the current level of Data Quality which is quantified by using metrics. This will lead to corresponding benefit. Also, on the basis of Data Quality level and considering thresholds, an organisation can decide whether to take any further action or not. From an economic perspective, the measures which are efficient with respect to costs and benefits [11,12] should be considered. If we are given two measures, we should choose the one which will cost less.
Fig. 3: Data quality loop
In this research work, the primary focus is on the dimensions: Completeness and timeliness which are necessarily required by an organization to maintain high data quality.
Certain types of attributes should be assigned values in the set of data in an expectation of indication of completeness. Completeness can be of two types:
Attributes that are mandatory and require a value
The attributes that are optional and may have a value that is based on some set of conditions. Completeness can be seen as encompassing the usability and appropriateness of the values of data.
The data model should be defined in such away that it will represent the real world completely. There can be two sources of deficiencies: however, certain attributes of data are not included in the model or an incorrect representation of certain attributes is included in the model. In both the cases, these problems can only be pointed out by the user of the information.
stotal be number of times data could not be stored in the database (does not fit in the model). mtotal be number of times a value for an attribute could not be stored in the correspondent field Total number of times a field could not be stored, n =stotal*mtotal
QCompleteness=
Where QCompleteness is a metric defined for measuring data correctness, n is number of times data could not be stored in the database, m is the number of time data could not be saved due to incompatible data type of the field.
Table – 2
Improvement in QCompleteness
Along with completeness, timeliness is also being considered. Following queries can be catered by the timeliness:
What percentage of data is updated? Frequency of updating the data?
The main concern is to check that how accurate is the data with respect to time (deadlines). [4]. If attributes that are dependent on time are known and whether the specific values are outdated is also known, then a test over the data can be used so as to estimate whether the number of records is outdated or not. This technique is known as a Temporal Test. In order to categorize the data as useful, metrics such as the frequency to accesses the query the data is added to the metrics which is given by:
Qtime (w,A):=exp(-decline(A) age(w,A))
This is a metric provided by Heinrich. [5]. Where Qtime (w, A) depicts the probability that the attribute value is still valid. age(w, A) denotes the age of the attribute value w, which can be computed by means of two factors: the instant when DQ is quantified and the instant of data acquisition.
decline(A) is the decline rate indicating how many values of the attribute considered become out of date on average within one span of time.
A new dimension of the number of accesses to query the data is added to the metric defined above to cater the importance of data retrieval in Qtime.
As number of accesses is directly proportional to the quality of data in terms of timeliness, modify equation 1, derivation would be:
For attributes that has accessed many a times, N is chosen to be very large, and age(w,A)->0, i.e age is limiting to zero, the metric would result to 1:
Also, metric value can be 1 when attribute has less declination i.e. decline (A)->0 and that attribute has be accessed many times i.e. N->∞
IV.
A
PPLICATION OF METRICSThe evaluation of the developed metric for timeliness is illustrated in this section by using a case study. Here, two attributes will be taken and the metric to measure the quality will be defined. Taking case study by Heinrich as basis, the metric defined is extended as following: [5]
Let A1 be Name, and A2 be address of a customer for the company.
We know that the name of customer is rarely modified whereas modification of address is more, so we decide the values; For A1, decline as 0.02 Weight=0.99
N as 2, considering that with every access of database, name is accessed almost every time. Whereas for A2, decline as 0.10
Weight=0.90
N as 0.5 assuming no of times addressed is retrieved from the database is half of the average retrieval of attributes. Table – 3
Quantifying Qtime using metrics
The value of the metric on the level of tuples is computed via aggregation of the results on the level of attribute values:
Hence, the resulting value of the metric for timeliness of the exemplary tuple is 83.5%. It means that the value of the tuple provided for a given application is updated on time at a level of
83.5%.
Compared to Heinrich metric, where resultant Qtime was calculated as 88.2%, new result of 83.5% is found which is calculated by using new metric. This metric provides detailed perspective of Qtime.
After measurement, of the quality of data, the decision will be taken that whether the database is to be purchased and updated to improve the quality of data, or the work should be done with the incorrect one.
V.
S
UMMARYIn this paper, how DQ dimensions can be quantified has been analyzed. The aim of this paper was to design some innovative metrics for the Completeness and timeliness of DQ dimensions. However, the metrics can be applied in other domains too, in which data values become outdated after a period. One can also use them in the cases where the data values become incomplete during the attaining or changing. It is considered reasonable to apply the metrics if a dataset is taken as a base for making decisions or is processed, provided that the above assumptions are taken into consideration. This point of view can also be used in the management, production or logistic functions. In contrast to the current approaches, the design of the metrics was made keeping in mind the important requirements like interpretability and feasibility. Quantifying DQ is allowed by them, and it thereby acts as a foundation for economic analysis. Moreover, the metric that is proposed for timeliness helps to enable an objective and automated measurement while serving the steps of the quantifying process.
R
EFERENCES[1] Even, A., and Shankaranarayanan 2007. “Utility-Driven Assessment of Data Quality,” The DATA BASE for Advances. 75-93.
[2] Leo L. Pipino, Yang W. Lee, and Richard Y. Wang, April 2002. Data Quality Assessment.. Communications Of The Acm. 215-217. http://web.mit.edu/tdqm/www/tdqmpub/PipinoLeeWangCA CMApr02.pdf
[3] David, Nov 2006. Monitoring Data Quality Performance Using Data Quality Metrics. White Paper. 8-14. http://it.ojp.gov/documents/informatica_whitepaper_moni toring_dq_using_metrics.pdf
[7] Phil Nousak, Rob Phelps, PWC Consulting, Chapel Hill, NC, N.D. . A Scorecard approach to improving Data Quality. Data Warehousing and Enterprise Solutions. http://www2.sas.com/proceedings/sugi27/p158-27.pdf
[8] Redman., 1998. The Impact of Poor Data Quality on the Typical Enterprise. Communications of the ACM, 41 (2), 79-82. [9] Strong, D. M.Lee, Y. W., Wang R. Y., 1997. Data quality in context. Communications of the ACM, 40 (5), 103-110.
[10] Hinrichs, H., 2002. Datenqualitätsmanagement in Data Warehouse-Systemen, Dissertation der Universität Oldenburg. Oldenburg 1st edition.Campanella, J., 1999.