DOI:10.5590/JSBHS.2018.12.1.03
This research was supported by a Faculty Research Initiative Grant from Walden University, Minneapolis, Minnesota. The authors declare no conflict of interest.
Please address queries to: David A. Hernandez, 1826½ West Balboa Boulevard, Newport Beach, CA 92663. Email: [email protected]
Development and Validation of the Body Knowledge
Questionnaire (Phase 2)
David A. Hernandez
Newport Beach, California
Cheri Ann Hernandez
University of Windsor
This study evaluated the psychometric properties of the Body Knowledge Questionnaire (BKQ), an instrument that measures weight management integration: an individual’s
attitudes, preferences, and behaviors associated with weight self-management. The BKQ was revised following a pilot study demonstrating its validity and reliability, and new items were added based on data gathered through four focus groups of obese and normal-weight survey completers. Additional items were derived from the extant literature on weight management and integration. A panel of 30 health professionals who work in the area of weight
management, bariatrics, and nutrition science reviewed the revised BKQ for content validity. Two hundred sixty-seven participants, recruited through Walden University’s online
participant pool, completed the revised 66-item BKQ through SurveyMonkey. Exploratory factor analysis yielded a five-factor solution (Emotional Eating, Health-Conscious Lifestyle, Conscientious Eating Habits, Food Centricity, and Psychosomatic Awareness), with factor loadings >.40. Discriminant function analysis determined that the BKQ full scale and
subscales could predict the classification of participants into normal-weight and obese groups for the total sample with 71% and 79% accuracy, respectively. Test–retest reliability was .86, and internal consistency of the overall BKQ was .92. The BKQ instrument has potential for use in individual or group weight management programs and program evaluation; for use in weight management practice areas such as dietetics, diabetes education, nursing, and psychology; or in the development of new weight management interventions.
Keywords: obesity, weight management integration, instrument development, Body Knowledge Questionnaire
Introduction
Journal of Social, Behavioral, and Health Sciences 41 self-esteem (Sutton & Raines, 2010) that lead to life-threatening or chronic conditions (Egger & Dixon, 2014). However, weight loss programs that seek to restrict calorie intake and increase energy expenditure have yielded poor results, with only short-term success; that is, within 6 years,
individuals return to or exceed their preweight-loss-program BMI (Kraschnewski et al., 2010; Mekary, Feskanich, Hu, Willett, & Field, 2010). Recent literature has reported much poorer
outcomes in terms of long-term post-intervention weight loss maintenance (i.e., 2 years; Gilmartin & Murphy, 2015).
Some researchers have identified the process of integration of self and one’s weight as an important aspect in weight management (Johnson, 1990; White, 1984). During the process of integration, obese individuals struggle to reconcile two selves, their actual, obese-weight self with a desired, normal-weight self. Once integration has occurred, individuals think and act differently, adopting a “new [healthier] way of eating and living” (Johnson, 1990, p. 1294). Currently, there is a paucity of research that has studied the experiential aspects (i.e., psychological, behavioral, and social experiences) of an individual’s weight self-management (e.g., finding comfort in food, eating everything on one's plate, reaction of others to self; D. A. Hernandez & Hernandez, 2015), which could be used to more fully understand the integration process.
In 2009, a pilot study was conducted to investigate whether the theory of integration (explained here under Theoretical Framework) could be applied in the domain of weight self-management (D. A. Hernandez & Hernandez, 2015). In this pilot study, the psychometric properties of a new
instrument, the Body Knowledge Questionnaire (BKQ), designed to measure integration (i.e., an individual’s attitudes, preferences, and behaviors) related to weight self-management, were evaluated. Items on the BKQ were derived from two sources—a preliminary review of the obesity/weight management literature and The Diabetes Questionnaire (C. A. Hernandez, 1997). Once the validity and reliability of the initial BKQ were established, the researchers undertook a second phase of the research to ensure that the BKQ contained items from the total domain of weight management integration, which resulted in new items being added to the questionnaire.
The BKQ gathers data about an individual’s attitudes (thoughts and feelings), preferences (choices), and behaviors (actions) related to weight self-management. Information about the attitudes,
preferences, and behaviors characteristic of individuals’ weight management efforts is important because that knowledge can be used to create innovative weight management intervention programs and strategies based on the attitudes, preferences, and behaviors more characteristic of healthier, normal-weight individuals. Consequently, the purpose of this research was to refine and validate the BKQ, an instrument which measures the ways (attitudes, preferences, and behaviors) in which individuals internalize and manage their weight.
Theoretical Framework
The theory used to frame this study was C. A. Hernandez’s (1991) theory of integration. This theory explains the process of integration that occurs in individuals with diabetes. Individuals endeavor to assimilate the existence of two selves: a personal self, which has always existed, and a diabetic self, which emerged when diagnosed with diabetes. Besides explaining the experiences of individuals with Type 1 (C. A. Hernandez, 1991) and Type 2 diabetes (C. A. Hernandez, 1997), the theory of
Journal of Social, Behavioral, and Health Sciences 42 because previous qualitative studies have indicated that integration is an important part of the experience of those who are seeking to lose weight (Johnson, 1990; White, 1984).
Method
The BKQ is a self-report instrument for collecting data on an individual’s attitudes (thoughts and feelings), preferences (choices), and behaviors (actions) as they relate to managing one’s weight. The process used to develop and validate the BKQ is displayed in Figure 1. There were two phases to this research project.
Instrument Development
(
Phase 1)
In Phase 1, the conceptual model was defined. The initial version of the BKQ was created by using items focused on the concept of integration from the The Diabetes Questionnaire (C. A. Hernandez, 1997) and then revising the wording to align with the weight management paradigm.
Additional items were created from the findings of the extant research literature on weight
management. For example, the results of one study revealed that individuals were more successful at weight maintenance when they weighed themselves once a day or more (Butryn, Phelan, Hill, & Wing, 2007). This finding was converted into Item 26 on the initial BQK: “I weigh myself daily to monitor my weight.” Forty participants completed the initial BKQ instrument in a pilot study. With analysis of the data from the pilot study, the authors showed the scale and subscales of the BKQ were both reliable and valid (D. A. Hernandez & Hernandez, 2015). With solid initial indicators of the capacity of the BKQ in identifying the attitudes, behaviors, and preferences of those successful (and unsuccessful) in maintaining normal body weight, the authors continued with Phase 2 of the research, which was the refinement of the BKQ instrument and evaluation of the psychometric properties of the revised instrument.
Continued Instrument Development (Phase 2)
Besides completing the initial draft of the BKQ, during Phase 1, the respondents participated in one of four focus group interviews. The focus group sessions were audiotaped and transcribed verbatim, and in Phase 2 of this research, the transcripts were analyzed for new attitudes, preferences, and behaviors related to weight management that had not already been included in the first version of the 27-item BKQ. An additional 22 new items were added to the BKQ based on the content in the focus group transcripts.
The subsequent step was to conduct a comprehensive search of the literature to identify any
Journal of Social, Behavioral, and Health Sciences 43
Figure 1.
Process of development of the Body Knowledge Questionnaire.
These initial
steps completed
under Phase 1
of the full study
(see D. A.
Hernandez &
Hernandez,
2015)
Theoretical foundation:
Develop conceptual model and
definition
Identify/create pool of items:
Initial review of research
literature
and The Diabetes
Develop survey instrument
Collect data: Pilot study
Initial scale construction
Assess scale reliability and validity
Refine survey
Collect data
Evaluate scale reliability and
validity
Since new concept being studied:
Focus groups convened to explore
concept domain
Identify/add to pool of items:
Analyze focus group transcripts
Revise survey
Identify/add to pool of items:
Thorough search of literature
Final survey/scales
Content validity exercise
Journal of Social, Behavioral, and Health Sciences 44 The content of the revised 59-item BKQ was reviewed by a panel of 30 health professionals (14 dietitians, eight nurse/nurse practitioners, two psychologists/psychotherapists, two social workers, one physiotherapist, one respiratory therapist, one human kinetics professional, and one health promoter) who work in the area of weight management, bariatrics, and nutrition science. Each participant completed a five-item Content Validity Questionnaire (see Appendix). Subsequently, a subgroup of six of the 30 health professionals who completed the Content Validity Questionnaire participated in a focus group exercise to review the results of the Content Validity Questionnaire and provide feedback. An additional seven new items were added, and the wording of existing items were revised. The final BKQ consisted of 66 items.
Sample
Participants were recruited through Walden University’s Research Participant Pool. Once the current study was approved by Walden University’s Institutional Review Board (Approval Number 03-03-14-0437626), access was granted to its Research Participant Pool. An e-mail was generated by the Research Participant Pool administrator and sent to Walden’s currently enrolled students informing them of the study and inviting them to participate in the research by completing the online questionnaire. Because the Research Participant Pool administrator does not track the number of enrolled students who received the e-mail inviting them to participate in this study, a response rate for the BKQ could not be calculated.
The first webpage of the questionnaire provided participants with information about the background, purpose, risks and benefits, and voluntary nature of their participation. No compensation was given to participants for completing the BKQ. Individuals were excluded from the study if, on average, they drank more than one alcoholic beverage/day for women or more than two alcoholic
beverages/day for men; smoked tobacco; were a substance abuser; were pregnant; had an eating disorder, diabetes, chronic obstructive pulmonary disease, gastrointestinal problems, or serious psychiatric illness; took psychiatric medication or medication for a thyroid condition; or were being treated for kidney disease. These exclusionary criteria are factors known to impact weight
management.
To identify differences in the attitudes, preferences, and behaviors between normal-weight and obese individuals, both normal-weight and obese participants were included in the sample. Individuals who were categorized as simply overweight (i.e., BMI > 24.9 and < 30.0) were excluded from the study. The first webpage of the online version of the BKQ included two tables, one using U.S. standard units and one using metric units, which identified for potential participants whether they were eligible to complete the survey. The tables, sorted by increasing height, included the acceptable weight ranges for participants at each height. To ensure that only normal-weight and obese
individuals were included in the final analysis, respondents self-reported their weight and height as part of the data collection, and those values were used to calculate an exact BMI.
Journal of Social, Behavioral, and Health Sciences 45
Overview of psychometric evaluation
There are two important psychometric properties of an instrument: validity and reliability. Validity is a measure of the degree to which an instrument measures accurately the underlying construct it is purported to measure, and reliability measures if the instrument does so consistently (LoBiondo-Wood & Haber, 2014).
Table 1.
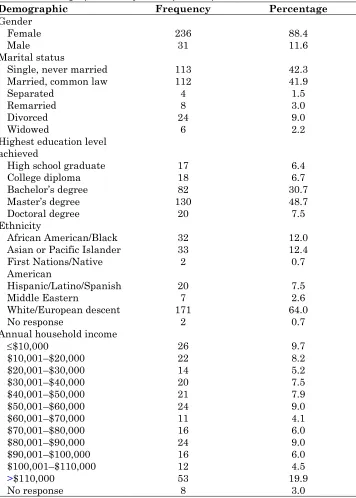
Demographic Data for Study Participants
Demographic Frequency Percentage
Gender
Female 236 88.4
Male 31 11.6
Marital status
Single, never married 113 42.3
Married, common law 112 41.9
Separated 4 1.5
Remarried 8 3.0
Divorced 24 9.0
Widowed 6 2.2
Highest education level achieved
High school graduate 17 6.4
College diploma 18 6.7
Bachelor’s degree 82 30.7
Master’s degree 130 48.7
Doctoral degree 20 7.5
Ethnicity
African American/Black 32 12.0
Asian or Pacific Islander 33 12.4
First Nations/Native
American 2 0.7
Hispanic/Latino/Spanish 20 7.5
Middle Eastern 7 2.6
White/European descent 171 64.0
No response 2 0.7
Annual household income
$10,000 26 9.7
$10,001–$20,000 22 8.2
$20,001–$30,000 14 5.2
$30,001–$40,000 20 7.5
$40,001–$50,000 21 7.9
$50,001–$60,000 24 9.0
$60,001–$70,000 11 4.1
$70,001–$80,000 16 6.0
$80,001–$90,000 24 9.0
$90,001–$100,000 16 6.0
$100,001–$110,000 12 4.5
>$110,000 53 19.9
Journal of Social, Behavioral, and Health Sciences 46 Using psychometrically sound instruments (i.e., instruments with adequate validity and reliability) ensures the integrity and trustworthiness of the research (LoBiondo-Wood & Haber, 2014), and without them, interpretations of the research can be neither justifiable nor meaningful (DeVellis, 2017). Traditionally, an instrument’s validity is measured by three types: (a) content validity, (b) construct validity, and (c) criterion-related validity (LoBiondo-Wood & Haber, 2014), and these were established for the BKQ in this research. The BKQ’s reliability was established using test–retest reliability to assess its temporal stability, and through scale reliability analysis to establish the internal consistency on the items of the constructs measured.
Instrument Validity
To determine the validity of an instrument, LoBiondo-Wood and Haber (2014) advocated establishing various types of validity. For the BKQ, content, construct (including convergent validity), and criterion-related validity were confirmed in this research.
Content validity
The content of the BKQ was derived from four sources: (a) The Diabetes Questionnaire, (b) the research literature on weight management, (c) transcripts of focus group interviews of obese and normal-weight individuals, and (d) a panel of experts, who work in weight management, bariatrics, and nutrition science. Establishing the content validity of an instrument is an essential prerequisite prior to using it for research or assessment because it impacts the inferences one can make about the data collected (Peirce, Brown, Corkish, Lane, & Wilson, 2016). Content validity refers to the degree of relevance and representatives of an instrument to the targeted construct (DeVellis, 2017). This means that each item of the BKQ should measure aspects of weight management integration. When studying new constructs, Patrick et al. (2011) recommended interviewing a sample of individuals from the target population to identify the relevant facets of the construct from which questionnaire items can be formulated. Four focus group interviews were conducted with 40 participants (both normal-weight and obese individuals), and from the focus group transcripts, 22 new items were derived.
Prior to conducting other types of validation of the BKQ, 30 health professionals reviewed the BKQ and completed the Content Validity Questionnaire. A subgroup of six of the 30 health professionals participated in a focus group for the final content validity exercise. This “panel of experts” was used to establish the content validity of the final version of the BKQ, which became a 66-item instrument.
Construct and convergent validity
To determine an instrument’s construct validity, LoBiondo-Wood and Haber (2014) recommended using multiple methods, which reduces the impact of measurement (systematic) error—a potential threat to research findings. One statistical method for assessing construct validity is exploratory factor analysis (EFA), which identifies latent constructs (or factors) that explain the covariance among the survey items or individual variables in a data set (Tabachnick & Fidell, 2012).
Journal of Social, Behavioral, and Health Sciences 47 correlated to a higher score on the IWQOL-Lite (indicating poorer quality of life due to obesity). An |r| value of .21 to .40 suggests a moderate/acceptable degree of correlation, an |r| value of .40 to .50 suggests a high correlation, and an |r| >.50 suggests a very high correlation, and the threshold to establish convergent validity is a moderate degree of correlation between two measures (Drummond, Sheperis, & Jones, 2016). In the current research, the BKQ’s construct validity was established using EFA and its convergent validity was established using correlation analysis.
However, prior to any statistical analysis, 35 questions had to be reverse coded so all items with higher agreement scores would indicate better weight management integration (e.g., Items 2, 4, 5, 8, 9, 12, 14, 17, 18, 20, 25, 26, 29, 32, 33, 34, 36, 37, 38, 39, 40, 42, 44, 46, 47, 48, 50, 51, 55, 57, 60, 61, 62, 65, and 66 were reverse coded). After EFA, items with factor loadings <.40, the factor loading cut score recommended by Stevens (2009) were excluded from further analysis. Additionally, the BKQ scale and subscale values were calculated using the averaging method. In the averaging method, the factor score is calculated as the mean of the items comprising the factor. This method facilitates “comparisons across factors when there are differing numbers of items per factor” (DiStefano, Zhu, & Mîndrilă, 2009, p. 2).
Criterion-related validity
One type of criterion-related validity is predictive validity (DeVellis, 2017); in other words, how well does the BKQ predict the construct it purports to measure. Discriminant function analysis (DFA) is used for prediction (i.e., predictive discriminant analysis) and can be used to determine the
components on which groups differ (e.g., weight categories; Mertler & Vannatta, 2017). DFA was used to test whether the BKQ scale and its subscales could accurately classify participants into normal-weight and obese groups.
When assessing criterion-related validity, DeVellis (2017) recommended calculating the percentage of correctly categorized participants referred to as the “hit rate.” There is no acceptable rule-of-thumb hit rate. A high hit rate, however, is desirable and indicative of criterion-related validity (Mertler & Vannatta, 2017).
Instrument Reliability
Two measures of reliability were calculated. Correlation analysis was used to establish test–retest reliability, which provides an indicator of the stability of the instrument. For adequate temporal stability of an instrument, Drummond et al. (2016) suggested a minimum correlation of .70 or better. Cronbach’s alpha scores were calculated to determine the internal consistency of the BKQ’s scale and subscales. Cronbach’s alpha scores between .70 and .79 are considered adequate, .80 and .89 are considered good, and .90 and above are considered excellent (George & Mallery, 2016).
Summary of Statistical Analyses
Journal of Social, Behavioral, and Health Sciences 48
Results
Prior to conducting EFA, a bivariate correlation matrix was generated to test the correlation among the 66 individual BKQ items. A visual inspection of the correlation matrix revealed that 20 items (Items 1, 6, 12, 13, 19, 21, 23, 35, 41, 43, 45, 46, 51, 52, 53, 54, 58, 59, 63, and 64) lacked a patterned relationship with the other questionnaire items (i.e., a large number [e.g., >90%] of |r| values < .30; Field, 2013; Yong & Pearce, 2013). Those 20 items were removed, therefore, prior to further analysis.
Exploratory Factor Analysis
An initial EFA was run to produce a scree plot. Cattell (1966) argued that the number of factors to extract should be at the point of inflexion of the scree plot curve. With the current dataset, the curve descends sharply and then trails off at Component 5. Therefore, a five-factor solution is indicated.
Five-factor solution
A second EFA was conducted using a five-factor solution and varimax rotation with Kaiser normalization. A factor loading of .40 was used as the factor loading cut score. Of the 46
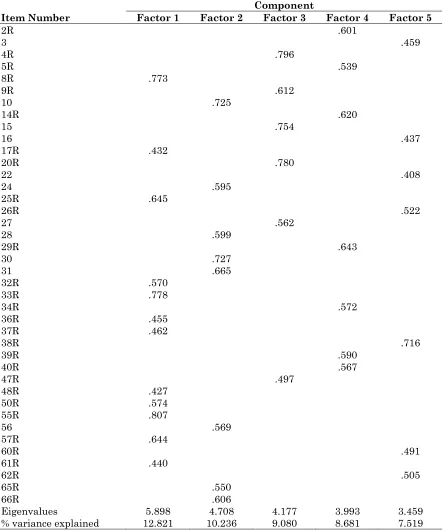
questionnaire items, 40 items loaded onto five factors with a factor loading greater than or equal to .40. Twelve items loaded onto Factor 1, eight items onto Factor 2, six items onto Factor 3, seven items onto Factor 4, and seven items onto Factor 5. Items with a factor loading below the cut score were discarded. In the final scale and subscales, BKQ Items 2, 3, 4, 5, 8, 9, 10, 14, 15, 16, 17, 20, 22, 24, 25, 26, 27, 28, 29, 30, 31, 32, 33, 34, 36, 37, 38, 39, 40, 47, 48, 50, 55, 56, 57, 60, 61, 62, 65, and 66 were retained. This five-factor solution model explained 48.3% of the total variance in the data. The rotated component matrix is displayed in Table 2, and the factors, items, and component loadings are displayed in Table 3.
The first factor, composed of 12 items, was named Emotional Eating. Items for this factor indicate that the individual eats when feeling stressed or nervous (Item 8), bored or lonely (Item 25), tired (Item 32), angry or upset (Item 33), or sad or depressed (Item 55). Food is used as a reward (Item 50) or to comfort the individual (Item 57). The individual’s eating patterns are affected by emotions. This factor explained the largest single portion (12.8%) of the variance in the data.
Journal of Social, Behavioral, and Health Sciences 49
Table 2.
Rotated Component Matrix
Item Number
Component
Factor 1 Factor 2 Factor 3 Factor 4 Factor 5
2R .601
3 .459
4R .796
5R .539
8R .773
9R .612
10 .725
14R .620
15 .754
16 .437
17R .432
20R .780
22 .408
24 .595
25R .645
26R .522
27 .562
28 .599
29R .643
30 .727
31 .665
32R .570
33R .778
34R .572
36R .455
37R .462
38R .716
39R .590
40R .567
47R .497
48R .427
50R .574
55R .807
56 .569
57R .644
60R .491
61R .440
62R .505
65R .550
66R .606
Eigenvalues 5.898 4.708 4.177 3.993 3.459
% variance explained 12.821 10.236 9.080 8.681 7.519
Journal of Social, Behavioral, and Health Sciences 50
Table 3.
Factors, Survey Items of the Body Knowledge Questionnaire,
aand Component Loadings
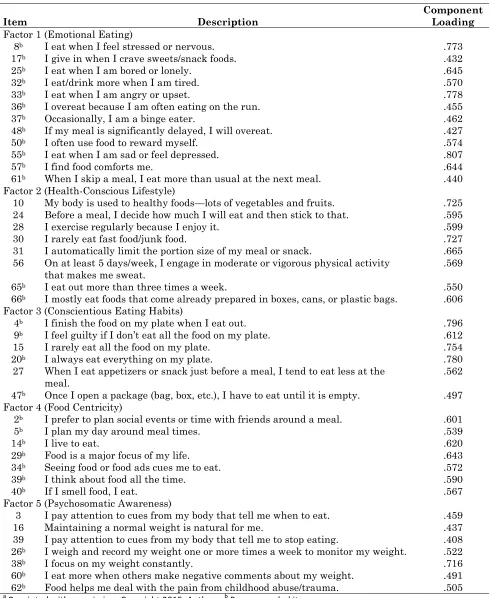
Item Description Component Loading
Factor 1 (Emotional Eating)
8b I eat when I feel stressed or nervous. .773
17b I give in when I crave sweets/snack foods. .432
25b I eat when I am bored or lonely. .645
32b I eat/drink more when I am tired. .570
33b I eat when I am angry or upset. .778
36b I overeat because I am often eating on the run. .455
37b Occasionally, I am a binge eater. .462
48b If my meal is significantly delayed, I will overeat. .427
50b I often use food to reward myself. .574
55b I eat when I am sad or feel depressed. .807
57b I find food comforts me. .644
61b When I skip a meal, I eat more than usual at the next meal. .440 Factor 2 (Health-Conscious Lifestyle)
10 My body is used to healthy foods—lots of vegetables and fruits. .725 24 Before a meal, I decide how much I will eat and then stick to that. .595
28 I exercise regularly because I enjoy it. .599
30 I rarely eat fast food/junk food. .727
31 I automatically limit the portion size of my meal or snack. .665 56 On at least 5 days/week, I engage in moderate or vigorous physical activity
that makes me sweat. .569
65b I eat out more than three times a week. .550
66b I mostly eat foods that come already prepared in boxes, cans, or plastic bags. .606 Factor 3 (Conscientious Eating Habits)
4b I finish the food on my plate when I eat out. .796
9b I feel guilty if I don’t eat all the food on my plate. .612
15 I rarely eat all the food on my plate. .754
20b I always eat everything on my plate. .780
27 When I eat appetizers or snack just before a meal, I tend to eat less at the
meal. .562
47b Once I open a package (bag, box, etc.), I have to eat until it is empty. .497 Factor 4 (Food Centricity)
2b I prefer to plan social events or time with friends around a meal. .601
5b I plan my day around meal times. .539
14b I live to eat. .620
29b Food is a major focus of my life. .643
34b Seeing food or food ads cues me to eat. .572
39b I think about food all the time. .590
40b If I smell food, I eat. .567
Factor 5 (Psychosomatic Awareness)
3 I pay attention to cues from my body that tell me when to eat. .459
16 Maintaining a normal weight is natural for me. .437
39 I pay attention to cues from my body that tell me to stop eating. .408 26b I weigh and record my weight one or more times a week to monitor my weight. .522
38b I focus on my weight constantly. .716
60b I eat more when others make negative comments about my weight. .491 62b Food helps me deal with the pain from childhood abuse/trauma. .505 a
Journal of Social, Behavioral, and Health Sciences 51 The third factor, composed of six items, was named Conscientious Eating Habits because items in the third factor relate to the individual’s making good choices about food consumption. Items that were reverse coded indicate an individual disagrees that he or she always eats everything on his or her plate (Item 20) or feels guilty if not all the food on one’s plate is eaten (Item 9), and once a food package is opened, he or she does not eat until the package is empty (Item 47). Furthermore, an individual who scores high on this factor rarely eats all the food on his or her plate (Item 15) and eats less at a meal if appetizers or snacks are consumed before the meal (Item 27). An individual scoring high on this factor makes a conscious choice of how much he or she should and will eat.
The fourth factor, composed of seven items, was named Food Centricity because the items in this factor indicate that food is central to the individual’s thinking. For example, this factor includes items like “I live to eat” (Item 14), “food is a major focus of my life” (Item 29), and “I think about food all the time” (Item 39). Because the individual plans the day around meal times (Item 5) and prefers to plan social events or time with friends around a meal (Item 2), this suggests the great importance food plays in the individual’s life.
The fifth factor, composed of seven items, was named Psychosomatic Awareness because items in this last factor relate to the individual’s tuning in to his or her body’s need for food. For example, the individual pays attention to cues from the body to signal when to eat (Item 3) and when to stop eating (Item 22), and maintaining a normal weight is natural (Item 16). Reverse-coded items indicate the individual does not need to focus constantly on one’s weight (Item 38) or weigh oneself weekly to maintain a constant weight (Item 26), presumably because the individual is in tune with his or her body. In other words, the individual has a natural sense of whether his or her weight is within the normal range without having to weigh oneself or focusing on one’s weight.
Sampling adequacy and adequacy of correlation matrix
The Kaiser–Meyer–Olkin measure of sampling adequacy was .90, indicating that the sample size of this research was “marvelous” (Kaiser, 1974, p. 36) or has excellent acceptability for the factor analysis. Bartlett’s test of sphericity was significant, 2(1,035) = 5,626.74, p < .001. A significant Bartlett’s test indicates that there are relationships among the variables. Therefore, interpretation of a factor analysis is appropriate.
Correlation Analysis
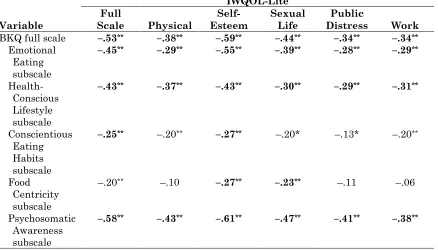
The results of bivariate correlation analysis measuring the association between the BKQ and IWQOL-Lite scale and subscales are displayed in Table 4. All correlations between the two
Journal of Social, Behavioral, and Health Sciences 52
Table 4.
Pearson Correlation Coefficients Between the Body Knowledge Questionnaire (BKQ)
and Impact of Weight on Quality of Life (IWQOL)-Lite Scale and Subscales
Variable
IWQOL-Lite Full
Scale Physical Esteem Self- Sexual Life Distress Public Work
BKQ full scale –.53** –.38** –.59** –.44** –.34** –.34**
Emotional Eating subscale
–.45** –.29** –.55** –.39** –.28** –.29**
Health-Conscious Lifestyle subscale
–.43** –.37** –.43** –.30** –.29** –.31**
Conscientious Eating Habits subscale
–.25** –.20** –.27** –.20* –.13* –.20**
Food Centricity subscale
–.20** –.10 –.27** –.23** –.11 –.06
Psychosomatic Awareness subscale
–.58** –.43** –.61** –.47** –.41** –.38**
Note. Boldface indicates support for convergent validity. * p < .01. ** p < .001.
Correlational analysis was also used to establish test–retest reliability. Twenty-four participants completed the BQK twice, with a median and modal value of 8 days between the first and second completion dates. The response values of 40 items comprising the full BKQ scale were summed, and the bivariate correlation of the total item scores between initial and second completion of the BKQ yielded a Pearson r of .86, p < .001. The BKQ demonstrates adequate test–retest reliability.
Cronbach’s Alpha
Results of the reliability analysis for each of the five factors were as follows: Factor 1 with 12 items (questionnaire Items 8, 17, 25, 32, 33, 36, 37, 48, 50, 55, 57, and 61) yielded a Cronbach’s alpha value of .89, Factor 2 with eight items (questionnaire Items 10, 24, 28, 30, 31, 56, 65, and 66) yielded a Cronbach’s alpha of .82, Factor 3 with six items (questionnaire Items 4, 9, 15, 20, 27, and 47) yielded a Cronbach’s alpha of .83, Factor 4 with seven items (questionnaire Items 2, 5, 14, 29, 34, 39, and 40) yielded a Cronbach’s alpha of .85, and finally, Factor 5 with seven items (questionnaire Items 3, 16, 22, 26, 38, 60, and 62) yielded a Cronbach’s alpha of .71. For the overall BKQ scale, which included all questionnaire items from Factors 1, 2, 3, 4, and 5 (a total of 40 items), the alpha value was .92 Therefore, the BKQ full scale and five subscales are considered reliable.
Discriminant Function Analysis
According to the results of the DFA, only one significant function was generated for the full scale,
Λ = .899, 2(1) = 28.08, p < .001, indicating that the one-predictor function was able to differentiate
Journal of Social, Behavioral, and Health Sciences 53 indicating that the function containing the five predictors significantly differentiated between normal-weight and obese participants, accounting for 32% of the function variance for the five-predictor model.
For the full BKQ scale, the classification results revealed that 92% of the normal-weight participants and 32% of the obese participants were classified correctly. Cross-validation derived 71% accuracy for the total sample. The means of the discriminant functions at the group centroids, 0.24 for normal weight and -0.46 for obese, suggest that individuals who score high on the full scale are likely to be classified as normal weight, whereas those who score low on the full scale are likely to be classified as obese.
For the five subscales, 90% of the normal-weight participants and 60% of the obese participants were classified correctly with cross-validation accuracy of 79% for the total sample. The means of the discriminant functions at the group centroids, 0.49 for normal weight and –0.94 for obese, suggest that individuals who score high on all five scales are likely to be classified as normal weight, whereas those who score low on the five scales are likely to be classified as obese.
From the DFAs, both the overall scale and subscales are significant predictors of normal weight and obese status. The five-subscale model was slightly better at predicting obese individuals with 79% accuracy compared with 71% accuracy for the full scale. Nevertheless, criterion-related (or
predictive) validity for both the overall scale and subscales is established.
Discussion
Normally, to establish convergent validity, the correlations between two instruments are positive, but in the current research, the correlations between the BKQ and IWQOL-Lite are negative. This has occurred because higher scores on the IWQOL-Lite indicate poorer quality of life on, or a life more impeded by, the concept (i.e., obesity) measured by its scale or subscales, whereas higher scores on the BKQ indicate better weight management integration (i.e., normal weight). The expectation, therefore, is that poorer quality of life (or a high IWQOL-Lite score) would be correlated to lower weight management integration (or a low score on the BKQ), which is consistent with the negative correlations between the BKQ and IWQOL-Lite scale and subscales shown in Table 4.
In this study, a five-factor solution fit the data, whereas in the pilot study, a two-factor solution was appropriately identified. This difference is easily explained. The number of factors would be expected to increase when the number of items in the revised BKQ more than doubled. The results of this study suggest the newly added items widened the sampling of different aspects, or factors, across the weight management domain.
Journal of Social, Behavioral, and Health Sciences 54 The third factor, Conscientious Eating Habits, was found to be an important aspect in weight
management in two studies. For example, Krassner, Brownell, and Stunkard (1979) reported that normal-weight individuals did not feel the need to eat all the food served on their plate (i.e., “clean their plate”) at meal time. However, Rolls (2003) found that obese individuals do not adjust their consumption of food if they have eaten a snack just prior to a meal, and obese individuals will eat significantly more of an open package of prepackaged food than individuals who are not obese. Finally, in Hoke, Timmerman, and Robbins’ (2006) exploratory descriptive study, they found that with some obese individuals, food was a central focus and seeing food prompted these individuals to eat. This supports the existence of Factor 4, Food Centricity.
The theory of integration (C. A. Hernandez, 1991, 1997) provides support for Factor 5, Psychosomatic Awareness. Normal-weight individuals maintain their normal-weight status because they are in tune (i.e., there is a psychosomatic awareness) with their body’s needs, as suggested by the theory. Their thoughts are not centered on food (Factor 4, Food Centricity), and they are not prone to Emotional Eating (Factor 1). Normal-weight individuals live Health-Conscious Lifestyles (Factor 2) and have developed healthy, Conscientious Eating Habits (Factor 3). The individual’s normal-weight self is the desired-weight self, and the attitudes, preferences, and behaviors of the individual support this ideal.
The results of this study provide evidence for the validity and reliability of the BKQ, which suggests that the BKQ is a viable instrument for identifying the attitudes, preferences, and behaviors central to weight management in adults. The BKQ can be used to differentiate between normal-weight and obese individuals with 79% accuracy. Nonetheless, for two subscales—Conscientious Eating Habits and Food Centricity—the evidence of convergent validity was weak with only two of the six
correlations providing support for convergent validity. Therefore, further psychometric testing of the BKQ with a larger sample is warranted, and the revised 40-item BKQ tool should be used in weight management research to develop and/or test the effectiveness of novel weight management
interventions. Moreover, conducting a confirmatory factor analysis to provide greater confidence in the stability of psychometric results is important.
Limitations
A limitation of this research may be its relatively small sample size. Gorsuch (1983) and Kline (1994) recommended a minimum of 100 respondents for exploratory factor analysis. Furthermore,
Journal of Social, Behavioral, and Health Sciences 55
Implication for Practice and Research
With continued psychometric testing, the BKQ instrument shows great potential for use in weight management practice areas such as diabetes education, dietetics, nursing, and psychology.
Practitioners can use the instrument to assess an individual’s attitudes, preferences, and behaviors related to weight management. Attitudes, preferences, and behaviors that are negative or
problematic for an individual seeking to achieve or maintain a normal body weight can be identified, then strategies can be developed with the client to ameliorate one or more of these areas.
Alternatively, the BKQ can be used to assess obese clients in a weight management clinic, and health professionals can focus discussion on individual questionnaire items in which a client’s attitudes, preferences, and behaviors promote weight gain rather than weight loss. Additionally, the BKQ has potential for use in program evaluation if administered before and after education or intervention; for example, increased BKQ scores at the end of the diabetes education program would indicate positive learning outcomes. Finally, the BKQ could also be used as the basis for the
development of tailored weight management interventions for individuals or groups.
This article described the development and testing of the BKQ, an instrument to measure the cognitive behavioral aspects of weight management integration. This research has shown that the BKQ instrument to be both valid and reliable. However, further testing with a larger sample is warranted.
References
Allan, J. D. (1998). Explanatory models of overweight among African American, Euro-American, and Mexican American women. Western Journal of Nursing Research, 20, 45–66.
doi:10.1177/019394599802000104
Alpert, P. T. (2009). Obesity: A worldwide epidemic. Home Health Care Management & Practice, 21, 442–444. doi:10.1177/1084822309334688
Bhupathiraju, S. N., & Hu, F. B. (2016). Epidemiology of obesity and diabetes and their cardiovascular complications. Circulation Research, 118, 1723–1735.
doi:10.1161/circresaha.115.306825
Breuhl Smith, K., & Smith, M. S. (2016). Obesity statistics. Primary Care: Clinics in Office Practice, 43, 121–135. doi:10.1016/j.pop.2015.10.001
Butryn, M. L., Phelan, S., Hill, J. O., & Wing, R. R. (2007). Consistent self-monitoring of weight: A key component of successful weight loss maintenance. Obesity, 15, 3091–3096.
doi:10.1038/oby.2007.368
Cattell, R. B. (1966). The scree test for the number of factors. Multivariate Behavioral Research, 1, 245–276.
Cattell, R. B. (1978). The scientific use of factor analysis in behavioral and life sciences. New York, NY: Plenum.
Compton, M. L. (2002). Women living with Crohn’s disease (Unpublished master's thesis). University of Windsor, Ontario, Canada.
Journal of Social, Behavioral, and Health Sciences 56 Deshaies, K., & Hernandez, C. A. (2011). Integration: A phenomenon to explore in chronic
nonmalignant pain (CNP). Pain Management Nursing, 12, 2–14. doi:10.1016/j.pmn.2009.10.004
DeVellis, R. F. (2017). Scale development: Theory and applications (4th ed., Vol. 26). Thousand Oaks, CA: Sage.
DiStefano, C., Zhu, M., & Mîndrilă, D. (2009). Understanding and using factor scores: Considerations for the applied researcher. Practical Assessment, Research & Evaluation, 14, 20. Retrieved from http://pareonline.net/pdf/v14n20.pdf
Drummond, R. J., Sheperis, C. J., & Jones, K. D. (2016). Assessment procedures for counselors and helping professionals (8th ed.). Hoboken, NJ: Pearson.
Egger, G., & Dixon, J. (2014). Beyond obesity and lifestyle: A review of 21st century chronic disease determinants. BioMed Research International, 2014, 731685. doi:10.1155/2014/731685 Field, A. (2013). Discovering statistics using SPSS (4th ed.). Thousand Oaks, CA: Sage.
Flegal, K. M., Kruszon-Moran, D., Carroll, M. D., Fryar, C. D., & Ogden, C. L. (2016). Trends in obesity among adults in the United States, 2005 to 2014. Journal of the American Medical Association, 315, 2284–2291. doi:10.1001/jama.2016.6458
George, D., & Mallery, P. (2016). IBM SPSS Statistics 23 step by step: A simple guide and reference (14th ed.). New York, NY: Routledge.
Gilmartin, J., & Murphy, M. (2015). The effects of contemporary behavioural weight loss maintenance interventions for long term weight loss: A systematic review. Journal of Research in Nursing, 20, 481–496. doi:10.1177/1744987115599671
Gorsuch, R. L. (1983). Factor analysis (2nd ed.). Hillsdale, NJ: Lawrence Erlbaum Associates. Gorsuch, R. L. (1997). Exploratory factor analysis: Its role in item analysis. Journal of Personality
Assessment, 68, 532–560. doi:10.1207/s15327752jpa6803_5
Guadagnoli, E., & Velicer, W. F. (1988). Relation of sample size to the stability of component patterns. Psychological Bulletin, 103, 265–275. doi:10.1037/0033-2909.103.2.265
Hernandez, C. A. (1991). The lived experience of type I diabetes: Implications for diabetes education. Dissertation Abstract International, A 53, 413.
Hernandez, C. A. (1997). Prediction of metabolic control in individuals with insulin-dependent diabetes mellitus. Dissertation Abstract International, B 58, 3556.
Hernandez, D. A., & Hernandez, C. A. (2015). Weighing in on the Body Knowledge Questionnaire: Initial development and pilot testing. The Diabetes Educator, 40, 369–376.
doi:10.1177/0145721715579107
Heron, M. (2013, December 20). Deaths: Leading causes for 2010. National Vital Statistics Reports, 62, 1–96.
Hoke, M. M., Timmerman, G. M., & Robbins, L. K. (2006). Explanatory models of eating, weight, and health in rural Mexican American women. Hispanic Health Care International, 4, 143–151. doi:10.1891/hhci-v4i3a003
Journal of Social, Behavioral, and Health Sciences 57 Kaiser, H. F. (1974). An index of factorial simplicity. Psychometrika, 39, 31–36.
doi:10.1007/BF02291575
Kline, P. (1994). An easy guide to factor analysis. New York, NY: Routledge.
Kolotkin, R. L., Crosby, R. D., Kosloski, K. D., & Williams, G. R. (2001). Development of a brief measure to assess quality of life in obesity. Obesity Research, 9, 102–111.
doi:10.1038/oby.2001.13
Kraschnewski, J. L., Boan, J., Esposito, J., Sherwood, N. E., Lehman, E. B., Kephart, D. K., & Sciamanna, C. N. (2010). Long-term weight loss maintenance in the United States. International Journal of Obesity, 34, 1644–1654. doi:10.1038/ijo.2010.94
Krassner, H. A., Brownell, K. D., & Stunkard, A. J. (1979). Cleaning the plate: Food left over by overweight and normal weight persons. Behaviour Research and Therapy, 17, 155–156. doi:10.1016/0005-7967(79)90024-X
LoBiondo-Wood, G., & Haber, J. (2014). Reliability and validity. In G. LoBiondo-Wood & J. Haber (Eds.), Nursing research: Methods and critical appraisal for evidence-based practice (8th ed., pp. 289–309). St. Louis, MO: Mosby.
Mekary, R. A., Feskanich, D., Hu, F. B., Willett, W. C., & Field, A. E. (2010). Physical activity in relation to long-term maintenance after intentional weight loss in premenopausal women. Obesity, 18, 167–174. doi:10.1038/oby.2009.170
Mertler, C. A., & Vannatta, R. A. (2017). Advanced and multivariate statistical methods (6th ed.). New York, NY: Routledge.
Niemeier, H. M., Phelan, S., Fava, J. L., & Wing, R. R. (2007). Internal disinhibition predicts weight regain following weight loss and weight loss maintenance. Obesity, 15, 2485–2494.
doi:10.1038/oby.2007.295
Patrick, D. L., Burke, L. B., Gwaltney, C. J., Leidy, N. K., Martin, M. L., Molsen, E., & Ring, L. (2011). Content validity—establishing and reporting the evidence in newly developed patient-reported outcomes (PRO) instruments for medical product evaluation: ISPOR PRO good research practices task force report: Part 2—assessing respondent understanding. Value in Health, 14, 978–988. doi:10.1016/j.jval.2011.06.013
Peirce, D., Brown, J., Corkish, V., Lane, M., & Wilson, S. (2016). Instrument validation process: A case study using the paediatric pain knowledge and attitudes questionnaire. Journal of Clinical Nursing, 25, 1566–1575. doi:10.1111/jocn.13130
Rolls, B. J. (2003, March–April). The supersizing of America: Portion size and the obesity epidemic. Nutrition Today, 38, 42–53.
Stevens, J. P. (2009). Applied multivariate statistics for the social sciences (3rd ed.). New York, NY: Routledge.
Stuckey, H. L., Boan, J., Kraschnewski, J. L., Miller-Day, M., Lehman, E. B., & Sciamanna, C. N. (2011). Using positive deviance for determining successful weight-control practices. Qualitative Health Research, 21, 563–579. doi:10.1177/1049732310386623
Journal of Social, Behavioral, and Health Sciences 58 Swift, R. H., Harrigan, E. P., Cappelleri, J. C., Kramer, D., & Chandler, L. P. (2002). Validation of
the behavioural activity rating scale (BARS): A novel measure of activity in agitated patients. Journal of Psychiatric Research, 36, 87–95. doi:10.1016/S0022-3956(01)00052-8 Tabachnick, B. G., & Fidell, L. S. (2012). Using multivariate statistics (6th ed.). Boston, MA: Pearson
Education.
White, J. H. (1984). The process of embarking on a weight control program. Health Care for Women International, 5, 77–91. doi:10.1080/07399338409515639
Yong, A. G., & Pearce, S. (2013). A beginner's guide to factor analysis: Focusing on exploratory factor analysis. Tutorials in Quantitative Methods for Psychology, 9, 79–94.
doi:10.20982/tqmp.09.2.p079
Journal of Social, Behavioral, and Health Sciences 59
Appendix
Content Validity Questionnaire
The Body Knowledge Questionnaire (BKQ) is an instrument that measures a new concept called weight management integration. Weight management integration refers to the behaviors, attitudes, and preferences held (consciously or unconsciously) by individuals that help them maintain their current weight. The response format of the BKQ is a 6-point Likert scale from 1 (strongly disagree) to 6 (strongly agree), with most questions stated so that higher scores represent increased weight management integration (i.e., more likely to be reflective of normal weight). Some of the items are worded so that higher scores represent lower levels of weight management integration (i.e., are more reflective of obesity). These latter items will be reverse scored when the tool is actually being used, so you do not need to be concerned that the items are not all “going in the same direction.”
Please answer the following questions based on your expertise (experiential and professional readings) in the area of weight management or bariatrics.
1. Are there any items that are missing (i.e., items representing other attitudes, preferences, and behaviors that you have found clearly distinguish between normal-weight and obese individuals)? If so, please list these below. Use the back of the page if necessary.
2. Are there any items that you think should not be included (i.e., items representing attitudes, preferences, and behaviors that you have not observed any difference between normal-weight and obese individuals)? If so, please write the item numbers below.
Item Number Explanation for Removal
3. Are there any items that are difficult to understand either because (a) they are worded awkwardly or (b) they do not make sense given the Likert response format? If so, please list them below, and suggest alternative wording.
Journal of Social, Behavioral, and Health Sciences 60 4. Are there any words that would be difficult for your patients/clients to understand? If so,
please list them below.
Item Number Word(s) Difficult to Understand
5. Please time yourself, and take the questionnaire as if you were responding to it. How much time did it take?
________ minutes
6. Optional: If you decide to allow the researchers to use the data from your responses to the BKQ, please state your height and weight.
Height: ________ Weight: ________