RESEARCH
Compositional and functional differences
in human gut microbiome with respect to equol
production and its association with blood lipid
level: a cross-sectional study
Wei Zheng
1,2†, Yue Ma
3,4,5†, Ai Zhao
2, Tingchao He
6, Na Lyu
3,5, Ziqi Pan
6, Geqi Mao
6, Yan Liu
6, Jing Li
3,5,
Peiyu Wang
2, Jun Wang
3*, Baoli Zhu
3,4,5,7,8*and Yumei Zhang
6,9*Abstract
Background: Gut microbiota affects lipid metabolism interactively with diet. Equol, a metabolite of isoflavones pro-duced by gut bacteria, may contribute substantially in beneficial lipid-lowering effects. This study aimed to examine equol production-related gut microbiota differences among humans and its consequent association with blood lipid levels.
Results: Characterization of the gut microbiota by deep shotgun sequencing and serum lipid profiles were com-pared between equol producers and non-producers. Gut microbiota differed significantly at the community level between equol producers and non-producers (P = 0.0062). At the individual level, 32 species associated with equol production were identified. Previously reported equol-producing related species Adlercreutzia equolifaciens and Bifido-bacterium bifidum showed relatively higher abundance in this study in equol producers compared to non-producers (77.5% vs. 22.5%; 72.0% vs. 28.0%, respectively). Metabolic pathways also showed significant dissimilarity between equol producers and non-producers (P = 0.001), and seven metabolic pathways were identified to be associated with the equol concentration in urine. Previously reported equol production-related gene sequences in A. equolifaciens 19450T showed higher relative abundance in equol producers than in non-producers. Additionally, we found that equol production was significantly associated with the prevalence of dyslipidemia, including a marginal increase in serum lipids (27.1% vs. 50.0%, P = 0.02). Furthermore, equol production was not determined by intake of soy isofla-vones, which suggested that gut microbiota is critical in the equol production process.
Conclusion: Both content and functioning of the microbial gut community significantly differed between equol producers and non-producers. Further, equol producers showed lower prevalences of dyslipidemia, which suggests the important role that equol might play in lipid metabolism by gut microbiota.
Keywords: Equol phenotype, Gut microbiota, Blood lipid, Soy isoflavone, Dyslipidemia
© The Author(s) 2019. This article is distributed under the terms of the Creative Commons Attribution 4.0 International License (http://creat iveco mmons .org/licen ses/by/4.0/), which permits unrestricted use, distribution, and reproduction in any medium, provided you give appropriate credit to the original author(s) and the source, provide a link to the Creative Commons license, and indicate if changes were made. The Creative Commons Public Domain Dedication waiver (http://creat iveco mmons .org/ publi cdoma in/zero/1.0/) applies to the data made available in this article, unless otherwise stated.
Open Access
*Correspondence: [email protected]; [email protected]; [email protected]
†Wei Zheng and Yue Ma contributed equally to this work.
3 CAS Key Laboratory of Pathogenic Microbiology and Immunology,
Institute of Microbiology, Chinese Academy of Science, Beichen West Road 1, Haidian District, Beijing 100101, China
6 Department of Nutrition and Food Hygiene, School of Public Health,
Peking University Health Science Center, Xueyuan Road 38, Haidian District, Beijing 100191, China
Background
Cardiovascular disease (CVD) is the leading cause of death globally, and dyslipidemia is a critical modifiable risk factor for its development. Recent evidence reveals that the gut microbiome is a novel target to reduce car-diometabolic risk factors such as dyslipidemia [1]. Gut microbiome exerts its effect through a complex system of microorganism–microorganism and host–microorgan-ism interactions [2]. Emerging evidence showed that gut microbiota may regulate blood lipid metabolism inde-pendently and interactively with diet [3, 4].
Isoflavones (SI), a class of phytoestrogens that can be found in high amounts in soy foods, may play an impor-tant role in cardiometabolic health due to its antioxidant, anti-proliferative, or apoptotic effects [5–9]. It is esti-mated that approximately a 10% reduction in low den-sity lipoprotein-cholesterol (LDL-C) was due to soy in comparison with animal protein [5, 10] and up to 72% of its benefit were contributed by SI [7]. However, further studies suggested that the beneficial effect of SI varied in different populations [11] may be due to its most bioac-tive metabolic product, equol [12]. Asians are prone to benefit from soy products compared to Western popula-tions because approximately 50–60% of Chinese/Japanese individuals may produce equol (called an equol-producer [EP]) [13]. Equol is produced by specific colonic bacte-ria from its precursor daidzein, a major type of SI [12,
14], and whether individuals do or do not produce equol depends on their gut microbial community [15, 16]. Dozen strains of bacteria that are involved in equol pro-duction pathways have been isolated after considerable efforts [15, 17, 18]. However, the overall difference in gut microbiota between an EP and non-producer (NP) and its implication on blood lipid regulation remain unexamined. Development of deep shotgun sequencing and metage-nome-wide association analysis enabled in-depth char-acterization into the content, diversity, and functioning of the microbial gut community. In our study, we deter-mined gut microbiota using metagenome sequencing to establish a comprehensive framework of equol produc-tion-related gut microbiota differences among humans, as well as its consequent association with blood lipid levels.
Results
General cohort description
The present study included a total of 99 with an average age of 36 years old, including 46 males and 53 females, 59 out of which were classified to be EP according to equol excretion status in urine. A 24-h urine sample was collected after oral administration of a capsule of SI for 3 days and equol excretion was determined by high per-formance liquid chromatography (HPLC).
Gut microbiota diversity in EP and NP
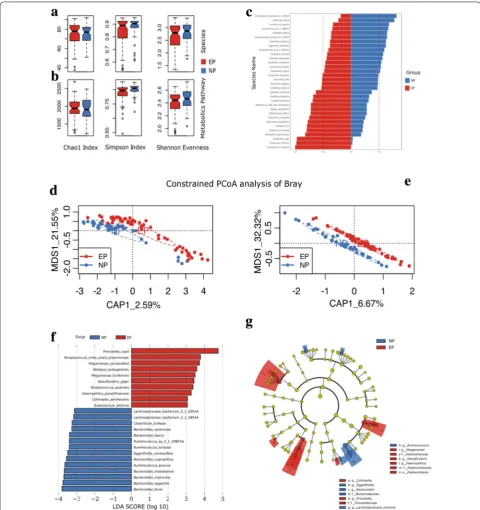
To identify the association of gut microbiome with equol phenotype, we performed shotgun metagenomics sequencing of fecal samples from study participants. The DNA sequencing data have been deposited in the BIG Data Center (accession numbers: CRA001481). Metagen-omic reads from 99 fecal samples were processed with MetPhlAn2 (Metagenomic Phylogenetic Analysis) to determine composition of gut microbiome and to cal-culate the relative abundances of species. The microbial composition at phylum level was shown in Additional file 1: Figure S1. Phyla and species with relative abun-dance equal to or larger than 0.0001 of the average level in each group (EP and NP) were included in further anal-yses. We compared the difference in microbial composi-tion between EP and NP adjusted for age, gender, BMI, equol phenotype and smoking habit (Table 2). Only the factor of equol was significantly associated with inter-individual microbial distance and this factor explained 2.05% of the variation in microbial composition (P = 0.02 for equol). We then discovered significant community level microbiota differences, using the Adonis test and Bray–Curtis distance matrix calculated from species-level composition between EP and NP (P = 0.0062). How-ever, no significant difference in bacterial richness and evenness were observed between EP and NP (P = 0.64 for Shannon–Wiener index, P = 0.72 for Chao1, and P = 0.43 for Simpson index in Fig. 1a). PCoA based on the Bray– Curtis distance matrix were conducted to reveal dissimi-larity in metagenome-based relative abundances between EP and NP at the species level (Fig. 1d). EP and NP are clustered into different structures of gut microbiome as indicated in Fig. 1d.
Identified bacterial species and biomarkers associated with equol production
At individual taxa level, we used the criteria mentioned above and kept 139 from a total of 351 species for fur-ther analyses. With Wilcoxon rank-sum test, 32 species
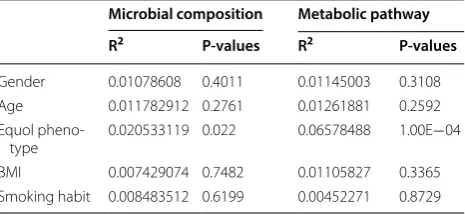
Table 1 Variation in microbial composition contributed by different factors
BMI body mass index
* P-value was calculated by Adonis test
Microbial composition Metabolic pathway
R2 P-values R2 P-values
Gender 0.01078608 0.4011 0.01145003 0.3108
Age 0.011782912 0.2761 0.01261881 0.2592
Equol
pheno-type 0.020533119 0.022 0.06578488 1.00E−04
BMI 0.007429074 0.7482 0.01105827 0.3365
showed significant differences in two groups (Fig. 1c; P < 0.1). Equol producing-related species Adlercreut-zia equolifaciens and Bifidobacterium bifidum, showed higher relative abundance in EP than in NP (77.5% vs. 22.5% and 72.0% vs. 28.0%, respectively), despite the sig-nificance being only marginal (P = 0.06 and P = 0.08). We also used LEfSe analysis for biomarker discovery within the microbiome at species level between the two groups; 14 biomarkers were defined within the NP group and 10 biomarkers within the EP group as shown in Fig. 1f, g.
Functional diversity of the gut microbiome in EP and NP
To investigate the differences in presence/absence, as well as abundance of metabolic pathways in the gut micro-bial community between EP and NP, we carried out analysis on the metagenomics sequences and obtained their genomic functional potential using HUMAnN2 (the HMP Unified Metabolic Analysis Network) [19]. A total of 134 metabolic pathways with relative abundance larger than 0.0001 of the average level were included in the analysis. We identified 75 metabolic pathways, which showed significant differences (P < 0.1) between EP and NP by Wilcoxon rank-sum test, 57 of which remained statistically significant after false discovery rate (FDR) adjustment (Q < 0.1). Most of these pathways are biosyn-thesis pathways (55 out of 75), among which 7 pathways were significantly associated (P < 0.05) with equol con-centration in urine by using Spearman correlation analy-sis (Additional file 1: Figure 2). Chao1 index and evenness in metabolic pathways showed no significant differences between EP and NP, and richness in metabolic path-ways was higher in EP than in NP (P = 0.86 for Chao1, P = 0.12 for Shannon–Wiener index, and P = 0.015 for Simpson index in Fig. 1b). Subsequently, we conducted constrained PCoA analysis on the metabolic pathways (Fig. 1e) and statistical significance test (anova.cca) on the result of constrained PCoA, which showed signifi-cant dissimilarity between EP and NP for metabolic path-ways as well (Permanova P = 0.001). We also established
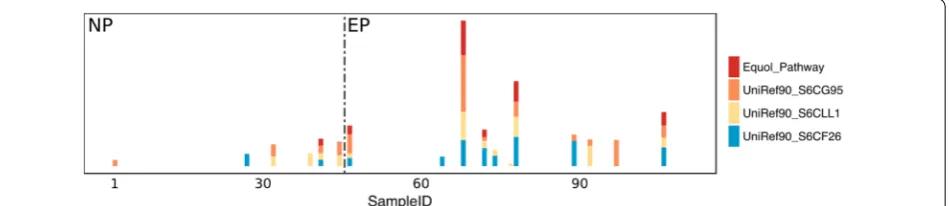
an equol production-related pathway based on the three critical gene sequences in A. equolifaciens 19450T, Egg-erthella sp. YY7918, and Lactococcus garvieae to blast the reference dataset of HUMAnN2. We found only the genes from A. equolifaciens 19450T can be found with right annotation, and only these genes can be found in the result of HUMAnN2. So, we separated the relative abundances of these genes from the results of the gene part, then we used the relative abundances of these three genes to calculate the geometrical mean as the equol metabolic-related pathway’s abundance. As shown in Fig. 2 and Additional file 2: Table S1 and Table S2, this equol production-related pathway was mainly identified and showed higher relative abundance in EP in this study.
To assess whether the differences in abundance of metabolic pathways in the gut microbial community may explained by other characteristics of the participants, we further calculated the Bray–Curtis distance of the meta-bolic pathway using HUMAnN2 with gender, age, BMI, equol phenotype and smoking habit in the model. The result was similar to the composition of gut microbiome, only the equol phenotype had significant correlation to beta diversity (P = 0.0001) and explains 6.58% of the variation, while the rest of factors do not play significant roles (Table 1).
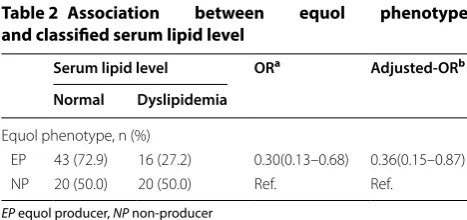
Equol phenotype and prevalence of dyslipidemia
As shown in Table 2, a total of 36 (36.4%) of the par-ticipants were classified as having dyslipidemia. EP showed a substantially lower prevalence of dyslipi-demia (27.1% vs. 50.0%, P = 0.02) than NP. Results from logistic regression models indicated that the associa-tion with dyslipidemia in serum lipid levels remained significant after adjustment for age and BMI (adjusted odds ratio = 0.37 [0.15–0.94], P = 0.036). Serum tri-glycerides (TG) levels was 12% lower in EP compared to NP (1.18 ± 0.48 mmol/L vs. 1.36 ± 0.57 mmol/L, P = 0.08) (Fig. 3a), although the difference between the two groups were marginally significant due to a rela-tively small sample size.
We also tested the correlations between bacterial spe-cies and serum lipid levels from our dataset and found several species with FDR < 0.05. Negative association of Haemophilus parainfluenzae and positive association of Klebsiella pneumoniae and Lachnospiraceae bacterium -8_1_57FAA with total cholesterol (TC), LDL-C, and apolipoprotein B (ApoB) were observed (Fig. 3b). As is indicated in Fig. 1c, EP shows a higher relative abun-dance of H. parainfluenzae and lower levels of K. pneu-moniae and L. bacterium-8_1_57FAA compared to NP. The findings suggest that these species might contribute to the changes in blood lipid levels via equol production.
Equol concentration in urine is determined by microbiota and not food intake of soy isoflavones
Intake of SI was calculated according to a 3-day, 24-h dietary record. We first compared intake of SI (includ-ing total SI, daidzein, genistein, and glycitein) and soy products (including tofu, dried bean curd, soy bean milk, soy milk, dried beans, fermented bean curd, fermented soy beans, and other soy products) between EP and NP. No significant differences between the two groups were observed (Additional file 2: Tables S3, S4). Subsequently, we examined the correlation between intake of daid-zein (the precursor to equol) and equol concentration in urine/equol excretion in 24 h in EP by Pearson cor-relation analysis. The results showed that neither equol concentration nor equol excretion in 24 h was associ-ated with the amount of intake of the precursor, daidzein (r = 0.12, P = 0.3 and r = 0.07, P = 0.5, respectively). These findings suggest that equol production is mostly deter-mined by the gut microbiome of the participants, while the intake of soy isoflavones plays a minimal role if any.
Discussion
In this study, we found that equol production from daid-zein is associated with differences in gut microbiome in humans. We observed, both in terms of composition and
functional capacities, EPs contain a distinct microbial profile in their gastrointestinal tract compared to that of NPs. We identified a list of bacteria with equol producing potential in the comparative analysis including A. equolif-aciens and B. bifidum, which have been tested to show equol production ability in vitro by Maruo et al. [20] and Raimondi et al. [17], respectively. However, the exact role of these species remains to be examined. In terms of functional capacity, we compared metabolic pathways in EP and NP using HUMAnN2, and found no labeled equol production-related metabolic pathways. But this was mainly due to a misclassification of the analytical method, as when we used the three previously reported gene sequences (UniRef90-S6CF26, UniRef90-S6CLL1, and UniRef90-S6CG95) pathways in the results, those pathways indeed also showed a higher relative abundance in EP.
The role of microbiome in shaping equol produc-tion has crucial health implicaproduc-tions. As the most bioac-tive metabolite of SI, equol becomes an area of research focus. This study indicated that EP had a remarkably lower prevalence of dyslipidemia, which were consist-ent with previous reports [12]. Cardiovascular benefit of maintaining elevated high density lipoprotein-cholesterol (HDL-C) levels has been observed in EP in epidemiologi-cal studies [21]. Thus, equol production-related bacteria might also affect human health. In a previous study, Fu et al. [1] showed that human gut microbiomes are associ-ated with overall blood lipid levels, and the composition of gut microbiomes are involved in the development of CVD through different blood lipids (HDL-C and TG). Our study further provides one of the probable mecha-nistic explanations for the microbiome association with blood lipid levels, with equol acting as an intermediary. For instance, we found the genus Eggerthella, a genus identified in Fu et al. [1], tends to be more abundant within the NP group, showing positive correlation with TG and negative correlation with HDL-C; the trends in these two lipids are at the same time associated with a low risk of CVD. This study also identified several addi-tional bacterial species associated with equol phenotype and lipid profiles.
A recent review by Frankenfeld et al. [9] indicated that gut microbiota–phytoestrogen (especially SI) interactions may serve as a novel target for reducing cardiometabolic risk. The equol phenotype present widely influenced cardiovascular, bone, and menopau-sal health, as well as hormone-related cancers such as breast cancer and prostate cancer [12, 22]. Therefore, to characterize gut microbiota of EP and NP by deep shotgun sequencing indicates important health impli-cations, such as risk assessment and management in a variety of diseases.
Table 2 Association between equol phenotype and classified serum lipid level
EP equol producer, NP non-producer
a Odds ratio (OR) indicated OR of being dyslipidemia calculated by logistic regression model
b Adjusted-OR was adjusted for age and BMI
Serum lipid level ORa Adjusted-ORb
Normal Dyslipidemia
Equol phenotype, n (%)
EP 43 (72.9) 16 (27.2) 0.30(0.13–0.68) 0.36(0.15–0.87)
This study has certain limitations. We could not make causal inferences in a population-based cross-sectional study. More experiments are needed to examine the effect of gut microbiota on isoflavone metabolism, blood lipid regulation, and, eventually, health benefits.
Conclusion
In summary, our study discovered compositional and functional differences in human gut microbiome with regard to equol production; previously reported mem-bers of the gut microbial communities and pathways also Fig. 3 Serum lipid profiles and correlations with species. a Blood lipid profiles of the participants by equol phenotype (red color represent EP group and blue color represent NP group). Significant differences by t-test are indicated. b Correlations between species and blood lipid profiles. “*” denotes adjusted P < 0.05 and “#” denotes adjusted P < 0.01. TG triglycerides, LDL-C low density lipoprotein-cholesterol, TC total cholesterol, ApoB
showed differences between EP and NP. These differences could have important impacts on human blood lipid lev-els and related health status.
Methods Participants
This study recruited adults aged 18–65 years in Beijing, China. Individuals with digestive system diseases; infec-tious diseases or diabetes; who used antibiotics, intes-tine and stomach drugs, and hormonal drugs during the past month; and women who were pregnant or lactating were excluded. The volunteers who met the above condi-tions were tested for fasting blood glucose (FBG). Those with a FBG ≥ 6.1 mmol/L were excluded. This study was approved by the Ethical Committee of the Health Science Center at Peking University (NO. IRB00001052-15046). Written informed consent forms were collected from the participants.
SI intake assessment and anthropometric measurements
Information on dietary intake was collected by a 3-day, 24-h dietary record and food frequency questionnaire. SI and other nutrient intakes were calculated according to China Food Composition, 2009 [23]. Standard Tables of Food Composition in Japan 2010 [24] was used as a supplementary standard in case the food intake was not included in China Food Composition, 2009. Anthropo-metric measurements were carried out by trained inves-tigators using a standardized protocol. Body mass index (BMI) was calculated as weight/height2 (kg/m2).
Equol phenotype determination
According to previous reports, soy extract isoflavone challenging increased urinary equol excretion; and, thus, helpful to assess the potential ability of equol production [13]. Therefore, in this study, we determined equol phe-notype after a 3 day isoflavone challenge. Each partici-pant was orally administrated one capsule of SI (North China Pharmaceutical Group Co., Ltd, Hebei, China) for three consecutive days. The capsule contained 22.6 mg daidzin, 0.38 mg daidzein, 1.07 mg genistin, 0.32 mg gen-istein, 1.75 mg glycitin, and 0.18 mg glycitein. From the morning of the third day, each participant voided their bladder and began to collect a complete pooled 24-h urine sample.
S-Equol, daidzein, genistein, and glycitein concentra-tions were determined by HPLC [13]. The column was Capcell PACK UG120 5 μm 4.6 φ × 250 mm (Shiseido Co., Ltd., Japan). The quantification of the SI was achieved by calculating the area ratio of the SI to its sta-ble-labeled analog and interpolation of the value against calibration curves constructed of known concentrations
of pure standards. Those with positive equol excretion in urine were classified to be EP.
Blood lipid profiles determination
Venous blood samples were collected following an overnight fast. TC, TG, and HDL-C were assayed by enzymatic methods using an autoanalyzer (Modu-lar P-800; Roche, Switzerland). Concentration of LDL-C was calculated from the Friedewald equation (LDL-C = TC − (HDL-C + TG/5)). Dyslipidemia was defined according to Guidelines for Prevention and Treatment of Dyslipidemia in Chinese Adults (revised in 2016) [25].
Stool sample collection, DNA extraction, and sequencing
Stool samples were collected on the fourth day after the participants took one capsule of SI for three consecutive days using a stool store kit (PSP® Spin Stool DNA Plus Kit) with preservation solution. DNA was extracted from stool using the TIANamp Stool DNA Kit as described by Manichanh et al. [26]. We conducted quality control using nanodrop instrument and agarose gel electropho-resis. Metagenomics library was constructed by NEX-Tflex Rapid DNA-Seq Kit (Illumina). The procedures included cluster generation, template hybridization, iso-thermal amplification, linearization, blocking and dena-turation, and hybridization of the sequencing primers. The primers used in this process are PP1 (AAT GAT ACG GCG ACC ACC GAG ATC TACAC) and PP2 (CAA GCA GAA GAC GGC ATA CGA GAT ). We constructed paired-end metagenomics library with 450 bp insert size for each samples, sequencing on Illumina HiSeq 2500 plat-form, and obtained around 3 million paired-end reads for each samples.
Metagenomics analysis
protein dataset as the reference dataset. Biomarkers within the microbiome at the species level were explored using linear discriminant analysis effect size (LEfSe) [29].
Statistical analysis
Diversity of microbiota and metagenomics
We measured the feature of microbial composition using three different alpha diversity indices, two of which (Shannon–Wiener and Simpson) were calculated using the function diversity in R package vegan (version 2.4-4), and Chao1’s diversity index was calculated using the function estimateR from the same R package. We chose the Shannon–Wiener index and Simpson index to calcu-late the microbial function alpha diversity. Subsequently, we calculated the Bray–Curtis distance of the above two indices with their relative abundance dataset to examine the beta diversity of microbial composition and func-tion using funcfunc-tion of vegdist in R package vegan. Then, we conducted constrained principal coordinate analysis (constrained PCoA) using the function of capscale in the same package.
Wilcoxon rank‑sum test
The differential in abundance of species, pathways, and all five alpha diversity indices were tested by two-tailed Wilcoxon rank-sum test using function wilox.test from R package stats (version 3.4.1). To control the false discov-ery rate, we used function p.adjust to adjust the P values at the last step (P value correction method was Benjamini and Hochberg method or its alias FDR). The threshold of transformed Q values was defined to be 0.1.
Analysis of variance and permutational multivariate analysis of variance
We compared the difference in microbial composition and function distance matrix between EP and NP using the function adonis in the R package vegan. We deter-mined how variations of species’ Bray–Curtis distances were explained by characteristics of the participants. Four factors including age, gender, BMI, and equol phe-notype were included in the model. Meanwhile, we used the function anova in R package stats to test the sig-nificance of the result from PCoA. In all of these, the P value was determined by 10,000× permutations and the threshold was 0.05.
Association between equol phenotype, related species, and serum lipid levels
The association between equol phenotype and preva-lence of dyslipidemia were examined by multivariate logistic regression model adjusted for age and BMI. To assess the effect of gut microbiome on serum lipid lev-els, the Spearman correlation coefficients between lipid
profiles and relative abundance in species were calculated using the function corr.test in R package psych (version 1.7.8). The P values were adjusted for using the Benjamini and Hochberg method.
Association between equol production rate and soy food intake
To examine whether equol production rate was associ-ated with intake of soy food or SI, we examined the asso-ciation between equol production/concentration in urine and food intake using the Spearman correlation and Chi-square test. The P values for Spearman correlation were adjusted using the Benjamini and Hochberg method.
Additional files
Additional file 1: Figure S1. The microbial composition of each individ-ual is shown at phylum level. The individindivid-uals are sorted by the abundance of Bacteroidetes. Figure S2. Metabolic pathways associated with equol concentration in urine. “*” denotes P < 0.05 and “#” denotes P < 0.01.
Additional file 2: Table S1. Comparison of relative abundance of production-related pathways in EP and NP. Table S2. Diversity in meta-bolic pathways between NP and EP. Table S3. Estimated intake of soy bean products in the participants by equol phenotype according to Food Frequency Questionnaire survey. Table S4. Estimated intake of SI in the participants by equol phenotype according to 24 h diet records during past 3 days (mg/day).
Abbreviations
EP: equol producer; NP: non-producer; SI: soy isoflavone; LDL-C: low density lipoprotein-cholesterol; FBG: fasting blood glucose; BMI: body mass index; HPLC: high performance liquid chromatography; TC: total cholesterol; TG: tri-glycerides; HDL-C: high density lipoprotein-cholesterol; ApoA1: apolipoprotein A1; ApoB: apolipoprotein B; PCoA: principal co-ordinates analysis; LEfSe: linear discriminant analysis effect size; LDA: linear discriminant analysis.
Authors’ contributions
WZ and YM contributed equally to this work. WZ and YM conducted the population study, analyzed and interpreted the data, and drafted the manu-script. AZ, TH, ZP, GM, YL, and PW participated in population study conduc-tion and data interpretaconduc-tion. NL and JL performed metagenome sequencing and assisted with data interpretation. JW, BZ, and YZ designed the study and critically revised the manuscript. All authors read and approved the final manuscript.
Author details
1 Division of Endocrinology and Metabolism, Department of Obstetrics, Beijing
Obstetrics and Gynecology Hospital, Capital Medical University, Beijing, China.
2 Department of Social Medicine and Health Education, School of Public
Health, Peking University Health Science Center, Beijing, China. 3 CAS Key
Laboratory of Pathogenic Microbiology and Immunology, Institute of Micro-biology, Chinese Academy of Science, Beichen West Road 1, Haidian District, Beijing 100101, China. 4 University of Chinese Academy of Science, Beijing,
China. 5 Beijing Key Laboratory of Microbial Drug Resistance and Resistome,
Beijing, China. 6 Department of Nutrition and Food Hygiene, School of Public
Health, Peking University Health Science Center, Xueyuan Road 38, Haidian District, Beijing 100191, China. 7 Collaborative Innovation Center for Diagnosis
and Treatment of Infectious Diseases, The First Affiliated Hospital, College of Medicine, Zhejiang University, Hangzhou, China. 8 Department of
Patho-genic Biology, School of Basic Medical Sciences, Southwest Medical University, Zhongshan Road, Luzhou, Sichuan, China. 9 Beijing Key Laboratory of
•fast, convenient online submission •
thorough peer review by experienced researchers in your field • rapid publication on acceptance
• support for research data, including large and complex data types •
gold Open Access which fosters wider collaboration and increased citations maximum visibility for your research: over 100M website views per year •
At BMC, research is always in progress.
Learn more biomedcentral.com/submissions
Ready to submit your research? Choose BMC and benefit from: Acknowledgements
We thank all the participants for their cooperation with the study as well as all research staff involved in data and sample collection.
Competing interests
The authors declare that they have no competing interests.
Availability of data and materials
The datasets during and/or analysed during the current study available from the corresponding author on reasonable request.
Consent for publication Not applicable.
Ethics approval and consent to participate
This study was approved by the Ethical Committee of the Health Science Center at Peking University (NO. IRB00001052-15046). Written informed con-sent forms were collected from the participants.
Funding
This study is funded by National Natural Science Foundation of China (Grant numbers 81573129, 81172653, and 31471203), Key Research Program of Chinese Academy of Science (Grant number KFZD-SW-219), China National key research and development plan project (2017YFD0400602) and Beijing Natural Science Foundation (Grant number Z140001). Jun Wang is supported by the “1000 Talent” program of China.
Publisher’s Note
Springer Nature remains neutral with regard to jurisdictional claims in pub-lished maps and institutional affiliations.
Received: 26 November 2018 Accepted: 5 April 2019
References
1. Fu J, Bonder MJ, Cenit MC, et al. The gut microbiome contributes to a substantial proportion of the variation in blood lipids. Circ Res. 2015;117(9):817–24.
2. Lozupone CA, Stombaugh JI, Gordon JI, Jansson JK, Knight R. Diver-sity, stability and resilience of the human gut microbiota. Nature. 2012;489(7415):220–30.
3. Matey-Hernandez ML, Williams FMK, Potter T, Valdes AM, Spector TD, Menni C. Genetic and microbiome influence on lipid metabolism and dyslipidemia. Physiol Genomics. 2018;50(2):117–26.
4. Nakaya K, Ikewaki K. Microbiota and HDL metabolism. Curr Opin Lipidol. 2018;29(1):18–23.
5. Jenkins DJ, Mirrahimi A, Srichaikul K, et al. Soy protein reduces serum cholesterol by both intrinsic and food displacement mechanisms. J Nutr. 2010;140(12):2302S–11S.
6. Hooper L, Kroon PA, Rimm EB, et al. Flavonoids, flavonoid-rich foods, and cardiovascular risk: a meta-analysis of randomized controlled trials. Centre for Reviews and Dissemination (UK); 2008.
7. Taku K, Umegaki K, Sato Y, Taki Y, Endoh K, Watanabe S. Soy isoflavones lower serum total and LDL cholesterol in humans: a meta-analysis of 11 randomized controlled trials. Am J Clin Nutr. 2007;85(4):1148–56. 8. Yamakoshi J, Piskula MK, Izumi T, et al. Isoflavone aglycone-rich extract
without soy protein attenuates atherosclerosis development in choles-terol-fed rabbits. J Nutr. 2000;130(8):1887–93.
9. Frankenfeld CL. Cardiometabolic risk and gut microbial phytoestrogen metabolite phenotypes. Mol Nutr Food Res. 2017;61(1):1500900. https :// doi.org/10.1002/mnfr.20150 0900
10. Zhan S, Ho SC. Meta-analysis of the effects of soy protein containing isoflavones on the lipid profile. Am J Clin Nutr. 2005;81(2):397–408.
11. Setchell KD, Brown NM, Summer S, et al. Dietary factors influence produc-tion of the soy isoflavone metabolite s-(−)equol in healthy adults. J Nutr. 2013;143(12):1950–8.
12. Setchell KD, Brown NM, Lydeking-Olsen E. The clinical importance of the metabolite equol—a clue to the effectiveness of soy and its isoflavones. J Nutr. 2002;132(12):3577–84.
13. Liu B, Qin L, Liu A, et al. Prevalence of the equol-producer phenotype and its relationship with dietary isoflavone and serum lipids in healthy Chinese adults. J Epidemiol. 2010;20(5):377–84.
14. Xu X, Wang HJ, Murphy PA, Cook L, Hendrich S. Daidzein is a more bio-available soymilk isoflavone than is genistein in adult women. J Nutr. 1994;124(6):825–32.
15. Rafii F. The role of colonic bacteria in the metabolism of the natural isofla-vone daidzin to equol. Metabolites. 2015;5(1):56–73.
16. Yuan JP, Wang JH, Liu X. Metabolism of dietary soy isoflavones to equol by human intestinal microflora—implications for health. Mol Nutr Food Res. 2007;51(7):765–81.
17. Raimondi S, Roncaglia L, De Lucia M, et al. Bioconversion of soy isofla-vones daidzin and daidzein by Bifidobacterium strains. Appl Microbiol Biotechnol. 2009;81(5):943–50.
18. Hur HG, Lay JO Jr, Beger RD, Freeman JP, Rafii F. Isolation of human intes-tinal bacteria metabolizing the natural isoflavone glycosides daidzin and genistin. Arch Microbiol. 2000;174(6):422–8.
19. Truong DT, Franzosa EA, Tickle TL, et al. MetaPhlAn2 for enhanced metagenomic taxonomic profiling. Nat Methods. 2015;12(10):902–3. 20. Maruo T, Sakamoto M, Ito C, Toda T, Benno Y. Adlercreutzia equolifaciens
gen. nov., sp. nov., an equol-producing bacterium isolated from human faeces, and emended description of the genus Eggerthella. Int J Syst Evol Microbiol. 2008;58(Pt 5):1221–7.
21. Wong JM, Kendall CW, Marchie A, et al. Equol status and blood lipid pro-file in hyperlipidemia after consumption of diets containing soy foods. Am J Clin Nutr. 2012;95(3):564–71.
22. Lampe JW. Emerging research on equol and cancer. J Nutr. 2010;140(7):1369S–72S.
23. Yang YXWG, Pan XC. China food composition. 2nd ed. Beijing: Pecking University Medical Press; 2009.
24. Bureau OfRPDSaTP. Standard tables of food composition in Japan. Tokyo: Ishiyaku Publishers, Inc; 2010.
25. Adults JCfDCGoPaToDi. Chinese guidelines on prevention and treat-ment of dyslipidemia in adults (Revised Edition 2016). Chin Circ J. 2016;31(10):937–53.
26. Manichanh C, Rigottier-Gois L, Bonnaud E, et al. Reduced diversity of fae-cal microbiota in Crohn’s disease revealed by a metagenomic approach. Gut. 2006;55(2):205–11.
27. Li R, Yu C, Li Y, et al. SOAP2: an improved ultrafast tool for short read align-ment. Bioinformatics. 2009;25(15):1966–7.
28. Abubucker S, Segata N, Goll J, et al. Metabolic reconstruction for metagenomic data and its application to the human microbiome. PLoS Comput Biol. 2012;8(6):e1002358.