ISSN: 2008-6822 (electronic)
http://dx.doi.org/10.22075/ijnaa.2020.4227
Improving of Feature Selection in Speech Emotion
Recognition Based-on Hybrid Evolutionary
Algorithms
Shadi Langari*, Hossein Marvi and Morteza Zahedi
Faculty of Computer Engineering, Shahrood University of Technology, Shahrood, Iran
(Communicated by J. Vahidi )
Abstract
One of the important issues in speech emotion recognizing is selecting of appropriate feature sets in order to improve the detection rate and classification accuracy. In last studies researchers tried to select the appropriate features for classification by using the selecting and reducing the space of features methods, such as the Fisher and PCA. In this research, a hybrid evolutionary algorithm is proposed which uses support vector machine classifier and cuckoo search algorithm in combination with the genetic algorithm in order to select the optimal features. In the proposed method, at first, a set of characteristics based on the Cepstral, Spectral and Fourier coefficients of the speech signal is extracted and then with the proposed hybrid algorithm, the operation of selecting the optimal feature set is performed. The results of the experiments on the famous Berlin’s emotional speech database showed that using this proposed method for selecting the features, increases the classification accuracy to about 93%.
Keywords: Speech Emotion recognition, Feature Selection, Evolutionary Algorithm
2010 MSC: 68T10, 68T20.
1. Introduction
Speech signal is a complex signal that, in addition to transmitting messages, also includes the char-acteristics of the speaker, including gender, age, language, dialect, feelings, and so on. Therefore, in recent decades, researchers have been exploring various ways to increase the efficiency of the spoken
∗Corresponding author
Email address: [email protected] (Shadi Langari*, Hossein Marvi and Morteza Zahedi)
communication in human-machine interactions such as speech recognition and speaker identification. One of the important goals of speech recognition systems is to create systems that can be heard and respond appropriately. This has led to one of the most important and challenging research in recent years called automatic Speech Emotion Recognition(SER) [1]. In recognizing emotion from speech, the recognition is done by extracting and selecting the appropriate set of features from the emotional speech signal and modeling the classifier with this features.
In general, most of the research on speech emotion recognition have studies four key areas: 1-Emotional Speech Datasets 2- Feature Extraction, 3- Feature Selection (reduction) and 4- Classifi-cation. A review of past research shows that the development of these systems has continued with the improvement and development of these areas. In this study, after briefly reviewing these sections and related work, a method is proposed to implement speech emotion recognition system using im-proved hybrid evolutionary algorithm to select the appropriate feature set which has higher detection accuracy. Numerous experiments have been performed to evaluate the performance of the proposed method which will be reported at the end.
2. Background concepts and related work
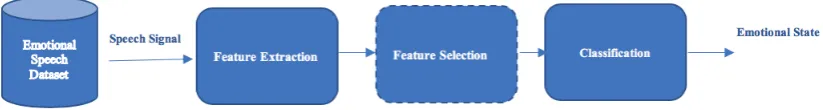
Speech emotion recognition system basically includes three sections: 1- feature extraction, 2-feature reduction (or selection) and 3- classification. The basic block diagram of speech emotion recognition system is shown in Fig. 1.In this section, a review of the subject literature including the types of emotional speech databases and the feature selection and classifications in prior research will be presented.
Figure 1: The basic block diagram of the speech emotion recognition system
The feature extraction and selection can be known as the most important sections in speech emotion recognition due to the ambiguity of the effective features in emotion recognition and vocal diversity [2]. Feature extraction is carried out due to focusing on the information in signal and improving the level of similarity and non-similarity among different classes and also reducing data and computation [3]. Generally, two categories of features are used: characteristics of the vocal tract system and prosodic features. The first category is related to the vocal tract which includes Cepstral coefficients such as MFCC, LPCC and Formants. Typically, these features represent the energy distribution over a frequency range of a speech [4]. The second category are extracted features from prosodic data namely Pitch, energy and duration. In this study, in addition to these two sets of features, the derived characteristics from Fourier harmonic coefficients are also used.
is used which is a collection of data in German. There are 800 speech signals in this collection which are expressed by 10 speakers (5 male and 5 female) in seven emotional states: joy, sadness, anger, fear, disgust, boredom and neutral [5].
In the following section of the research background, we will review some of the studies that have suggested different ways of improving speech recognition efficiency in recent years.
2.1. Related work
To enhance the performance of speech emotion recognition systems, Chauhan et al. [6] used lin-ear predictive residual feature extraction (LP) and neural network classifiers and Gaussian mixture model (GMM) to classify emotions on the IITKGP-SESC emotional speech datasets which includes eight emotions anger, compassion, disgust, fear, happy, neutral, sarcastic and surprise. The emotion recognition performance was observed to be about 56%. Lee et al. [7] extracted prosodic features such as zero crossing rate, root mean square energy, harmonics-to noise ratio and 12 Mel frequency cepstral coefficients and their deltas from speech signals and then using hierarchical binary decision tree method and Support Vector Machine (SVM) classifier for analysis of anger happy, sad, neutral, emphatic. Another study used the Mandarin Chinese language dataset, which includes 5400 utter-ances in six categories of emotion: sadness, anger, fear, surprise, happiness, and disgust [8]. In this study, a three-level classification model is proposed which features are selected at each level by Fisher feature selection and SVM, and then by using Principal Component Analysis (PCA) approach feature reduction is performed, and then ANN is used for classification. The mean accuracy for each level were reported to be 86.5%, 68.5% and 50.2%, respectively. Gangamohan et al. [9] by using features derived from excitation source model and subdivision analysis method in feature extraction, on four emotional classes (anger, happiness, naturalness and sadness) in the Berlin emotional database have obtained 69% accuracy.
Another work carried out on the six class of the Berlin emotional speech database and used Mel frequency cepstrum coefficients (MFCC), wavelet features of speech, pitch of vocal traces were considered for speech emotion recognition. Gaussian mixture model (GMM), k-Nearest Neighbor (k-NN) models considered for classification and recognition of six emotions: happy, angry, neutral, surprised, fearful, and sad in Berlin emotion database [10]. In the report of Vignolo et al. [11], an evolutionary optimization method for searching a filter bank is proposed that maximizes classification accuracy in the detection of stressful and emotional speech. The results of this study on the two sets of Indian and German datasets were reported to be 91.3% and 42.5%, respectively. One of the approaches to speech emotion recognition is related to the classification problem that Fayek et al. [12] have proposed a frame-based formulation to SER that relies on minimal speech processing and end-to-end deep learning to model intra-utterance dynamics.. Deep predicts the probability of each emotional class occurring for each frame of an input speech. The correct detection results in this study were obtained 64.78%on the IEMOCAP dataset.
3. Proposed method
The proposed method for improving the performance of speech emotion recognition consists of five steps:
1. Preprocessing
5. Classification
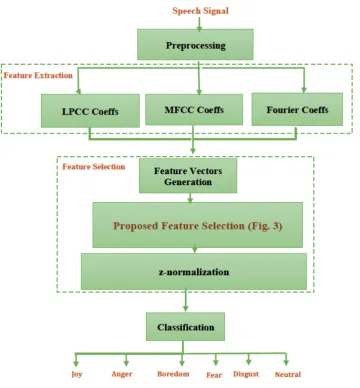
The flowchart of the proposed method is presented in Fig. 2, which will be described in the following.
Figure 2: The flowchart of the proposed speech emotion recognition
3.1. Preprocessing
At preprocessing stage, the speech signal is normalized to eliminate amplitude changes during recording, with the maximum and minimum amplitudes limited to±1. Then signal is framed using Hamming window of 20 ms size with 10 ms overlapping.
3.2. Spectral and Cepstral Feature Extraction
prosodic features such as duration and energy. Actually, spectral features are voice information which is directly derived from the spectrum of the speech signal. These derived features from the spectrum, using the filter banks, emphasis on equal weight for each frequency components in processing speech signals.
One of the extracted features related to the vocal tract characteristics is derived Cepstral Co-efficient from Linear Predictive; LPCC. The main idea of linear predictive analysis is that the nth sample of a speech signal can be obtained using a linear combination of previouspsamples according to Eq. 3.1.
S(n)≈a1s(n−1) +a2s(n−2) +...+aps(n−p) (3.1)
where a1, a2, a3, .. are calculated as the linear predictive coefficients in each frame. To calculate the
unique value of these coefficients, sum square of the difference between the predicted speech samples and actual ones, namely the prediction error, become minimum. To do this, prediction error has to be differentiated with respect to eachak and then the result is equated to zero. Calculated Cepstral
coefficients Cm from ak are obtained using the Eq. 3.2:
Cm = m−1
X
k=1
k
mCkam−k f or C0 = logep and 1< m < p (3.2)
The second category of extracted feature from spectral information are Mel Frequency Cepstral Coefficients that represent the short-term power spectrum of a frame speech using the linear cosine transform of a log power spectrum on a nonlinear Mel scale of frequency. As it is shown in research, the human auditory system processes the speech signal in a nonlinear way. It is also proved that the lower frequency components of a signal contain clearer phonemic information; so a nonlinear Mel scale of frequency filter bank is used to pre-emphasis the lower frequency components among higher frequencies. To obtain MFCCs after pre-emphasizing the speech signal and segmenting it into frames of 20 ms with an overlap of 10 ms, and applying Hamming window on each frame, the magnitude of spectrum is obtained using Discrete Fourier Transform for each frame. Then, in order to obtain the Mel-Spectrum, Fourier coefficients signal passes through a Mel-filter bank. At the end, the Discrete Cosine Transform is applied to the logarithmic Mel frequency coefficients to extract MFFCs. Since these coefficients contain information from each specific frame, are considered as static features. The first and second order of derivation of these coefficients can be used besides the main coefficients to get more information about temporal dynamics of the signal [14, 15]. The procedure for extracting the MFCCs and their derivations are presented in Eq. 3.3. to Eq. 3.5.
X(k) =
N−1
X
n=0
x(n)e−j2Nπnk; 0≤k ≤N −1 (3.3)
s(m) =
N−1
X
k=0
|X(k)|2H
m(k); 0≤m ≤M−1 (3.4)
C(n) =
M−1
X
m=0
log(s(m)) cos(nπ(m−0.5)
M ); 0≤n≤C−1 (3.5)
As it is expressed in researches, higher amplitude portions of a speech signal spectrum, such as Formants, are less affected by noise [16]. Knowing this, Formant parameters can be used as complementary of Cepstral features. Also, it should be noticed that Cepstral features only use the amplitude (energy) information of power spectrum of speech while Formants use frequency informa-tion too. Generally, formants represent sequences of vocal tract shapes which can be analyzed using their power, situation, and bandwidth to extract special emotional information of the vocal tract. The results of this study showed that the combination of formants with other features did not have a significant effect on the enhancement of detection efficiency, although further research in this area is warranted in the future.
3.3. Feature extraction Based on Fourier Harmonic Coefficients
In Fourier analysis, a signal is decomposed into its fundamental sinusoidal vibrations and if it is periodic, it could be described based on a series of harmonic sine and cosine waves such as integer coefficients of a fundamental frequency [15]. In other words, a speech signal can be represented as output of the transmission of a glottal excited wave through a linear time-varying filter which models the excitation characteristics of the larynx [17]. Features related to Fourier parameters and their first and second order of derivation are used in speech emotion recognition by Wang et al. [15]. In this work, the speech signalx(m) is segmented to L frames in a way that it can be represented as a combination of Fourier parameters according to Eq. 3.6 and Eq. 3.7.
x(m) =
M
X
k=1
Hkl(m)(cos(2πf
l k
Fs
m) +φlk) (3.6)
H(k) =
N−1
X
m=0
x(m)e−j2Nπmk; k = 0,1,2, ..., N −1 (3.7)
The harmonic part of the model is a Fourier series representation of speech signal’s periodic compo-nents, that includes frequency, amplitude and phase. As it is shown in Eq. (1), Hkl is the Fourier parameter of the Lth frame and Hi is the amplitude of the ith Fourier parameter (average values of
Hi). So, a feature vector for Hk are estimated for all frames of speech signal from frame 1 to frame
L.
3.4. Proposed Feature selection
The proposed algorithm for selecting an optimal subset of features is a combination of genetic algorithm (GA) techniques, Cuckoo Search (CS) and Support Vector Machine (SVM) classifier. GA is a global random search method that starts by randomly generating an initial population of chromosomes and using different operators to improve this population based on a fitness function. The cuckoo search algorithm is also a nature-inspired algorithm based on the reproduction of cuckoo birds. The cuckoo usually lays its fertilized eggs in the nests of other hosts, and the host bird exhibits two possible behaviors when it discovers that it does not belong to its nest: either throws the eggs out of the nest or leaves the nest. The basis of this algorithm is based on the following three rules [18]:
1. Each cuckoo puts one egg (solution) in a random nest.
2. The best nests are passed on to the next generation in terms of egg quality
3. The number of nests in the host is constant and a host can detect alien eggs with probability pa ∈[0,1]. In this case, the host can drop the egg or leave the nest and create a new nest in a
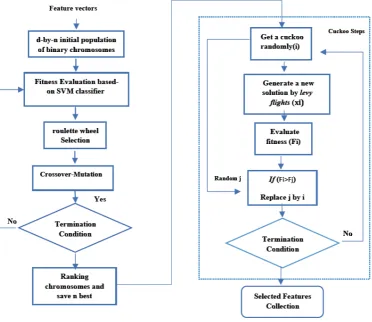
In our proposed feature selection method, at first step, GA explores the search place in order to either isolate the most promising region of the search space. In the second step, to improve global search and avoid trapping into local optima, it is introduced CS to explore search space (starting with the solution obtained by GA and find new better solutions). The proposed feature selection is shown in Fig. 3. As shown in Flowchart Fig. 3, this study used a combination of cuckoo algorithm with
Figure 3: The flowchart of the proposed feature selection method
genetic algorithm in that a solution represents a feature set that in the genetic algorithm combines chromosome (solution) and gene (feature) concepts, And in the cuckoo algorithm are represented by nest and egg concepts, respectively. To choose whether or not to select a feature, a binary vector with a length equal to the total number of features is used as a solution such that the number in each vector means selecting the corresponding feature for the construction of the new nest and the zero represents the non-selection of the feature. After generating the initial population with n chromosomes consisting of d genes, population estimation is performed using fitness function and then the cross-over and mutation operators and selecting the best solutions for the next generation are applied to these chromosomes. At first step of GA, n-by-d (number of features) initial population of binary chromosomes are generated randomly, and the individuals are evaluated using fitness function (Eq. 3.8)
F(i) = wr∗Acc+ 10∗wn∗fnum−1 (3.8)
Where Acc represents the accuracy of classifier, fnum represents the number of features and wr, wn
as an initial population for CS. Therefor the CS phase starts with a population, which is closer to optimal solution, and forith cuckoo the following Levy flight is performed:
xti+1 =xti+α⊕Levy(λ); Levy(u) =t−λ, 1< λ≤3 (3.9)
Further, CS will be obtained the best model parameters vector.
3.5. classification
The last step in our proposed SER is the use of a support vector machine classifier (SVM) with Gaussian radial basis kernel function to classify speech signals into seven emotional categories. At first, to minimize the effect of speaker variability on the detection rate, the feature vectors are normalized using z-standardization method [19] according to the Eq. 3.10 and then applied to classifier.
ˆ fs= f
s−E(fs)
std(fs) (3.10)
In the above equation, fs is the extracted feature vector from signal s, that E(fs) and std(fs) are
its mean and standard deviation values.
4. Experimental results and discussion
4.1. Experimental setup
In this study, we implemented the proposed speech emotion recognition system by using Matlab R2017 software, and we used 535 speech signals of standard Berlin emotional speech dataset (EMO-DB) to evaluat our proposed method. As it is reported in other studies, regarding the classification rate and the efficiency of computation, global features are better than local features [2]. So, each signal should firstly be segmented to frames and then features are extracted from each frame which leads to a curve for each extracted feature set from the signal. Then, 20 mean statistical functions, maximum, minimum, mean, variation range, standard deviation, mean deviation, 1st percentile, 5th percentile, 10th percentile, 25th percentile, 75th percentile, 90th percentile, 95th percentile, 99th percentile, skewness, interquartile range, kurtosis and 10% and 25% trimmed mean is applied to each curve of every feature. At the feature extraction step, 13 coefficients of MFCC and its first and second derivations, 13 coefficients of LPCC and its first and second derivations, and 120 coefficients of the first Fourier harmonic and its first and second derivations are extracted respectively. In feature selection phase, the essential parameters of proposed algorithm are number of nestsn= 100, probability of mutation and crossover are 0.25 and 0.85, respectively.
In this work, three experiments are performed: 1- Performance evaluation of SER using LPCC, SER using MFCC and SER using Fourier coefficients, 2- Performance evaluation of SER using combination of LPCC, MFCC and Fourier coefficients, 3- Performance evaluation of proposed SER.
4.2. Result Analysis and Discussion
Table 1: The confusion matrix of SER using MFCC (81.5%)
EMO-DB SADN. NEUTR. JOY FEAR DISGU. BORED. ANGRY
SADN. 58 0 0 0 0 4 0
NEUTR. 1 68 0 4 0 5 1
JOY 0 1 46 2 2 0 20
FEAR 2 4 3 56 0 0 4
DISGU. 0 3 2 1 37 2 1
BORED. 3 3 0 0 3 72 0
ANGRY 0 0 25 3 0 0 99
Table 2: The confusion matrix of SER using Fourier Parameters (91.96%)
EMO-DB SADN. NEUTR. JOY FEAR DISGU. BORED. ANGRY
SADN. 52 2 0 1 2 0 5
NEUTR. 0 76 2 1 0 0 0
JOY 1 2 61 7 0 0 0
FEAR 0 6 7 56 0 0 0
DISGU. 0 0 0 1 43 2 0
BORED. 0 0 0 0 3 78 0
ANGRY 1 0 0 0 0 0 126
In the second experiment, the LPCC, MFCC and Fourier coefficients were applied as the feature vectors to the classification and the results showed that the combination of these features had a accuracy reduction of about 0.03% compared to the results of the SER using Fourier coefficients.
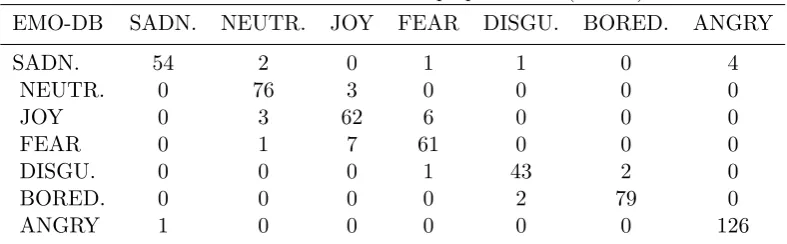
In the last experiment, by applying the proposed feature selection algorithm on the feature vectors, the detection accuracy was increased to 1% and reached to 92.75%. The confusion matrix of this experiment is shown in Tables 3. Also, according to the results shown in Fig. 4, it can be concluded
Table 3: The confusion matrix of proposed SER (92.75%)
EMO-DB SADN. NEUTR. JOY FEAR DISGU. BORED. ANGRY
SADN. 54 2 0 1 1 0 4
NEUTR. 0 76 3 0 0 0 0
JOY 0 3 62 6 0 0 0
FEAR 0 1 7 61 0 0 0
DISGU. 0 0 0 1 43 2 0
BORED. 0 0 0 0 2 79 0
ANGRY 1 0 0 0 0 0 126
that the emotional classes in which experiments had higher detection accuracy and in which one had lower accuracy. For example, the Anger class in all three experiments has the highest accuracy of detection (about 93%), while the recognition of Joy class has a accuracy about 80%. The results of the comparison of the recognition accuracy of these experiments are presented in Table 4.
4.3. Comparison experiment and analysis of performance
Table 4: The comparison of the recognition accuracy of experiments
Experiment LPCC MFCC FP LPCC+MFCC+FP Proposed Method
Accuracy 42% 81.5% 91.96% 91.65% 92.75%
Figure 4: Performance evaluation of the experiments
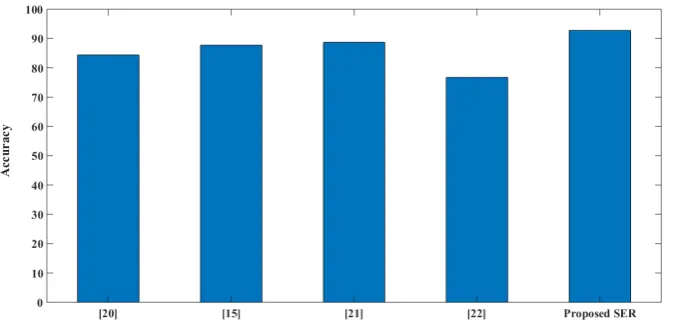
has increased about 8.32% on EMO-DB in comparison with ¨Ozseven’s Study [20] which has used a new statistical feature selection method based on the changes in emotions on acoustic features. According to Fig. 5, the proposed method has a 5% higher accuracy than the Wang et al.’s study [15] that used PCA feature reduction on the same dataset and features. Also, Fig. 5 shows that the accuracy of the proposed method is higher than those researches that used the discrete cosine transform coefficients obtained from the variogram graph, and the features discussed in the previous sections on EMO-DB dataset [21, 22]. The results show that the accuracy of the proposed method has improved from 4% to 16% with respect to these studies, which used the Fisher Discriminant Ratio (FDR) feature selection method.
5. CONCLUSION
Figure 5: Comparison among proposed SER and some previous works
References
[1] S. Casale, A. Russo, and S. Serrano, “Multistyle classification of speech under stress using feature subset selection based on genetic algorithms,” Speech Commun., vol. 49, no. 10–11, pp. 801–810, 2007.
[2] M. El Ayadi, M. S. Kamel, and F. Karray, “Survey on speech emotion recognition: Features, classification schemes, and databases,” Pattern Recognit., vol. 44, no. 3, pp. 572–587, 2011.
[3] J. H. Yeh, T. L. Pao, C. Y. Lin, Y. W. Tsai, and Y. Te Chen, “Segment-based emotion recognition from continuous Mandarin Chinese speech,” Comput. Human Behav., vol. 27, no. 5, pp. 1545–1552, 2011.
[4] C. S. Ooi, K. P. Seng, L. M. Ang, and L. W. Chew, “A new approach of audio emotion recognition,” Expert Syst. Appl., vol. 41, no. 13, pp. 5858–5869, 2014.
[5] F. Burkhardt, A. Paeschke, M. Rolfes, W. Sendlmeier, and B. Weiss, “A database of German emotional speech,” in 9th European Conference on Speech Communication and Technology, 2005, pp. 1517–1520.
[6] S. K. and K. S. R. A. Chauhan, S. G. Koolagudi, “Emotion recognition using LP residual,” in IEEE Students Technology Symposium, 2011, pp. 255–261.
[7] C. C. Lee, E. Mower, C. Busso, S. Lee, and S. Narayanan, “Emotion recognition using a hierarchical binary decision tree approach,” Speech Commun., vol. 53, no. 9–10, pp. 1162–1171, 2011.
[8] L. Chen, X. Mao, Y. Xue, and L. L. Cheng, “Speech emotion recognition: Features and classification models,” Digit. Signal Process. A Rev. J., vol. 22, no. 6, pp. 1154–1160, 2012.
[9] P. Gangamohan, S. R. Kadiri, and B. Yegnanarayana, “Analysis of emotional speech at subsegmental level,” in Proceedings of the Annual Conference of the International Speech Communication Association, INTERSPEECH, 2013, no. August 2013, pp. 1916–1920.
[10] R. B. Lanjewar, S. Mathurkar, and N. Patel, “Implementation and comparison of speech emotion recognition sys-tem using Gaussian Mixture Model (GMM) and K-Nearest Neighbor (K-NN) techniques,” in Procedia Computer Science, 2015, vol. 49, no. 1, pp. 50–57.
[11] L. D. Vignolo, S. R. M. Prasanna, S. Dandapat, H. L. Rufiner, and D. H. Milone, “Feature optimisation for stress recognition in speech,” Pattern Recognit. Lett., vol. 84, pp. 1–7, 2016.
[12] H. M. Fayek, M. Lech, and L. Cavedon, “Evaluating deep learning architectures for Speech Emotion Recognition,” Neural Networks, vol. 92, pp. 60–68, 2017.
[13] D. Neiberg, K. Elenius, and K. Laskowski, “Emotion recognition in spontaneous speech using GMMs,” in Pro-ceedings of the Annual Conference of the International Speech Communication Association, INTERSPEECH, 2006, vol. 2, pp. 809–812.
[14] R. A. Calvo and S. D’Mello, “Affect detection: An interdisciplinary review of models, methods, and their appli-cations,” IEEE Trans. Affect. Comput., vol. 1, no. 1, pp. 18–37, 2010
[15] K. Wang, N. An, B. N. Li, Y. Zhang, and L. Li, “Speech emotion recognition using Fourier parameters,” IEEE Trans. Affect. Comput., vol. 6, no. 1, pp. 69–75, 2015.
[17] R. McAulay and T. Quatieri, “Speech analysis/synthesis based on a sinusoidal representation,” EEE Trans. Acoust. Speech, Signal Process., vol. 34, no. 4, pp. 744–754, 1986.
[18] M. Mareli and B. Twala, “An adaptive Cuckoo search algorithm for optimisation,” Appl. Comput. Informatics, vol. 14, no. 2, pp. 107–115, 2018.
[19] C. Busso, S. Marioor-yad, S. S. Narayanan, and A. Metallinou, “Iterative feature normalization scheme for automatic emotion detection from speech,” IEEE Trans. Affect. Comput., vol. 4, no. 4, pp. 386–397, 2013. [20] T. ¨Ozseven, “A novel feature selection method for speech emotion recognition,” Appl. Acoust., vol. 146, pp.
320–326, 2019.
[21] Z. Esmaileyan and H. Marvi, “Recognition of emotion in speech using variogram based features,” Malaysian J. Comput. Sci., vol. 27, no. 3, pp. 156–170, 2014.