401
Copyright © 2011-15. Vandana Publications. All Rights Reserved.
Volume-5, Issue-2, April-2015
International Journal of Engineering and Management Research
Page Number: 401-409
Performance of Indian Banking Sector’s in the Post-Liberalization Period
with New Approaches
Sanjay Srivastava
Ansal Technical Campus, Lucknow, INDIA
ABSTRACT
There cannot be a discussion on financial sector in India without the mention of the banking industry. Banking industry is considered as the backbone of Indian economy. After liberalization of the policies by the government, the banks have to be more competitive and performance-oriented
in the new environment. It has become quite difficult for them to survive, perform and succeed in the market. Under these circumstances, there is a need to have a look at the emergence of the Indian banking system right from its early days till now.
I. HISTORY OF INDIAN BANKING
Commercial banking has been one of the oldest businesses in India and the earliest reference of commercial banking in India can be traced in the writings of Manu. The establishment of the General Bank of India in the year 1786marked the development of a structured banking system in India. Later the Bank of Hindustan and Bengal Bank came into existence. The East India Company established three banks. These three banks were amalgamated inthe year 1920 to form the new Imperial Bank of India. The imperial Bank was nationalized and renamed as the State Bank of India with the passing of the Act in 1955. The Swadeshi Movement witnessed the birth of several indigenous banks, such as Punjab National Bank, Bank of Baroda and Canara Bank (ICFAI, 2004). While several committees have gone into the problem of commercial banks in India, the recommendations made by the high level committees on the financial sector reforms, chaired by Mr. M. Narasimham laid the foundation for the banking sector reforms.
These were:
a) Narasimham Committee-l (1991).
b) Narasimham Committee-ll (1998).
II.
PHASES OF INDIAN BANKING
The Indian banking system and its regulations can be better understood when divided into the following two phases:
1. Post-Nationalization
2. Post-Liberalization.
The era of nationalization commenced in 1969 when the country's 14 major commercial banks were nationalized. In continuation of this process, 6 more banks were nationalized in 1980. As a result of nationalization, the aggregate deposits of scheduled commercial banks (SCBS) which stood at Rs.4,669 crore during July 1969 touched Rs.2,33,753 crore by the end of March 1992(Statistical Tables relating to Banks in India- Various Issues, RBI).
The poor performance of the public sector banks was increasingly becoming an area of concern. The continuous decline of profitability and rise of Non-Performing Assets (NPAS) of banks posed a significant threat to the stability of the financial system. Till the early 1990s, the financial sector could be described as a classic example of ‘financial repression’ (the term coined by Mckinnon and Shaw) (Rajput, 2008).
III.
LIBERALIZATION
The Government of India framed its policies in the year 1991-92. Keeping inView the benefits of liberalization, it was expected that in the process of opening up its economy to the outside world, increased competition could turn the banks more efficient, bring about improvement and ultimately benefits the customers (ICFAI, 2004).
402
Copyright © 2011-15. Vandana Publications. All Rights Reserved.
a) Greater emphasis on directed credit programmes;
b) Regulated interest rate structure;
c) Excessive regulations on organization‘s structure
and managerial resources; d) Lack of focus on profitability;
e) Lack of competition;
f) Lack of proper Accounting and Risk Management
System;
g) Lack of operational transparency and
h) Excessive support from government.
The reforms were initiated with an aim to bring about a paradigm shift in the banking industry. Hence, banking returns were made an integral part of the liberalization process. The financial sector reformation started in 1991 had provided the necessary platform for the banking sector to operate on the basis of operational flexibility and functional autonomy, enhancing productivity, efficiency and profitability.
IV.
IMPACT OF LIBERALIZATION ON
THE PERFORMANCE OF INDIAN
BANKING SECTOR
Banking sector plays an important role in the economic development of a country. The banking sector reforms in India were started as a follow up measure of economic liberalization and financial sector reforms in the country.
The banking sector being the life line of the economy was treated with utmost importance in the financial sector reforms. The reforms were aimed at to make the Indian banking industry more competitive, versatile, efficient, and productive, to follow international accounting standards and to free from the government’s control. The reforms in the banking industry started in the early1990s have been continued till now (Bansal, 2004). The Indian banking registered tremendous growth in the post-liberalization era. Since the beginning of 1991, there has been a sea change in the rule, regulation, organization, and scope and activity level of Indian financial sector. The Indian banking industry has witnessed a rapid growth after economic forms. It has shifted from regulated to de-regulated market economy and defined a new role for the banks. All these reforms have changed the Indian banking market from ‘Sellers Market’ to ‘Buyers Market’.
The Narasimham Committee, 1991 had recommended several reforms in banking sector with the change wind of financial sector reforms (Sekhar,2007).
Some of the important financial liberalization measures are;
a) Reduction in pre-emption of funds through
reduction of CRR and SLR.
b) Introduction of prudential provisioning and
Capital Adequacy norms.
c) Phasing out the directed credit programs.
d) Deregulation of interest rates.
e) Infusion of competition (Entry of Private Sector
Banks).
f) Imparting transparency.
g) Introduction of universal banking.
h) Mergers and Acquisitions.
i) Development of technology.
j) Emphasis on corporate governance.
The winds of change gained momentum in the last few years, such as globalization of Indian economy and opening up of financial services under WTO. It is expected
that the banking sector will undergo mergers and acquisitions (M&A), consolidation, globalization of operations, development of new technology, best corporate
governance practices and universalization(Sekhar, 2007). The main objective of this paper is to make a simple assessment of the impact of the reforms of the Indian banking sector. It has been more than 18years of the start of the economic reforms in India and financial sector reforms were one of the important parts of the process.
A comparative analysis of various bank groups with respect to different variables has been taken. Important indicators of scheduled commercial banks (SCBS) are analyzed from 1969 to 2008.The number of commercial banks increased to 174 in March 2008 as compared to 89 in June 1969. India had just 89 commercial banks, both scheduled and nonscheduled at the time of nationalization of banks. Over a period of time, their number increased to 300 as on March 2001. After that the number gradually came down to 222 and then to 174 as on March 2006 and March 2008 respectively. The decline in number of banks is due to mergers and acquisitions taking place in the banking industry.
The Indian banking industry had made sufficient progress during the reforms period. The progress of the industry can be judged in terms of growth of Credit and Deposits, Branch expansion, Advances to Priority Sector, etc.
V.
AGGREGATE DEPOSITS AND
CREDIT OF SCHEDULED COMMERCIAL
BANKS
The demand deposits of scheduled commercial banks(SCBs) had increased from Rs. 2,104 crore in 1969 to Rs. 524,310 crore as on March 2008. However, time deposits of banks increased to Rs. 26,72,630crore from Rs. 2,542 crores during the same period. The growth of time deposits in absolute terms has been more than demand deposits. The high growth of time deposits over demand deposits is mainly due to higher interest rates being offered by the banks on such deposits as well as availability of tax benefits to certain deposit schemes. .
403
Copyright © 2011-15. Vandana Publications. All Rights Reserved.
while other deposits such as demand and savings depositsshow no sensitivities to interest rate movement. The interest rate offered by the scheduled commercial banks (SCBs) on term deposits on an average was 6 to 9 per cent which is having a maturity period of three tofive years looking at the trend of interest rate of last four to five years. The private sector banks are also offering more or less the same rate of interest as offered by public sector banks (PSBs). As a result of this, there is a growth inaggregate deposits of scheduled commercial banks from Rs. 4,646 crore in1969 to Rs. 9,89,141 crore in 2001, and increased to Rs. 31,96,940 crore in March 2008. Along with the increase in aggregate deposits of SCBs, the credit of the banks has also increased from Rs. 3,599 crores in 1969 to Rs.529271 crore in 2001 and increased to Rs. 23,61,913 crore in March 2008.The growth of credit has been largely due to the robust growth of industrial sectors and the government decision to increase credit to the agricultural sector which led to rapid increase in bank credit.
The per capita deposits of SCBs increased from simply Rs. 88 crore in 1969to Rs. 9,770 crore in 2001 and to Rs. 28,610 crore in March 2008. Moreover, deposits of SCBs as percentage of Gross National Product (GNP) at factor cost (at current prices) has increased from 15.5 per cent in June 1969 to 74.7per cent as on March 2008.
VI.
PRIORITY SECTOR LENDING
The flow of credit to priority sectors increased to Rs. 7,138,686 crore in March2008 as compared to Rs. 1, 82255 crore in March 2001 and Just Rs. 504crore in June 1969. Credit flow to the priority sector is mainly to Agriculture, Small scale industries, Housing and service sector. The share of priority sector advances to total credit has increased to 32.9 per cent as on March2008 as compared to 14.00 per cent in June1969. The increase shows more than double the increase in priority sector advances to total advances over 40years. But it remains same during the beginning of post-reform period to till date.
VII.
CREDIT-DEPOSIT RATIO
Credit-Deposit Ratio (CD ratio) of all scheduled commercial banks over aperiod of time has increased from 53.5 per cent in March 2001 to 74.6 percent in March 2008. The increase in demand for commercial credit and also food and non-food credit has led to an increase in total credit of scheduled commercial banks (SCBs) over the last few decades and as a result of this, the credit-deposit ratio continued to increase. But it started declining after2007.
VIII. CASH-DEPOSIT RATIO
The cash-deposit ratio during the period of nationalization of banks in 1969was 8.2 per cent and the same has declined to 7.2 per cent as on March2007. The declining trend of cash-deposit ratio reveals efficient management of cash flow of SCBs during the period concerned. But during 2007-08, the cash-deposit ratio increased to 9.7 per cent as compared to 7.2 percent during the previous year.
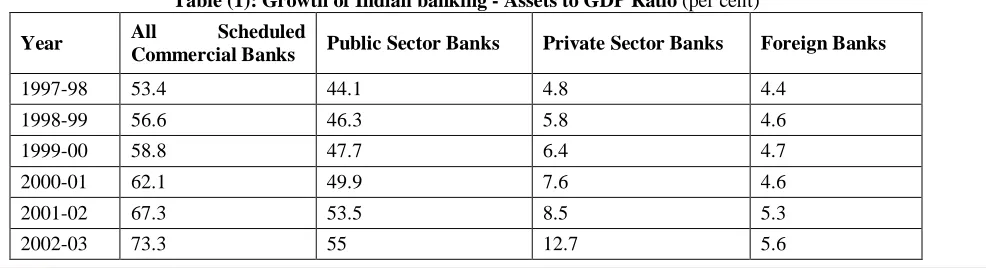
The size of the bank assets of an economy is a measure of financial maturity. The size of the bank assets in relation to GDP has important implications for financial development of any economy. In India, the ratio of bank assets to GDP of all scheduled commercial banks was 53.4 per cent in 1997-98 and it increased to 103.3 per cent in 2006-07. Out of this, public sector banks (PSBs) accounted for nearly 80 per cent assets as a percentage to GDP. In the case of public sector banks (PSBs), the ratio of bank assets to GDP increased from 44.1 per cent in 1997-98 to 79.6 per cent in 2006-07. The share of private sector banks in the ratio of bank assets to GDP rose to 17.6 per cent in 2007 from merely 4.8 per cent in 1998. After analyzing the scheduled commercial banks at a glance, other important indicators such as taking credit, aggregate deposits, total investments and investments in government securities as a percentage to GDP for the period from 1950-51 to 2005-O6 for scheduled commercial banks (SCBs) have been analyzed.
Table (1): Growth of Indian banking - Assets to GDP Ratio (per cent)
Year All Scheduled
Commercial Banks Public Sector Banks Private Sector Banks Foreign Banks
1997-98 53.4 44.1 4.8 4.4
1998-99 56.6 46.3 5.8 4.6
1999-00 58.8 47.7 6.4 4.7
2000-01 62.1 49.9 7.6 4.6
2001-02 67.3 53.5 8.5 5.3
404
Copyright © 2011-15. Vandana Publications. All Rights Reserved.
2003-04 75.9 56.7 13.1 6
2004-05 77.4 59.7 14.4 5.3
2005-06 79 77.1 11.5 5.4
2006-07 103.3 79.6 17.6 6.2
Source: Report on trend and progress of banking in India, various issues, RBI
The increase in percentage share of aggregate deposits to GDP has been more than credit percentage to GDP of scheduled commercial banks. Thus, Credit as well as aggregate deposits as percentage of GDP over a period of 50 years has shown an increasing trend. The credit as a percentage of GDP increased to 42.7 per cent in 2005-O6 from a meager 5.5per cent in 1950-51 and the aggregate deposits increased to 59.7 per cent in2005-06 from 8.9 per cent in 1950-51. Similarly, total investment and investment in Government securities increased to 20.3 per cent and 19.8 per cent respectively in 2005-06 over 3.00 percent in 1970- 71. At the end of March 2006, the percentage of bank credit to GDP ratio for India was as low as 50 per cent reflecting tremendous 'untapped'potential in the sector (for instance, the Credit-GDP ratio for East Asian and pacific nations is around 105 per cent). So, banks have started taking a new mantra of ‘Financial inclusion’ (Kalita, 2004).
The impact of reforms (Financial liberalization) on the performance of Indian banking sector was measured/analyzed on the basis of different indicators of performance. To make a comparative analysis of various indicators of performance of different banks from 1997-98 to 2007-08, the banks were divided into five groups, i.e. All Scheduled Commercial Banks, Public Sector Banks, Old Private Sector Banks, New Generation Private Sector Banks, and Foreign Banks.
To measure the impact of liberalization, privatization and globalization on the performance of Indian banking sector, the following indicators were used to analyze the impact of various reforms.
a) Profitability Indicators. b) Productivity Indicators. c) Assets Quality Indicators.
d) Prudential norms like CRR, SLR, structure of
Interest rates, priority, sector lending indicatory, competition and institutional features etc.
e) Technology Development Indicators.
IX.
PROFITABILITY INDICATORS
Profit is the very reason for the continued existence of every commercial organization. The rate of profitability and volume of profits are, therefore, rightly considered as indicators of efficiency in the deployment of resources of the banks.
Profitability indicates earning capacity of the banks. It highlights the managerial competency of the
banks. It also portrays work culture, operating efficiency and overall performance of the banks.
Various structural factors include geographical spread of bank branches, decentralization in management and structural changes in deposits and advances.
Banking structure and profitability structure of banking systems across countries have a bearing on the profitability of banks. The profitability of banks is affected by one way or the other by these factors. After liberalization, profitability has regained its lost importance. Now banks are being directed to achieve the profitability targets. Since all the banks in the country function under similar environment, the low performance of any bank can be attributed to a large extent to their managerial inefficiencies and structural deficiency(Bansal, 2004).
The impact of reforms on the profitability of banking sector has been studied on the basis of various variables of profitability like income, interest income,non-interest income, gross profit, net profit, spread, expenditure, interest expended, operating expenses, cost to income as percentage of total asset of five bank groups from 1997-98 to 2007-08.
The income to asset ratio of all scheduled commercial banks (SCBs) shows adeclining trend. The income as percentage of total assets of scheduled commercial banks (SCBs) was 10.79 per cent in March 1998 which declined to 7.92 per cent at the end of March 2006. But the ratio improved marginally to 8.53 per cent at the end of March 2008.
Further bank group-wise analysis shows that the ratio of income to total assets has shown a declining trend for the period 1997-98 to 2005-06. The reason for such trend of total income as a percentage of total assets was the declining of interest as well as non-interest income as a percentage of the total assets. However, upward trend has been observed in the remaining two to three years (2005-06 to 2007-08) for majority of the bank groups.
The income to asset ratio of all the five bank groups increased during the year2007-08 as compared with the income to asset ratio during the last three years. During the period of study, it showed a declining trend but after 2004-05, it showed an upward trend for all the bank groups. This was due to boom in the Indian economy.
405
Copyright © 2011-15. Vandana Publications. All Rights Reserved.
Further, the bank group-wise analysis of the tableshows that the ratio of interest income to total assets has shown a declining trend for the period1997-98 to 2004-05. The reason for such a declining trend is the deregulation of interest rates which forced the banks to reduce their interest rates to be in the market.
X.
PRODUCTIVITY INDICATORS
Among various productivity indicators, employee productivity indicators like business per employee and profit per employee are most commonly used. In addition, business per branch and profit per branch are also used to judge the branch level productivity.
The business per employee of scheduled commercial banks increased over three-fold in real terms from Rs. 66 lakh in 1996-97 to Rs. 217 lakh in 2005-06 exhibiting an annual compound growth rate of nearly 10 per cent. At the same time, the profit per employee increased more than four-fold, from Rs40000 to Rs.15000O over the same period.
Branch productivity also showed a similar trend. Business per branch increased more than 2.5 times during study. Overall, the figures suggest distinctive productivity improvements in the banking sector over the reform period.
Such improvements could be driven by two factors: Technological improvements, which expand the range of products possibilities, and acatching up effect, as peer pressure amongst banks compels them to raise the productivity level. In the context of gradual de-regulations of financial sector, several factors could have been at work: a significant shift of the best practice frontier, driven by a combination of technological advances, financial innovation and different strategies pursued by banks suited to their business philosophy and risk-return profile, changing composition of banks input output, and reduction in total cost due to improvement in overall efficiency [5].While it is difficult to pinpoint the relative mix of these factors in raising productivity, the bottom line is clear.
Indian banks witnessed significant productivity
improvements in post-reforms period.
XI.
ASSETS QUALITY INDICATORS
The measure of Non-Performing Assets (NPAS) explains the efficiency inallocation of resources made by the banks to productive sectors. The problem of NPAs arises either due to bad management by banks or due to change in business cycle. The sharp rise in credit growth continued to be accompanied by significant improvement in asset quality. Among the several channels of recovery available to the banks dealing with Non-Performing Loans (NPLs),the Debt Recovery Tribunal (DRT) [6] and the SARFAESI Act have been most effective in terms of amount recovered.
The measure of Non-Performing Assets (NPAs) [7] explains the efficiency in allocation of resources made by the banks to productive sectors. The problem of NPAs arises either due to bad management by the banks or due to change in business cycle. The net NPAs as Percentages of net advances has significantly reduced across all groups of banks from 1997-98 to 2007-08. The sharp rise in credit growth continued to be accompanied by significant improvement in assets quality. The gross NPAs as percentage of total assets have significantly reduced across all the bank groups from 1997-98 to 2007-08. The scheduled commercial banks (SCBs), public sector banks (PSBs) [8] and old private sector banks had around 6-7 per cent of NPAs during 1997-98 which declined to around 1.0-1.50 per cent in the year2007-08. In the case of new private sector and foreign banks, the percentage declined to 1.07 and 0.82 percent respectively during the year 2006-07.However, in the case of new private sector banks, it started increasing to 1.40per cent in 2007-08 as compared to previous period of 2004-05, 2005-06 and2006-07.
The decline of NPAs implies that the asset quality of banks registered a significant improvement with rapid increase in quantum of credit to the commercial sector. The robust industrial performance along with recovery shows a significant reduction in the level of NPAs. There has been a distinctimprovement in recovery climate in recent years facilitated by strong macroeconomic performance and institutional measures adopted by the Reserve Bank/Government (Mohan, 2005).
Among the several options available to the banks particularly after the passing of SARFAESI Act, 2002; for dealing with bad loans (Non-performing Loans) and the improved industrial climate in the country helped in recovering a significant amount of NPAs during the recent years. The net NPAs as a percentage of total assets have significantly declined across all bank groups from 1997-98 to 2007-08.
XII.
PRUDENTIAL NORMS
406
Copyright © 2011-15. Vandana Publications. All Rights Reserved.
The prudential regulatory framework for bankshas been designed to addressthe following issues:
a) Market Structure,
b) Capital Adequacy Norms,
c) Accounting and Provision for NPAs,
d) Supervision ofthe Banks, and
e) Privatization of Banks
One of the most important components of prudential regulation of banks is the maintenance of minimum capital ratios. The Basel [1] Committee on banking regulation and supervisory practices, known as Basel-l recommended adoption of common capital adequacy standards known as cook-ratio. The cook ratio is a risk weighted approach to capital adequacy so that institutions with a higher risk profile maintain higher levels of capital. For the purpose of calculating capital, Bank of International Settlement (BIS) [2], IIF [3]classified capital into two broad categories: Tier-I capital constituting share capital and disclosed reserves and Tier-ll capital consisting of undisclosed and latentreserves, general provision, and hybrid capital and subordinated debt. The Capital to Risk weighted Asset Ratio (CRAR) suggested by BIS in 1992 was 8per cent i.e. Tier-l and Tier-ll capital should be equal to minimum of 12percent of the total assets of the bank (Kalita, 2004). The Narasimham Committee 1991 has recommended that all banks in India must reach the figure in a phased manner latest by March 1996. In 1995, 13of the 27 public sector banks had attained the 8 per cent capital to risk assets ratio, 11 banks had reached 4 percent and the remaining less than 4 per cent This move to achieve capital norms has been greatly boosted by the infusion of fresh capital in several public sector banks by the government in 1993- 94and 1994-95 budgets by the amount of Rs. 57000 million and Rs. 56000million respectively, However, to meet the international standards, this has been raised to 9 per cent with effect from March 31, 2000 and 12 per Cent with effect from March 31, 2008 [5].
The Overall capita position of commercial sector banks had witnessed a mark improvement during the reform period. At the end of March 2008, all the commercial banks in India maintained CRAR at or above 12 percent. The corresponding figure for 1995-96 was 75 out of 92 banks.
CRAR of scheduled commercial banks (SCBs) declined on account of high growth in advances, increase in risk weights for certain sensitive sector and also application of capital charge for market risk in investments. Foreign banks in India have had higher capital adequacy ratio (higher than industry average) during the period 2001-06, than other four groups of banks. During 2006-07, the overall CRAR of all scheduled commercial banks (SCBS) remained at previous year's level of 12.3 percent. It means that the increase in capital kept pace with sharp increase in risk-weighted assets. The increase in risk-weighted asset was mainly due to the rapid growth of credit.
Among the bank groups, the CRAR of public sector banks (PSBs) and old private sector banks improved, while that of new private sector banks and foreign banks declined during the period 2006-07. The CRAR of new private sector banks which had improved during the previous year, declined below the industry average at end of March 2007. The CRAR of foreign banks, which usually remained much above the other bank groups declined from13.00 per cent at end March 2006 to 12.4 per cent at end March 2007 to converge with industry average [10].
The CRAR of both new private sector banks and foreign banks declined onaccount of high groups of risk-weighted assets as they have relatively largeexposure to the sensitive sector to which higher risk weights are applied. Butduring the year ended 2007-08, the CRAR improved across all the banks crossing industry average of 12.00 per cent and as well as in tune with theBasel-ll recommendations by the Bank of International Settlement (BIS).
XIII. INTEREST RATE DEREGULATION
The main aim of the interest rate reforms was to simplify the comples and the tiered interest rate structure that India had during pre-1990s. different interest rates based upon size, purpose, maturity of loan, group, sector, region, etc. were rationalized to converge at a single lending rate called as prime lending rate over a period of five years. The aim was to provide more options and flexibility to banks for their assets liability management operation and shift towards indirect monetary control.
Along with the interest rate deregulation, quantitative restrictions were initiated simultaneously. The amount of money available with the banks for credit was very small. The reserve requirement was progressively down in time, the statutory liquidity ratio (SLR), SFS [4], was brought down from 38.5 per cent in 1990 to25.0 per cent in 2001 [9]. The cash reserve ratio (CRR) was also steadily brought down to its minimum level during the period of study.
407
Copyright © 2011-15. Vandana Publications. All Rights Reserved.
revived by the RBI to serve as a reference rate for thebanking sector. In India interest rate deregulation has contributed a downward movement of domestic interest rates and narrowing of the domestic foreign rate differential(Kohli, 2005).
XIV. DIRECTED CREDIT
Direct credit policies have been an important part of Indian financial sector reforms. Under the directed credit policy commercial banks are required to provide 40 percent of their commercial loans to priority sectors which include agriculture, small scale industries and other priority sector. The Narasimham committee had recommended reduction of direct credit to 10 per cent from 40per cent. But the policy of 40 per cent of loans to priority sector has not been abolished by the government. However, the definition of priority sector activities has been with the new inclusion and reclassification [5].
The committee on banking reforms has suggested inclusion of activities related to food processing, dairying and poultry in the priority sector list. Thiswill increase the list of activities under the priority sector credit and also improve the quality of the portfolio. The priority sector should be considered as a percentage of the total assets of the banking system and not as percentage of commercial advances as at present. The issue of priority sector lending, an important concern against privatization, is no longer that crucial, since in 2003 the Share of Credit of private sector banks going to the priority sector had surpassed that of public sector banks as shown in Table [5].
Despite a decline, direct lending to the disadvantaged segments under priority sector advances remained high during the reform period (Mohan, 2004). The decline in priority sector lending since the initiation of reforms, in fact, reflects greater flexibility provided to banks to meet such targets. At present, if a bank fails to fulfill the target for priority sector lending, it can investthe shortfall amount in RBI securities dealing with the flow of funds towards agriculture and small scale industries but it is still desirable that banks should adhere to the priority sector lending targets (Kalita, 2004).
XV.
TECHNOLOGICAL
DEVELOPMENT IN BANKS
Technological development and the use of information technology (IT) havetransformed the functioning of the banking sector in the country. Banks in India have used IT not only to improve their own internal processes but also to increase facilities and services to the customer. Furthermore, the large scale increase in the number of transactions handled by the banks has enhanced the dependence of banking sector on modern technologies including the use of computers. Apart from reducing
transactions cost, the use of technology has also provided new avenues to banks to expand their outreach, especially in the remote and rural areas. Several banks have been positioning themselves as a one stop shop financial service provider with a fairly exhaustive range of products.
(i) Computerization in Banks
The process of computerization, which marked the starting point of all technological initiatives, is reaching near completion for most of banks.
Public sector banks continued to provide adequate resources for computerization and development of communication networks. The cumulative amount spent from September 1999 to March 2008 aggregatedRs.15,016 crore (Report on Trend and Progress of Banking in India, 2007-08). A major development during 2007-08 was a significant increase in coverageof the number of branches providing core banking solution (CBS). The percentage of branches to total bank branches under CBS increased from11.00 per cent in 2004-05 to67.00 per cent in 2007-08. At the end of March2008, the number of fully computerized branches reached to 93.6 per cent asagainst 71 per cent at the end of March 2005.
(ii) Computerization of Branches in Public Sector Banks
The total number of nodes/PC in the computerized branches (fully and partially), increased by 61437 during 2007-08 representing an increase of 11.1 percent. The public sector banks recorded significant progress after fully computerizing their branches. Of the 27 public sector banks, only 9 banks were fully computerized in the year 2004-05, while 6banks could computerize their branches between 70 and 100 percent. However, the number of banks having their branches fully computerized increased to 20 in 2007-08 as against 9 banks in 2004-05. Up to March 2008,only 5 banks computerized their branches between 70 and 100. In a nut shell, most of public sector banks (PSBS) have fully computerized their branches at present. Only two banks, viz. Punjab and Sind Bank and UCO Bank are yet to computerize more than half of their branches (Report on Trend and Progress of Banking in India, 2007-08).
(i) (iii) Branches and ATMs of Banks
To provide their customers greater flexibility and convenience as wall to reduce servicing cost, banks have been investing to branches and introduce new delivery channels, such as ATMs, phone banking, internet banking and mobile banking etc.
408
Copyright © 2011-15. Vandana Publications. All Rights Reserved.
banks and foreign banks which account for 27.51 per centand 21.13 per cent respectively at the end of March 2005. During 2007-08, the total number of ATMs installed by the banks increasedby28.4 per cent to 34,789 representing 56.9 per cent of total branches at the end of March 2008. While, the ATMs installed by foreign banks and new private sector banks were nearly four and three times of their respective branches respectively, The ATMs to branch ratio was much lower for public sector banks (41 2 per cent) and for old private sector banks (47.2 per Cent). While the ATMs to branch ratio were much higher in the case of new private sector banks (279.9per cent) and foreign banks (334 per Cen) as on 31st
Although cash continue to be used heavily in retail transactions in India, the use of cheque and several other payment instruments such as credit cards, debit cards and smart cards, on the whole, has been increasing in the recent years. The use of payment cards, both in volume and value terms, were more than doubled in 2004-05.
March 2008 [11].
(iv) Real Time Gross Settlement and other Electronic Transactions
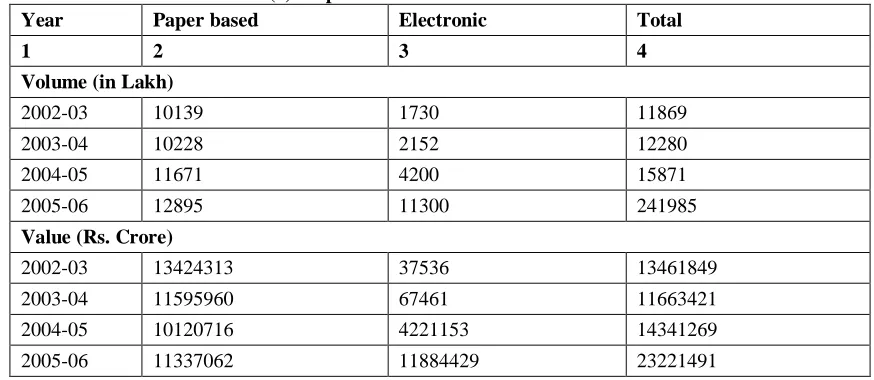
As a result of sharp increase in RTGS and other electronic transactions, the proportion of electronic transactions both in volume and value has increased sharply.
Electronic payments are cheaper as compared to paper-based instruments. They can also be carried out faster in comparison with paper based transactions. The increased use of electronic payments has thus, increased the efficiency of the payment system.
Table (2): Paper based versus electronic transactions
Year Paper based Electronic Total
1 2 3 4
Volume (in Lakh)
2002-03 10139 1730 11869
2003-04 10228 2152 12280
2004-05 11671 4200 15871
2005-06 12895 11300 241985
Value (Rs. Crore)
2002-03 13424313 37536 13461849
2003-04 11595960 67461 11663421
2004-05 10120716 4221153 14341269
2005-06 11337062 11884429 23221491
Source: Report on trend and progress of banking in India, various issues, RBI
The Table shows a comparison between paper-based and electronic transactions. The RTGS was operationalized on March 26, 2004. Its usage fort ransfer of funds especially for large values and for systematically important purpose has increased since then. The large value payment systems include the Real Times Gross Settlement (RTGS), government securities clearing andforex clearing. The RTGS system has been in operation for more than four year since its operationalization. As at end- August 2009, 107 participants (96banks, 8 primary dealers, the Reserve Bank and Deposits Insurance Credit and Guarantee Corporation and Clearing Corporation of India Limited) are members of RTGS system. The reach and utilization of the RTGS is on the increase which could be attributed to the bank/branch network coverage under the system (Report on Trend and Progress of Banking in India, 2008-09).
At present, 51095 branches provide the RTGS facility at more than 10000 centers leading to increased
usage of this mode of fund transfer. The daily average volume of transactions is about 38000 for about Rs.1,15,600 crore of which 30,900 transactions for about Rs. 69,123 crore pertain to customer transactions as at end September 2008 (Report on Trend and Progress of Banking in India, 2007-08).
(v) Retail Electronic Payment Methods
409
Copyright © 2011-15. Vandana Publications. All Rights Reserved.
(EMI) payments of loans are being increasingly preferred.ECS is now available at70 centers. The volume of electronic transactions was increased by 41.1 per cent in 2007-08 as compared to 32.9 per cent in the previous year. Transactions in terms of value increased by almost three and a half times during 2007-08 mainly on account of large increase in transactions through ECS credit.
The use of ECS (credit ) and ECS (debit), in particular, increased sharply during 2007-08, while the ECS (credit) volumes [12] increased by 13.5per cent in2007-08, value increased by more than eight times. The substantial increase was due to the use of ECS for refund of initial public offering (IPOs). The volume under ECS (Debit), which is mostly used for payment of utility bills and regular premium, increased by 69.0 per cent in 2007-08 and by 92.3 per cent in value.
It has been observed that the banking sector in India has provided a mixed response to the reforms initiated by RBI and the Govt. of India since 1991. The Indian banking system is growing in a robust manner. The sector has responded positively in the field of profitability, productivity, assets quality i.e. reduction of NPAs, enhancing the role of market forces, norms of prudential regulations of accounting, income recognition, provisioning and exposure, introduction of CAMELS supervisory rating system, and the up gradation of technology. The financial sector reforms have brought the Indian banking sector has still a long way to go to catch up with their counterparts.
REFERENCE
[1] Basel Committee on Banking Supervision, 2008. Liquidity Risk: Management and supervisory challenges. Bank for International Settlement.
[2] Bank for International Settlements. 2007. Overview:
credit retrenchment triggers liquidity squeeze. BIS
Quarterly Review. September 2007, 1-16.
[3] Institute of International Finance, 2008. Final report on IIF Committee on market based practices: Principles of conduct and best practice recommendations.
[4] Financial Stability Forum, 2008. Report of the financial stability forum on enhancing market and institutional resilience. Retrieved on Jun2 2008.
[5] Di Mortino D., Duco J.V.; 2007. The rise and fall of
subprime mortgages. Federal Reserve Bank of Dallas
Economic Letter. 2 (11) 1-20.
[6] Borio C.; 2008. The financial turmoil of 2007 : a preliminary assessment and some policy consideration. BIS
Working Papers, No 251, March 2008.
[7] Getter D.E, Jackling, et al., 2007. Financial crisis? The liquidity control of August 2007. CRS report of congress, Wasington D.C.
[8] Krinsman A.N., 2007. Subprime mortgage meltdown:
How did it happen and how will it end? The Journal of
Structured Finance, 13 (2) 10-30.
[9] Blommestein H.J., 2008. A prime on the ongoing credit crisis. Retrieved on March 20, 2009.
[10] Noyer C., 2008. Possible ways of improving the process of rating. Retrieved on April 13, 2009.
[11] Aschcraft A.B. and Schermamm T., 2007. Understanding the securitization of subprime mortgage
credit. Federal Reserve Bank of New York, Working Paper
Series No. 318.
[12] Kregel J., 2008. Minsky’s cushions of safety: Systemic risk and the crisis in the US subprime mortgage
market. The levy Economics Institute of Bard College,