ISSN-L: 2501 - 1235 Available on-line at: www.oapub.org/edu
doi: 10.5281/zenodo.1295687 Volume 4 │ Issue 8 │ 2018
EXAMINING THE DEPRESSION LEVELS OF
WATER SPORTS PLAYERS IN TERMS OF DIFFERENT
SOCIO-DEMOGRAPHIC VARIABLES
Aylin Zekioglui
Manisa Celal Bayar University, Sports Science Faculty, Manisa, Turkey
Abstract:
In this study, the purpose is to examine the depression levels of regular water sports players in terms of different variables. The sampling of the study was formed by using the Convenient Sampling Method. A total of 92 people whose ages varied between 17 and 28 participated in the study; and 24 of them were women (26.1%), and 68 were men (73.9%). Sixty-one of the players (66.3%) dealt with water polo, 21 dealt with (22.8%) swimming, 10 dealt with (10.9%) underwater rugby. The participants answered the questions in the Beck Depression Scale, which consisted of 21 questions. According to the results of the reliability analysis, which was made for Beck Depression Scale, the reliability of the scale was determined as 0.94, which is an extremely high value. In the present study, numbers and percentiles of the independent variables, descriptive statistics of the dependent variables (Beck Scale Total Score), reliability (Alpha) and Item Analysis for the Beck Scale, One-Way Variance Analysis (ANOVA) between independent and dependent variables; and when differences were detected between the groups in the variance analysis, the Tukey-b Multiple Comparisons Test was applied to make comparisons between the groups. There were statistically significant differences between the total scores of the three Beck Scale groups, which were formed according to the sports branches the players dealt with; F(2,89)=3.646; p<0.05. According to the result of the Tukey-b Multiple Comparison Test, which was applied to determine from which group the statistically significant difference stemmed, it seemed that the group that dealt with swimming was more depressive than the group that dealt with water polo and underwater rugby; and the group that dealt with water polo seemed more depressive than the group that dealt with underwater rugby. In other words, the Beck Depression Scale scores of these groups were determined to be higher than those of the other groups. The results obtained in the analyses were discussed in line with the literature data.
Keywords: depression, swimming, underwater rugby, water polo
1. Introduction
Depression is defined as the state that emerges with the loss of pleasure in ordinary activities, sadness, feeling of guilt and insignificance, inappetence, insomnia and loss of sexual desire (Davidson and Neale, 1994). Depression is a normal reaction to many situations that create stress in life. Many times, it is possible that some conditions such as failure at school, sports or at work; losing someone loved; and diseases or old age, which consumes the resources of the individual, may be considered as depression (Atkinson et al., 1990). According to the Cognitive Model, inherited, environmental and biological factors play efficient roles in the formation of depression. However, aside from the factor that starts depression, the structure and viewpoint of the individual play very important roles in the continuance of the mood (Gonenir Erbay & Kartalcı, 2012).
However, although doing sports is beneficial as a therapeutic method to eliminate boredom and depression, especially the depression in competition players where stress and tension are extreme may cause injuries and decrease their concentrations; and such players may have depression following their injuries (Kokrek et al., 1996).
The positive effects of sports and physical activity on the health of the body are known as well as their positive effects on spiritual health. When the literature was reviewed, it was observed that the studies conducted in this field are mostly on puberty period. In recent years, studies conducted on teenagers have reported that physical activities have positive effects on self-perception, peer-to-peer relations, and academic achievement (Van de Loo et al., 1995; Faigenbaum, 2000). It has been reported that physical activity in puberty period is beneficial for physical health of young individuals both in present time and in further years in terms of feeling healthier and more fit (Meffulli, 1992; Açıkada, 2004). It was determined that there is a reversely-proportional relation between sport and physical activity and stress, anxiety and depression levels; and there is a directly-proportional relation between self-esteem and self-perception (Berger et al., 1983).
In sports, the already-anxious situation before a competition can “push” us to depression. Especially relieving the tense muscles from head to foot and relaxing by changing breathing can be a method (Syer et al., 1998).
Many athletes become concerned depending on the level of arousal before competitions start. As it is already known, excessive anxiety reduces concentration; and meanwhile, increases disability risks, which is the cause of the formation of negative thoughts. This situation appears as a decrease in continuity (durability) or a continuous loss in efficiency levels (Suinn, 1986). Studies conducted so far showed that there are certain differences between those who do team sports and those who do individual sports in terms of personality traits. Those who do individual sports are less anxious, more self-sufficient and more independent than those who deal with team sports (Cratty, 1973). It was determined that those who deal with individual sports are more self-confident, self-centered, and have high reactive features in terms of developing their abilities on their own; and they are more nervous and angrier, and more spontaneous (James et al., 1983). In a study conducted in the United States, it was determined that 50% of the visits of general practitioners were stress-related. In this respect, one of the non-traditional programs is the short-term or chronic exercise practices. The results of previous studies show that exercise is associated with improvements in anxiety and depression levels (Artal, 1988).
Additionally, it was also reported in previous studies that participation in long-term exercise programs increased self-esteem (Ozturk, 1997). One of the negative consequences of exercise is Exhaustion Syndrome. In this respect, as trainings increase, mood disorders become more severe. Exhaustion Syndrome occurs due to the disturbance of the balance between training and relaxation. It reveals itself with not proceeding in trainings and poor performance in competitions. The known treatment of Exhaustion Syndrome is “resting” (Artal, 1988).
Athletes who have depression are those who show psychological breakdown. Depression occurs with psychomotor manifestations in such athletes, and they mention anxieties and fears they cannot explain. The worry and suspicion in athletes may involve being not able to show a good contest, losing the competition, and therefore, a possible penalty may be involved as well. Such athletes must be given fewer duties, and relevant people should talk to them and tell them that losing or winning competitions is natural. For this, it is necessary to define the personality traits of athletes beforehand. Shy and skeptic athletes consider everything and everybody with suspicion, and prefer to live alone away from others (Başer, 1998).
2. Material and Method
2.1 Participants
participants stated that they played water polo, 21 (22.8%) swimming, and 10 (10.9%) underwater rugby. A total of 92 athletes were included in the present study as the sampling. The number and percentile distributions of the socio-demographic variables of the participants i.e. the questions in the questionnaire form, which was formed to examine the effects of water sports on depression levels of the athletes, are shown in relevant parts.
2.2 Method
Beck Depression Scale: It was applied to determine the levels and severity of the depressive symptoms of the students. It includes a total of 21 self-evaluation statements, and each item is given points between 0 and 3. The validity and reliability study of the scale was conducted (Hisli, 1989). In this study, it was determined that 17 cut-off points were adequate in determining the clinical depression.
2.3. Application
The application was made in Izmir and Istanbul with completely individual applications. The individuals were asked whether they wanted to participate in the scientific study voluntarily or not, and those who wanted to participate voluntarily were given the scale and the questionnaire form to answer. The participant who wanted to abandon the study was allowed to quit without showing any reasons. The application for one single individual lasted between 15 and 20 minutes.
2.4. The Analysis of the Data
In the study, the numbers and percentile distributions of the independent variables, the descriptive statistics of the dependent variable (Beck Scale Total Score), reliability (alpha) for Beck Scale and item analysis was made; the One-Way Variance Analysis (ANOVA) was applied between the independent variables and the dependent variables; the Tukey-b Multiple Comparison test was applied to make comparisons between the groups for whom significant differences were detected in the variance analysis.
3. Results
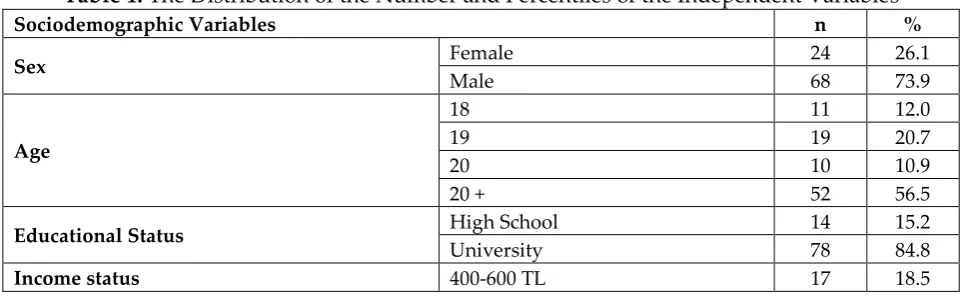
Table 1: The Distribution of the Number and Percentiles of the Independent Variables
Sociodemographic Variables n %
Sex Female 24 26.1
Male 68 73.9
Age
18 11 12.0
19 19 20.7
20 10 10.9
20 + 52 56.5
Educational Status High School 14 15.2
University 78 84.8
600-800 TL 40 43.5
800-1000 TL 21 22.8
1000 TL + 14 15.2
Sport Branch
Water Polo 61 66.3
Swimming 21 22.8
Underwater Rugby 10 10.9
Duration Engaged in Sport
3-5 19 20.7
5-7 9 9.8
7-9 21 22.8
9 + 43 46.7
Total 92 100.0
The number and percentile distributions of the 7 independent variables included in the questionnaire of the study are given in the table above.
Table 2: The Definitive Statistics of the Beck Scale Total Scores
Variable N Minimum Value Maximum Value Median Standard Deviation Beck Depression Scale
Total Score
92 14.00 84.00 34.3370 12.73507
The descriptive statistics of Beck Scale Total scores are given above. According to the results, the mean of the scale was 34.337±12.73507.
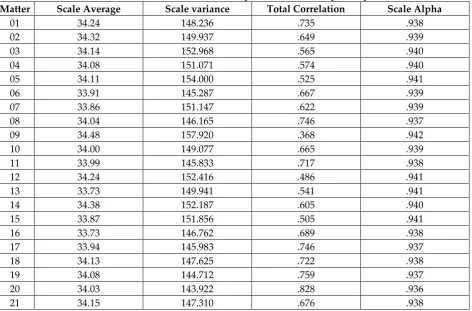
Table 3: The Results of Item Analysis and Reliability Analysis
Matter Scale Average Scale variance Total Correlation Scale Alpha
01 34.24 148.236 .735 .938
02 34.32 149.937 .649 .939
03 34.14 152.968 .565 .940
04 34.08 151.071 .574 .940
05 34.11 154.000 .525 .941
06 33.91 145.287 .667 .939
07 33.86 151.147 .622 .939
08 34.04 146.165 .746 .937
09 34.48 157.920 .368 .942
10 34.00 149.077 .665 .939
11 33.99 145.833 .717 .938
12 34.24 152.416 .486 .941
13 33.73 149.941 .541 .941
14 34.38 152.187 .605 .940
15 33.87 151.856 .505 .941
16 33.73 146.762 .689 .938
17 33.94 145.983 .746 .937
18 34.13 147.625 .722 .938
19 34.08 144.712 .759 .937
20 34.03 143.922 .828 .936
21 34.15 147.310 .676 .938
According to the reliability analysis, which was made for the Beck Scale, the reliability of the scale was determined as 0.94, which is a very high value.
Table 4: The Results of the Comparison of the Gender Variable with One-Way Variance Analysis in terms of Beck Scale Total Scores
Sex n Average Standard deviation Sum of squares Degree of freedom Squares
average F p Female
24 37.3333 14.95694 Between
Groups 291.530 1 291.530 1.814 .181 Male
68 33.2794 11.79533 In
Groups 14467.025 90 160.745 Total 92 34.3370 12.73507 Total 14758.554 91
There were no statically significant differences between the Beck Scale Total averages of the gender groups; F(1,90)=1.814; p>0.05.
Table 5: The Results of the Comparison of the Age Variable with One-Way Variance Analysis in terms of Beck Scale Total Scores
Age n Average Standard Deviation Sum of squares Degree of freedom Squares
Average F p
18
11 36.2727 13.96489 Between
Groups 207.082 3 69.027 .417 .741
19
19 35.6316 12.94523 In
Groups 14551.472 88 165.358
20 10 30.7000 7.14998 Total 14758.554 91 20 + 52 34.1538 13.37599
Total 92 34.3370 12.73507
There were no statistically significant differences between the Beck Scale Total Averages of the 4 groups formed according to age groups; F(3,88)=0,417; p>0.05.
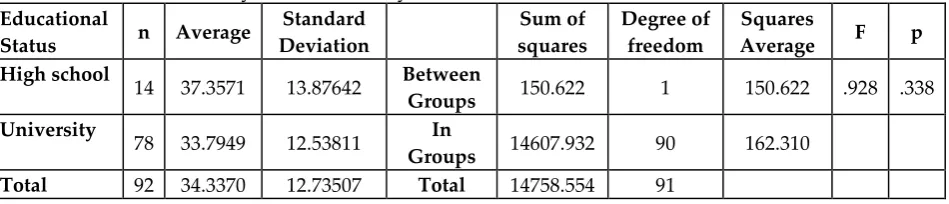
Table 6: The Results of the Comparison of the Educational Status Variable with One-Way Variance Analysis in terms of Beck Scale Total Scores
Educational
Status n Average
Standard Deviation Sum of squares Degree of freedom Squares
Average F p High school
14 37.3571 13.87642 Between
Groups 150.622 1 150.622 .928 .338 University
78 33.7949 12.53811 In
Groups 14607.932 90 162.310 Total 92 34.3370 12.73507 Total 14758.554 91
Table 7: The Results of the Comparison of the Income Status Variable with One-Way Variance Analysis in terms of Beck Scale Total Scores Income
status n Average
Standard Deviation Sum of squares Sum of squares Squares
Average F p
400-600
TL 17 33.8824 13.53183
Between
Groups 1213.719 3 404.573 2.628 .054
600-800
TL 40 33.7750 11.57470
In
Groups 13544.835 88 153.919
800-1000
TL 21 30.4762 10.13222
Total
14758.554 91
1000 TL
+ 14 42.2857 16.02128
Total 92 34.3370 12.73507
There was a statistically significant difference between the Beck Scale Total Averages of the 4 groups that were formed according to the income status of the individuals; F(3,88)=2.628; p<0.05. After determining the statistical difference, according to the Tukey-b Multiple Comparison Test, which was made to determine which group was different from others; all groups were different from each other. When the average scores of the groups in the scale were examined, it was observed that as the income levels of the individual increased, so did the depression levels. According to the results, each group is more depressive than the group that has lower income level than itself.
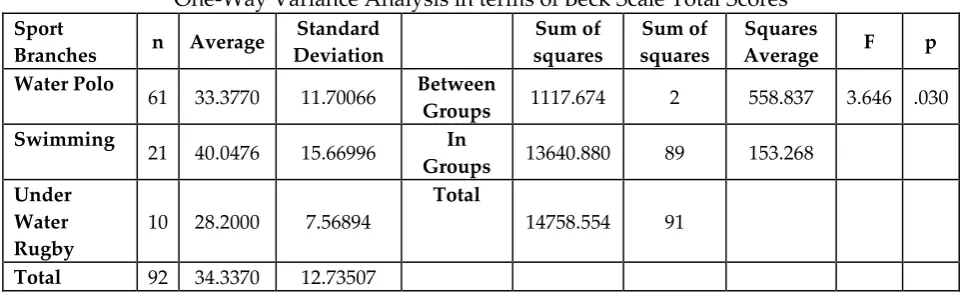
Table 8: The Results of the Comparison of the Sports Branch Variable with One-Way Variance Analysis in terms of Beck Scale Total Scores Sport
Branches n Average
Standard Deviation Sum of squares Sum of squares Squares
Average F p Water Polo
61 33.3770 11.70066 Between
Groups 1117.674 2 558.837 3.646 .030 Swimming
21 40.0476 15.66996 In
Groups 13640.880 89 153.268 Under
Water Rugby
10 28.2000 7.56894
Total
14758.554 91
Total 92 34.3370 12.73507
Table 9:The Results of the Comparison of the Sport-doing Period Variable with One-Way Variance Analysis in terms of Beck Scale Total Scores
Duration Engaged in sport
n Average Standard Deviation
Sum of squares
Sum of squares
Squares
Average F p
3-5
19 29.9474 9.14983 Between
Groups 637.901 3 212.634 1.325 .271
5-7
9 34.1111 12.35359 In
Groups 14120.654 88 160.462
7-9 21 33.4286 11.17842 Total 14758.554 91 9 + 43 36.7674 14.55177
Total 92 34.3370 12.73507
There were no statistically significant difference between the Beck Scale Total scores of the 4 groups that were formed according to the sports doing years of the individuals; F(3,88)=1.325; p>0.05.
4. Discussion and Conclusion
Most of the studies conducted on athletes mention the benefits of sports and physical activities in psycho-social terms and in terms of health. The contribution of sports to physical, spiritual and mental development is known. Additionally, it also has positive effects on the development of self-esteem and leadership properties of individuals. In some studies conducted on professional athletes, it was reported that their anxiety levels were high, and they had depressive and chronic exhaustion symptoms during intense workout periods (Karakaya et al., 2006).
In the present study of ours, no statistically significant differences were determined between the Beck Depression Scale Total Averages of the gender groups. In another study, no significant difference was determined between gender groups (Karakaya et al., 2006). When we evaluate the differences between the men and women groups, no significant differences were detected between the women and men in the study group. This result is parallel to that reported by Smith in 1993. In some other studies, it was reported that there were no significant differences between women and men in terms of depression levels (Hisli, 1989; Smith et al., 1993; Ayverdi, 1990). There were no statistically significant differences between the Beck Depression Scale Total averages of the 4 groups that were formed according to the age groups. We may associate this situation with the fact that age groups were very close to each other.
There were no statistically significant differences between the Beck Depression Scale Total averages of the groups that was formed according to the educational status. We may associate this situation with the fact that most of the subjects in our study were university graduates.
seen that as the income status of the individuals increased so did their depression scores. According to the results, each group is more depressive than the group that has lower income status than itself.
In the present study of ours, there was a statistically significant difference between the Beck Depression Scale Total averages of the 3 groups that were formed according to the sports branch of the individuals. The group that dealt with swimming seemed more depressive than the group that dealt with water polo and underwater rugby; and the group that dealt with water polo seemed more depressive than the group that dealt with underwater rugby. In other words, their average scores received from the Beck Depression Scale were higher. However, in another study, a reversely proportional relation was determined between the sports and physical activities and stress, anxiety and depression levels; and a directly-proportional relation was reported between the self-esteem and self-perception levels (Berger et al., 1983). In a study which was conducted on the sports that required individual competition, it was observed that the athletes who had stress and tension more had depression although doing sports is beneficial for eliminating boredom and depression (Kokrek et al., 1990). In the present study, a significant difference was determined between the depression levels in swimming sports, which is considered as an individual sport, and the other water sports that require struggling.
In our study, no statistically significant differences were determined between Beck Depression Scale Total averages of 4 groups according to the years they did sports; and there was no statistically significant difference between Beck Depression Scale Total averages of the 2 groups according to the success in sports of the individuals. We can associate the training and competitive personalities of professional athletes starting from early ages with the development of goal-targeted and perfectionist personality traits. This may be associated with an increase in the level of anxiety of the athletes, especially in intense workout periods. In some studies, the behaviors of coaches were also reported to be an important factor in anxiety and depression levels of athletes (Pensgaard et al., 2002; Baker et al., 2000).
Unlike the positive effects of sports on self-esteem and depression symptom levels, the height of anxiety levels determined in swimmers can be associated with performance. However, athletes, who are unable to gain control over their anxiety during childhood, may face difficulties in other areas of their lives. Perhaps, the results of ours confirm these. For this reason, especially the coaches must have the qualifications that may make the athletes acquire the skills such as confidence, being part of the team and controlling the excitement during the races. Meanwhile, parents should also be informed about supporting, encouraging, and not converting motivating into suppression for the children who deal with sports (Karakaya et al., 2002).
individuals are cared much, will give clearer results. This comment; however, at the same time constitutes both the limitations and the recommendations of the present study. This makes the present study a preliminary one; and shows that there is a need for an actual study.
References
1. Artal M., (1998). Exercise Ageist Depression, The Physician Sportmedicine, 26-10
https://doi.org/10.3810/psm.1998.10.1171
2. Atkınson RL, Atkınson RC, Smıth EE, Bem DJ, Nolen SH.(1990). Hilgard’s Introduction to Psychology (12 th Edition), University of California, San Diego, 539
3. Acıkada C. (2004). Training in children. Acta Orthop Traumatol Turc; 38(suppl.1):16-26
4. Ayverdi, M., (1990). Erken Ergenlik Donemi Ergenlerinin Depresyon Duzeylerini Etkileyen Bazı Dıs Etmenler. Yayınlanmamıs yuksek lisans tezi. Hacettepe Universitesi, Ankara (Sosyal Bilimler Enstitusu).
5. Baser E. (1998). Uygulamalı Spor Psikolojisi Performans sporunda Psikolojinin Rolu, Bagırgan Yayınevi, 278, Ankara,
6. Baker J., Cote J., Hawes R. (2000); The relationship between coaching behaviors and sport anxiety in athletes. J Sci Med Sport; 3:110-119.
https://doi.org/10.1016/S1440-2440(00)80073-0
7. Berger B. G., Owen D. R. (1983).Mood alteration with swimming-summers really do “feel better”. Psychosom Med, 45:425-433.
8. Cratty B. J. (1973). Psychology in contemporary sport, Englewood cliffs: NJ., Prentice Hall,
9. Davidson G., Neale J. M. (1994). Abnormal psychology (6th ed.). New York: John Wiley & Sons, Inc. https://trove.nla.gov.au/work/5802571
10.Faigenbaum A. D. (2000). Strength training for children and adolescents. Clin Sports Med; 19:593-619.
11.Goonenir Erbay, L., & Kartalcı, S. (2012). Depresyonda bilisssel davranısscı terapi. Tuurkiye Klinikleri Psikiyatri Ozel Sayısı, 5(2), 97-102.
12.Hisli N (1989). Beck Depresyon Envanterinin Universite Ogrencileri için gecerliligi ve guvenirligi. Psikoloji Dergisi, 7:3-13.
13.James W. Johnson D. W. (1983). The relationship between attitudes towards social interdependence and psychological health within three criminal populations, Journal of Social Psychology, 221, 31-143
15.Kokrek, Z., Torun, K., Balcıoglu, İ. (1996);· Sakatlık Geciren Bireysel Mucadele Sporcularında Depresvon Faktorunun Arastırılması, Yeni Symposium 34(3-4), s. 68-71
16.Meffulli N. (1992). The young child in sport. Br Med Bull; 48:561-568
17.Ozturk O. (1997). Ruh Saglıgı ve Bozuklukları, Medikomat Basımevi, Ankara 18.Pensgaard A. M., Roberts G. C. (2002); Elite athletes’ experiences of the
motivational climate: the coach matters. Scand J Med Sci Sports ; 12:54-59
https://doi.org/10.1034/j.1600-0838.2002.120110.x
19.Smith A. M., Stuart MJ, Wiese DM, Milliner EK (1993).Competitive athletes. Preinjury and post injury mood state and self-esteem. Mayo Clin Proc. (68): 939-947
20.Syer J., Connolly C. (1998). Sporcular için Zihinsel Antrenman Rehberi, Ceviren: F. Umur Erkan, Bagırgan Yayınevi,85-87, Ankara
21.Tiryaki S. (1991). Sportif performans ile Edwards Kisisel Tercih Envanteri verilerinin iliskisi, Spor Bilimleri Dergisi, 2(2), 32-37
22.Tiryaki S. (2000). Spor Psikolojisi, Eylul Yayınları, Ankara,
Creative Commons licensing terms
Authors will retain the copyright of their published articles agreeing that a Creative Commons Attribution 4.0 International License (CC BY 4.0) terms will be applied to their work. Under the terms of this license, no permission is required from the author(s) or publisher for members of the community to copy, distribute, transmit or adapt the article content, providing a proper, prominent and unambiguous attribution to the authors in a manner that makes clear that the materials are being reused under permission of a Creative Commons License. Views, opinions and conclusions expressed in this research article are views, opinions and conclusions of the author(s). Open Access Publishing Group and European Journal of Physical Education and Sport Science shall not be responsible or answerable for any loss, damage or liability caused in relation to/arising out of conflict of interests, copyright violations and inappropriate or inaccurate use of any kind content related or integrated on the research work. All the published works are meeting the Open Access Publishing requirements and can be freely accessed, shared, modified, distributed and used in educational, commercial and