Browse Title Index
14
0
0
Full text
(2) Norzailawati Mohd Noor, Alias Abdullah & Mohd Nasrul Hanis Manzahari Land Cover Change Detection Analysis on Urban Green Area Loss using GIS and Remote Sensing Techniques. change in urban areas is a major concern due to the built-up area expansion and rapid changes. Changes in green area consequently will result in the change of wildlife habitat, aesthetic, historical values, ambient air quality and other resource values, which in turn influence policy decision. Change detection is useful in many applications such as land cover and land use changes, habitat fragmentation, the rate of deforestation, coastal change, urban sprawl, and other cumulative changes through spatial and temporal analysis techniques such as GIS (Geographic Information System) and Remote Sensing along with digital image processing techniques. Mac Lead & Congation (1998) list four aspects of change detection which are important when monitoring natural resources:1) detecting the changes that have occurred; ii) identifying the nature of change; iii) measuring the extent of the change and iv) assessing the spatial of the change. The basis of using remote sensing data for change detection is that change in land use result in changes of radiances value which can be remotely sensed. Numerous techniques to perform change detection with satellite imagery have been the result of increasing versatility in manipulating digital data and increasing computer power. GIS is the systematic introduction of numerous different disciplinary spatial and statistical data that can be used in inventorying the environment, observation of change and constituent processes and prediction based on current practices and management plans. Remote Sensing helps in acquiring multi spectral spatial and temporal data through space borne remote sensors (Mohd Noor et al., 2012; Mohd Noor et al., 2011 and Ibrahim et al., 2000) while Image processing technique helps in analyzing the dynamic changes associated with the earth resources such as land and water using remote sensing data. Thus, spatial and temporal analysis technologies are very useful in generating scientifically based statistical spatial data for understanding the land ecosystem dynamics. Successful utilization of remotely sensed data for land cover and land use change detection requires careful selection of appropriate data set (Mohd Noor and Hashim 2009a and 2009b; Syriou, 2008 and Davis et al., 1991). Green area can be defined as any green elements existed as the land cover on the ground which includes green cover, green spaces, green lungs, green belts and open space, any other elements other than are described as builtup area where it mostly comprises of with man-made hardscape, exposed bare soil, rocks and water elements (Van Boummel et al, 2006).Green area helps to reduce building heat in urban areas where it absorbs heat and maintains the cool at day and night as well as provides shades to the pedestrians and ground. Green area also has the ability to improve air quality of the surrounding environment where this ability is extremely important in today’s contaminated environment. A tree can remove 26 pounds of carbon dioxide from the atmosphere per year © 2013 by MIP. 126.
(3) PLANNING MALAYSIA: Journal of the Malaysia Institute of Planners (2013). which equals to 11,000 miles of car emissions (Relf, 2009). Lambinand Geist (2007) mentioned that the causes of land cover changes can generally be divided into two which are proximate (direct cause) and underlying (indirect cause) where land cover can change due to natural causes such as flood, earthquake or tsunami. Green area in urban is sometimes synonymous to presence of nature in the predominantly man made environment. Urban vegetation is an important point for sustainable development, environmental conservation and urban planning process of a city. Furthermore, World Health Organization (WHO) has been specified a standard of minimum 9m2 of green area per person in every city in the world. The optimal amount would be 10m2 to 16m2 for every person (Vázquez, 2011). In relation to this matter, the current provision of green area for every resident of Kuala Lumpur as has been stated in Chapter 5: Greater Kuala Lumpur/Klang Valley, Economic Transformation Program is only 12m2 per people which is lower compared to the standard specified by the World Health Organization (WHO). The aim of this study is to incorporate the temporal dependence of multi –temporal image data on land cover change detection techniques particularly in detecting a degradation of green area in an urban area that consequently enhance interpretation capabilities. Moreover integration of multi sensor and multi temporal satellite data effectively improves the temporal attribute and the reliability of multi data. Urban Green Area in Malaysia The World Environment Day 2011 in New Delhi organized by the United Nations Environment Program (UNEP) has highlighted the loss of forests and green area which happens in cities all around the world. Continued deforestation which is estimated at 5.2 million hectares worldwide per year (Shukla, 2011) is an alarming issue that must be realized by local authorities and population especially in urban areas. Kuala Lumpur experiencing dramatic changes in land use for the past few decades and there is a big possibility for depletion of green areas which have been turned into the new built up areas, towns and transportation facilities. Due to pressures from new developments in urban areas, green areas in Kuala Lumpur are seen to be rapidly declining in term of allocated space and quality. One of the major urban problems associated with the loss of green area in Kuala Lumpur is the flash flood which has been a daily occurrence in Kuala Lumpur whenever there is a heavy downpour, especially in the city centre and downstream areas (The Star, 2012). The effort of urban greening in Malaysia has been done for the years before Independence where the greening programs have been started by British 127. © 2013 by MIP.
(4) Norzailawati Mohd Noor, Alias Abdullah & Mohd Nasrul Hanis Manzahari Land Cover Change Detection Analysis on Urban Green Area Loss using GIS and Remote Sensing Techniques. colonial in the past few decades. The issue of declining green area has become a major issue throughout the world particularly among developed and developing countries due to the obvious negative impacts which occurred as the result of loss of green area in term of visual quality, environmental quality and health quality which leads to various establishments of organizations and voices which fight to protect the remaining green area from being disappeared (The Star, 2012).New developments and projects changes the environment in Kuala Lumpur where most green areas have been converted into built up areas. The current gazette open space to population ratio for Kuala Lumpur is in a poor state compared to London with 4ha per 1,000 people, Melbourne with 2ha per 1,000 people and Toronto with 2ha per 1,000 people while current provision of green area is only 12m2 per people compared to World Health Organization (WHO) standard which is 16m2 per people thus it is important for this research to identify how to assess the changes of green areas in Kuala Lumpur as the questions on what, when, where and why the changes of green areas happened in Kuala Lumpur are still unsolved. Study area: Kuala Lumpur The study area is located in Kuala Lumpur (3°8′51″N 101°41′36″E), Malaysia, the federal capital and most populous city in Malaysia where it covers 243 km2 (94 sq mi) of land with an estimated population of 1.6 million in 2012 (Figure 1). Majority of the land use pattern consist of built-up areas (commercial, residential, institution, industrial recreational area, infrastructure and utilities).Once home to the executive and judicial branches of the Federal Government before it was moved to Putrajaya in 1999, Kuala Lumpur was ranked 48th among international cities by Foreign Policy's 2010 World Cities Index and was ranked 67th among international cities for economic and social innovation by the 2thinknow Innovation Cities Index in 2010. Therefore, it is crucial to sustain a green area in this region needs is crucial to ensure a prosperity and health of the urban population.. © 2013 by MIP. 128.
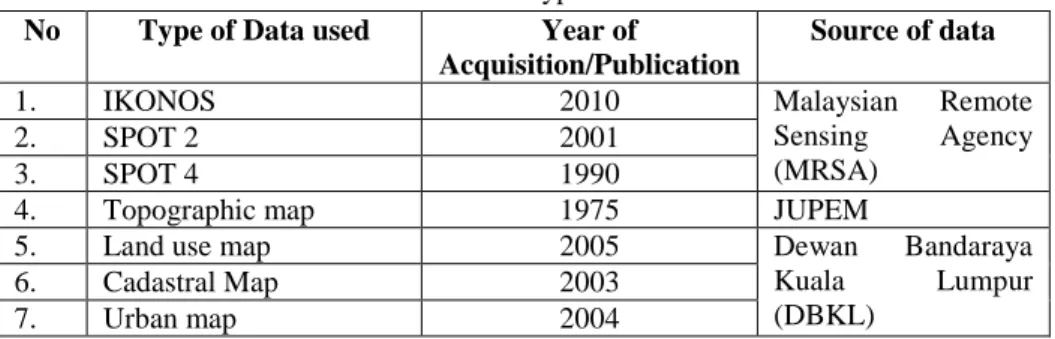
(5) PLANNING MALAYSIA: Journal of the Malaysia Institute of Planners (2013). Not to scale (Study Area). Figure 1: Location of study area – Kuala Lumpur, Malaysia. METHODOLOGY Material and software The data were being collected from primary and secondary data sources. The data collected from the primary sources include topographic maps of the area, land use map, road map and two types of satellite imagery for year 1990 to 2010 (Table 1). The ancillary information collected from secondary sources includes road network, cadastral map, urban map and records of green area reserve.. No 1. 2. 3. 4. 5. 6. 7.. Table 1: Different type of data used Type of Data used Year of Acquisition/Publication IKONOS 2010 SPOT 2 2001 SPOT 4 1990 Topographic map 1975 Land use map 2005 Cadastral Map 2003 Urban map 2004. 129. Source of data Malaysian Remote Sensing Agency (MRSA) JUPEM Dewan Bandaraya Kuala Lumpur (DBKL). © 2013 by MIP.
(6) Norzailawati Mohd Noor, Alias Abdullah & Mohd Nasrul Hanis Manzahari Land Cover Change Detection Analysis on Urban Green Area Loss using GIS and Remote Sensing Techniques. 8.. Green area development data. 2011. Methods In order to understand the dynamic phenomenon of land use changes, the basic requirement is the availability of information on green area change, urban pattern identification and computation of landscape metric. In this study all the required information has been compiled and converted to digital forms are readily used in both data processing in Digital image Processing System and Geographic Information System. The ERDAS imagine 2011 is the main Digital Image Processing used in the study, while ArcGIS software system is the geographic system used to generate various thematic layers consisting of Kuala Lumpur Administrative boundaries, roads, and administrative boundary map using topo-sheet and other available maps. Complete methodology of the study in Figure 1. The image pre-processing and data preparation techniques were first to be carried out; which include image rectification. The image to map procedures has been applied to all satellite imageries using sets of ground control point area appear in the same place both in the imagery and known locations in corresponding map and the urban map used as ancillary information in the rectification process. Image classification is then applied to the pre-processed image, where the land use classes map of the entire study is produced. The supervised classification techniques have been chosen for this study, using supervised classifier in ERDAS 2011, which have enabled to separate built-up and green area in accordance to the requirement in the study.. © 2013 by MIP. 130.
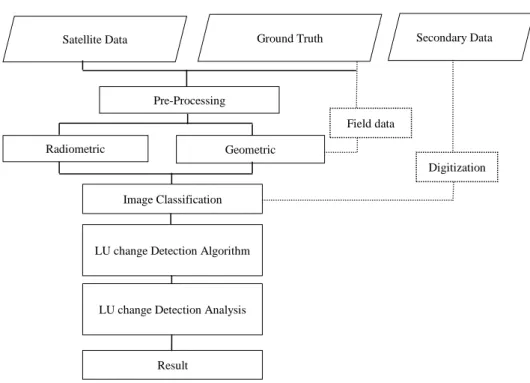
(7) PLANNING MALAYSIA: Journal of the Malaysia Institute of Planners (2013). Secondary Data. Ground Truth. Satellite Data. Pre-Processing Field data Radiometric. Geometric Digitization Image Classification. LU change Detection Algorithm. LU change Detection Analysis. Result. Figure 2: Flowchart of data processing adopted in the study. Once the training sites were determined, maximum likelihood classification was utilized. The Maximum Likelihood classifier is considered to give very accurate results. The classification scheme utilized only two land use classes representing green area and built-up area. The post interpretation phase included preparation of land use maps and detection of their changes. The change detection algorithm, which was employed in this study, is the post classification comparison. The overlay consisting of land use maps of 1990. 2001 and 2010 were made through ERDAS IMAGINE 2011 software. Then a transition matrix was prepared for the overlaid land use maps of 1990, 2001 and 2010 to obtain an analysis of LU changes.. RESULTS AND DISCUSSION Image Analysis The 3 sets of satellite data (IKONOS, SPOT2 & SPOT 4) have been successfully geometrically corrected and transformed to local mapping coordinate with RMSE ±0.5 pixel to ensure accuracy of the green area location analysed. In fact this RMSE had been widely used a good practice in ensuring good geometric output apart from ensuring sound configuration of ground 131. © 2013 by MIP.
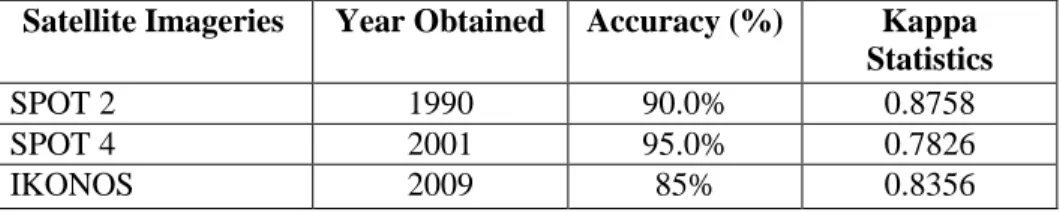
(8) Norzailawati Mohd Noor, Alias Abdullah & Mohd Nasrul Hanis Manzahari Land Cover Change Detection Analysis on Urban Green Area Loss using GIS and Remote Sensing Techniques. control point which is evenly distributed in the study area. Filling this imagery is also subjected to image enhancement respectively. While, the radiometric correction results show that histogram equalization is done for a better view and well distribution of pixels of the images which helps in better view and high possibility for more accurate classification. It is also shown in Figure 3 that the brightness values of each band span into optimum and uniform frequency based on image type where the brightness values of SPOT-2 XS image from year 1990 range from 64 to 256, while the brightness values of SPOT-4 1 I image from year 2001 range from 65 to 256 and the brightness values of IKONOS image from year 2009 range from 60 to 256 for each band within each image. This is because Histogram Equalization assigned all non-existent values below the minimum range and all non-existent values above the maximum range in the minimum and maximum range of each band respectively. Three imageries obtained from year 1990 and 2009 are classified using supervised classification. The image classification carried out into main steps process to produce level classes of green area and built-up area in Kuala Lumpur. The results acquired from supervised data classifications have been reclassified into green area and built-up area and have been assigned with different colours to distinguish each class while percentage of both classes have been calculated based on the formula adopted.(Integraph 2001): Histogram value for class / Total Histogram Value x 100…………………….(1) The corresponding vector layer of land parcels was used as contextual information on the labeling level of the classified spectral class in a GIS system. The result of classification shows that two types of land use of the green area and built-up area are successfully classified. The assessment of the classification was carried out based on the classified image in each processing. Table 2 below summarizes the accuracy assessment obtained from the classification process done to every each satellite imagery. An overall classification accuracy of over 85% has been achieved during image processing. This is indeed very good classification confirmed by significant test. Table 2: Accuracy Assessment for supervised classification processed of three types of satellite images.. Satellite Imageries SPOT 2 SPOT 4 IKONOS © 2013 by MIP. Year Obtained. Accuracy (%). 1990 2001 2009. 90.0% 95.0% 85% 132. Kappa Statistics 0.8758 0.7826 0.8356.
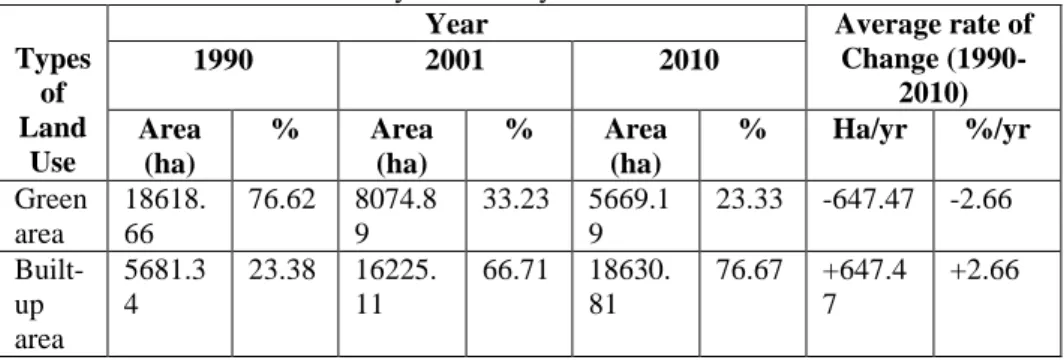
(9) PLANNING MALAYSIA: Journal of the Malaysia Institute of Planners (2013). Changes in Green Area (1990-2010) They're two results highlighted in this study consist of comparing and revealing a proportion of the green area loss. It clearly shows that the green area in Kuala Lumpur decreases significantly after 1990 until 2010. It is obvious from the table 3 that a study area had been subjected to the intensive human influence prior to the base year 1990. The average rate of change for the year 1990 – 2010 shows that we are losing a green area about 647.47 ha with 2.66% per year in 20 year period and increased increasing on the built-up usage with the same manner. The comparison of green area and built-up area changed is tabulated as follows: Table 3: Comparison of area and rates of change of green areas and built area between year 1990 - year 2010. Year Average rate of Types Change (19901990 2001 2010 of 2010) Land Area % Area % Area % Ha/yr %/yr Use (ha) (ha) (ha) Green 18618. 76.62 8074.8 33.23 5669.1 23.33 -647.47 -2.66 area 66 9 9 Built- 5681.3 23.38 16225. 66.71 18630. 76.67 +647.4 +2.66 up 4 11 81 7 area. The spatial map in figure 4 below indicates the changes of green area for a year 1990, 2001 and 2010. In a span of 20 years there was the loss of more than ¾ green areas in Kuala Lumpur.. 133. © 2013 by MIP.
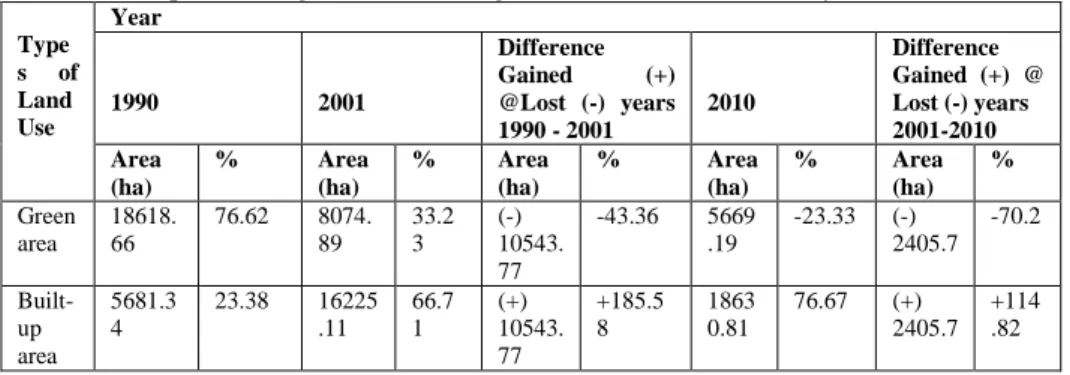
(10) Norzailawati Mohd Noor, Alias Abdullah & Mohd Nasrul Hanis Manzahari Land Cover Change Detection Analysis on Urban Green Area Loss using GIS and Remote Sensing Techniques. Year 1990. Year 2001. Year 2010. LEGEND: Green Area. Built-up area. Figure 3: Results for classification. The proportion of the green area unit changed between 1990- 2010 also has been presented in table 4. Within the period, more land was brought under built-up area. In line with this, the land cover data of three years indicated the rapid changes/conversion from green area in built-up area. Table 4: Proportion of green area units gained and/or lost between years 1990 – 2010 Year Type s of Land Use. Green area Builtup area. 1990. 2001. Area (ha) 18618. 66. %. 5681.3 4. 23.38. 76.62. Area (ha) 8074. 89. %. 16225 .11. 66.7 1. 33.2 3. Difference Gained (+) @Lost (-) years 1990 - 2001 Area % (ha) (-) -43.36 10543. 77 (+) +185.5 10543. 8 77. 2010 Area (ha) 5669 .19. %. 1863 0.81. 76.67. -23.33. Difference Gained (+) @ Lost (-) years 2001-2010 Area % (ha) (-) -70.2 2405.7 (+) 2405.7. +114 .82. Based on the table it shows that the percentage of green area from the year 1990 to 2001 decreased about 43.36% while the percentage of green area from year 2001 to year 2010 decreased about 23.3%. The built –up area shows that for 1990-2001, Kuala Lumpur has developed about 185.58% of the total development in year 1990 (5681.34ha) and 76.67% in 2001-2010 which based © 2013 by MIP. 134.
(11) PLANNING MALAYSIA: Journal of the Malaysia Institute of Planners (2013). on year 2001 (166225.11ha). The total difference of gained and lost in the Kuala Lumpur land cover stated that a total loss of green area for year 19902010 is about 70.2% and total gained of built up area for 20 year period is 114.82%. The declining trend of green area in Kuala Lumpur from year 1990 until 2010 shows that the green area will continue to decrease if no drastic action is taken towards this issue which will create a nightmare for the population of Kuala Lumpur in the future. Factors of Green area changed in the study area Based on the explanations on the results from the reclassification process, there are two significant factors which contribute to the changes of green area in Kuala Lumpur; a) Increase of built up areas and b) Sprawl development pattern. The developments in Kuala Lumpur result in more green area to be converted into built up areas. The following figure shows the increasing provision of land uses to be developed from year 1990 until the incoming year 2020. The provision of more land for these land uses will surely affect the percentage of green area in the future despite of more open spaces provided for each development.. 135. © 2013 by MIP.
(12) Norzailawati Mohd Noor, Alias Abdullah & Mohd Nasrul Hanis Manzahari Land Cover Change Detection Analysis on Urban Green Area Loss using GIS and Remote Sensing Techniques. Figure 4: Pattern of green area changes in Kuala Lumpur. Sprawl development pattern in Kuala Lumpur involves horizontal development where the development continues to spread in a horizontal manner and involves more land. More green areas would be sacrificed once there is an expansion of development. Multiple layers of green area from the year 1990, 2001 and 2009 have been overlaid respectively to show the pattern of green area changes in Kuala Lumpur as shown in the figure above. This accuracy assessment shows that the results from classification stage are reliable to interpret the data of changes of green area in Kuala Lumpur and to be used for the analysis and findings of this study as Thomlinson et al. (1999) set a target for overall accuracy of 85% of a classified data to be considered reliable,. CONCLUSION Green area is an asset of an urban area and it is an important factor to sustain life and living in any rapidly growing cities such as Kuala Lumpur. The rapid depletion of green area in recent year might result in adverse condition in urban area and its surrounding areas. The loss of green area brought many problems and harms to the area and population thus drastic action must be taken by the local authority. Initiatives should be taken to avert the area from the negative effects of urban pollution and deforestation by various government and nongovernment organizations, but the situation seems to overdo the expected rate of change and expansion. Green area is dynamic and spatial metrics analysis imperative for in understanding the landscape ecological conditions of urban green area. The study reveals that the green area in Kuala Lumpur is declining and will continue to decline if there is no specific measure taken by the local authority. Comprehending the results of data classification and explanations of the green area changes based on relevant information shows that the increase of built up area and sprawl development pattern are the factors which contribute to changes of green area in Kuala Lumpur. The integration of GIS and remote sensing as a powerful tool shows that a capability to provide a necessary physical input and intelligence for monitoring and detecting changes of land cover and land use in urban areas. In other hand, moving further, interfacing of urban planning with GIS and remote sensing should now receive due attention. Incorporation of land use planning model, urban sprawl analysis and related applications to evaluate different urban development alternatives in the GIS and remote sensing framework need to be explored for added knowledge in achieving a sustainable planning as well.. © 2013 by MIP. 136.
(13) PLANNING MALAYSIA: Journal of the Malaysia Institute of Planners (2013). ACKNOWLEDGEMENT The authors are grateful especially to the IIUM, anonymous reviewers, and other contributors to the paper. This study is especially indebted to the Peninsular Malaysia Department of Town and Country Planning (JPBD), and Malaysia Remote Sensing Agency (ARSM) for the digital land use satellite imagery database.. REFERENCES Amiri, F., &Tabatabaie, T. (2010).Using Remote Sensing data for Vegetation Cover Assessment in Semi-arid Rangeland of Center Province of Iran. Anderson, J. R., Hardy, E.E., Roach, J.T. &Witmer, R.E. (1976).A Land Use And Land Cover Classification System For Use With Remote Sensor Data. Geological Survey Professional Paper 964. A revision of the land use classification system as presented in U.S. Geological Survey Circular 671. Chapter 5: Greater Kuala Lumpur/Klang Valley, Economic Transformation Programme. Retrieved http://etp.pemandu.gov.my/upload/etp_Bab_5_greater_klkv.pdfon 12th May 2012 at 8.35PM. Davis, F.W. &Simonett, D.S. (1991).GIS and Remote Sensing. In: Geographical Information Systems: Principles and Applications. pp. 191–213. Longman, London. Ibrahim, Zainal&Mariamni (2000). Application of Optical Remote Sensing Technology for Oil Palm Management.Geospatial Communication Network. Jensen, J. (2000). Remote Sensing of the Environment: An Earth Resource Perspective. Prentice Hall. Lambin, E. & Geist, H.J. (2007).Causes of Land-Use and Land-Cover Change.The Encyclopedia of Earth. Langran, G. (1992). Time in Geographic Information Systems.London, Taylor and Francis. Macleod, R.D., and Congalton, R.G (1998) A quantitative comparison of change detectionalAlgorithms for monitoring eelgrass from remotely sensed data. Photogrammetric Engineering& Remote Sensing, 64, pages 207-216. McAllister, W.K. (2002). The Land Use and Land Cover Dichotomy: a Comparison of Two Land Classification Systems in Support Of urban Earth Science Applications. NASA Faculty Fellowship Program.Marshall Space Flight Center, the University Of Alabama. Mohd Noor, N. Alias A.,. Mazlan, H and. Zainora (2012) M.A Managing Urban Land in Developing Countries Using GIS and Remote Sensing: Towards Resilient Cities .Department of Urban and Regional Planning, IIUM, Gombak, Malaysia.. 137. © 2013 by MIP.
(14) Norzailawati Mohd Noor, Alias Abdullah & Mohd Nasrul Hanis Manzahari Land Cover Change Detection Analysis on Urban Green Area Loss using GIS and Remote Sensing Techniques. Mohd Noor, N., Abdullah, A and Mazlan, H (2011). ). Classification of Satellite fused data for land use maping in Development Plan Purposes, Journal of Malaysian Institute of Planners, Vol.9.pg.97-106,ISSN 1675-6215 Mohd Noor, N. and Hashim, M (2009a). Modelling un-authorized Land Use Sprawl with integrated Remote Sensing-GIS Technique and Cellular Automata, Workshop on Geographical Analysis, Urban Modeling, Spatial statistics (GEO-AN-MOD 09), ICCSA 2009, Part I, LNCS 5592, pg 163-175. 29 June- 2 July 2009.Busan. Korea Mohd Noor, N. and Hashim, M (2009 b) Remote Sensing in Urban Sprawl Modeling: Challenges and Way Forward in Urban Planning in Malaysia, 6th International Symposium on Digital Earth, Paper ID: 042750675, 9th -10th September 2009 Beijing China. Relf, D. (2009). The Value of Landscaping.Virginia Cooperative Extension. Shukla, S. (2011).Make Our Blue Planet Green: World Environment Day 2011. Citizen News Service. Retrieved from http://www.citizen-news.org/2011/06/worldenvironment-day- 2011.html on 2nd July 2012 at 3.25PM. Syriou, A. (2008). Comparison of Satellite and Airborne Remote Sensing For GreenSpaces in Urban Areas: Example of Edinburgh, UK. The University of Edinburgh. The Star (2012).Heavy downpour causes flash floods, massive traffic jams in Klang Valley. Retrieved http://thestar.com.my/news/story.asp?file=/2012/5/7/nation/2012 0507080&sec=nation on 7th May 2012 at 9.45PM. VanBommel, F., Heitkonig, I., Epema, G., Ringrose, S., Bonyongo, C., &Veenendaal, E. (2006). Remotely Sensed Habitat Indicators for Predicting Distribution of Impala (Aepyceros melampus) in the Okavango Delta, Botswana.Journal of Tropical Ecology, 22, pg. 101110. Vázquez, M. (2011).How much green space does your city have? SustainableCities.net Retrieved from http://blog.sustainablecities.net/2011/07/13/how-manymetres-of-green- space-does-your-cityhave/ on 17th May 2012 on 8.45AM. Vitousek PM (1992). Global environmental change: an introduction.Ann. Rev. Ecol. Syst. 23: 1–14. Yuan, M. (1996).Temporal GIS and Spatio-Temporal Modeling.Department of Geography, the University of Oklahoma.. © 2013 by MIP. 138.
(15)
Figure
+2
Related documents
Volume 2, No 5, Sept Oct 2011 International Journal of Advanced Research in Computer Science RESEARCH PAPER Available Online at www ijarcs info © 2010, IJARCS All Rights Reserved
International Journal of Scientific Research in Computer Science, Engineering and Information Technology CSEIT183623 | Received 05 July 2018 | Accepted 15 July 2018 | July August 2018 [
ABSTRACT: The present paper presents the results of an experimental investigation carried out to study the effect of Hydrochloric acid on High performance concrete with
Wu Z, Dong F, Zhao W, Wang H, Liu Y, Guan B: The fabrication and characterization of novel carbon doped TiO 2 nanotubes, nanowires and nanorods with high visible light
The present paper has argued that excessive general impairment of gene expression can be expected to manifest as abnormality of behaviour and appearance, with certain
For single- photon sources it is desirable to maximize the biexciton (XX) shift so that in the two-photon cascade through the intermediate exciton (X) state the two photons have a
This layer consist of the core IPV6 network of 4G and other heterogeneous access networks such as GSM (Global System for Mobile communications), CDMA( Code Division
The results reveal that CNT-CdSe composite exhibit excellent photocatalytic activity for degradation of MB solution under visible- light irradiation.. Authors
