Suresh Madhavan et al JMSCR Volume 07 Issue 08 August 2019 Page 496
Gender Based Prognostication Value of Left Ventricular Global
Longitudinal Strain with Grace Score in non St Elevation Myocardial
Infarction – A Single Centre Experience
Authors
Suresh Madhavan
1*, Jayaprasad N
1, V Sudhakumary
1, Gargi Sathish
1,
Jayaprakash K
2, K.J. Raihanathul Misiriya
2, V.L. Jayaprakash
2, Raju George
21
Associate professor, 2Professor
Government Medical College, Kottayam, Kerala, India 686008
*
Corresponding Author
Dr Suresh Madhavan Abstract
Aims: Coronary risk stratification using GRACE score [Global Registry of Acute Coronary Events] and early treatment is beneficial in NSTEMI [Non ST elevation Myocardial Infarction]. We aimed to evaluate utility of peak systolic Global Longitudinal Strain [GLS] score along with GRACE score in identifying patients at high risk for cardiac events & to observe any gender related impact of these scores in predicting MACE [Major Adverse Cardiac Events] following an episode of NSTEMI.
Methods: We prospectively studied 636 patients admitted to Medical College, Kottayam, India with diagnosis of NSTEMI during the period of 3 years from 2014 to 2017. All patients were categorised in to low, moderate and high GRACE score groups along with GLS score measurement. 6 months MACE was statistically analysed.
Results: Females with NSTEMI had less negative GLS scores compared to male counterparts. The optimal cut off value of GLS for prediction of significant Coronary artery disease [CAD] in at least one coronary arterial territory in the study population was found as ≥-15.7 (AUC 0.797, p value 0.009). The sensitivity, specificity and positive predictive value [PPV] of GLS for detecting significant CAD were 89%, 70%, and 83.3% respectively. 6 months MACE was high in females compared to males with similar levels of GRACE score. MACE in different GRACE groups were higher when the GLS score was ≥-15.7.
Conclusion: In patients with NSTEMI, simple bedside echocardiographic assessment of peak systolic GLS score calculation, when used with the GRACE score can increase the prognostic value, especially in females. For comparable GRACE scores ,the risk of cardiac events were higher in females compared to males when the GLS score is ≥-15.7.
Keywords: NSTEMI, GRACE score, Global longitudinal strain.
Introduction
Various available guidelines stress the importance of early risk stratification in the management of NSTEMI and recommend an integrated approach to risk assessment1.GRACE score is used for risk
assessment in ACS (Acute Coronary Syndrome) which includes NSTEMI, STEMI and Unstable Angina. Risk assessment should be performed at the time of hospital admission and is important because it gives an idea about probability of
in-http://jmscr.igmpublication.org/home/ ISSN (e)-2347-176x ISSN (p) 2455-0450
Suresh Madhavan et al JMSCR Volume 07 Issue 08 August 2019 Page 497 hospital death and also guides the appropriate
treatment plan in NSTEMI& Unstable Angina. Eight parameters are used for calculating GRACE score that include patient’s age, heart rate, systolic blood pressure, Killip class, serum creatinine level, cardiac arrest at hospital admission, ST-segment deviation in ECG and elevated cardiac marker. In NSTEMI the GRACE score corresponds to an estimated probability of all-cause mortality and MACE from hospital discharge to 6 months. It should be emphasized that all available risk scores are just clinical tools that can supplement but not replace sound clinical judgment. Lack of inclusion of gender difference in the scoring system and its impact in clinical scenario has been studied by CANRACE investigators and ARIAM-SEMICYUC group and the matter still invites a hot debate.2-3 Unlike STEMI, early invasive strategy is not widely popular in NSTEMI, atleast in developing countries.
Non-invasive identification of patients with coronary artery disease [CAD] remains a clinical challenge despite the widespread use of imaging and provocative testing; more than 50% of patients currently referred to coronary angiography show normal or non-obstructive CAD4 . Severe CAD is known to lead to LV dysfunction. However, the LV ejection fraction is usually normal at a relatively early stage.5 Thus, establishing a more sensitive index for early-stage ischemia induced LV dysfunction is of great importance. The longitudinally arranged subendocardial fibers are more vulnerable due to their direct exposure to the intraventricular blood pressure and the anatomy of the coronary circulation.6-8 As a result, longitudinal function is impaired first in CAD. Measurements of longitudinal motion and deformation are therefore, the most sensitive markers of coronary artery disease especially in patients with severe coronary stenosis, where intermittent ischemia may result in subtle forms of stunning that may be detectable with strain measurements. GLS can be detected by
two-dimensional speckle tracking echocardiography (2D-STE)10-18
Sources of variability in global longitudinal strain can be related to race, ethnic factors, age and gender differences, hemodynamic factors, medications, volume status. Sex-related differences have been described, with lower deformation noted in male patients than in female patients across all age groups studied.9Reported normal values of GLS varied from 15.9% to -22.1%21.
Previous studies have shown 2 D echo derived peak systolic GLS score to be an independent predictor of MACE in STEMI patients. Prospective data with large number of patients are sparse on the use of GLS in patients with NSTEMI especially in female subsets. We sought to determine whether GLS score can have added prognostication value in patients with NSTEMI in predicting MACE at 6months.
Subjects and Methods
In a prospective observational study conducted at Department of Cardiology, Government Medical College, Kottayam, Kerala, India, the patients presenting with the diagnosis of NSTEMI between 1 February 2015 and 31march 2018and who gave an informed consent to participate are included in the study.
Inclusion Criteria
In patients with the diagnosis of NSTEMI during the study period.
Exclusion Criteria
Past History of STEMI/NSTEACS Past history of heart failure
Significant Valvular Heart Disease Past history of myocardial diseases Bundle branch block
Atrial fibrillation
Past history of malignancy or use of chemotherapeutic agents.
Study Protocol
Suresh Madhavan et al JMSCR Volume 07 Issue 08 August 2019 Page 498 characteristics were recorded.We measured the
GRACE score for NSTEMI& peak systolic GLS score by 2D speckle tracking echocardiography at initial presentation to hospital. Based on the GRACE score, patients were categorised in to three groups namely mild risk [score <100], moderate risk [score 100-170] and high risk [score >170]. On admission to the hospital, bedside echocardiographic examination and GLS calculation was done using General Electric VIVID 9 machine with M5S transducer, with a frequency of 1.5–4.3 MHz and high frame rate (60–90 frame/s).All patients underwent coronary angiography and revascularisation according to the symptoms & physician discretion. Results were analysed and mean GLS score [GLS cut off] to predict significant coronary artery disease was found out. Subsequently, the patients were categorised in to two groups based on thus obtained mean GLS score [≥- 15.7and <15.7].6 months follow up was done and analysis done for MACE based on GRACE score and GLS scores. Patients were followed up for 6 months for MACE after the index admission.
End point of the study
End point of the study was the occurrence of MACE.MACE was defined as STEMI/ NSTEACS/heart failure/death due to cardiac causes within 6 months
Statistical Analysis
Quantitative variables were expressed as mean, standard deviation, median and inter quartile range. Qualitative variables were expressed as proportion. Between groups comparison of quantitative variables was analysed by independent sample t test. Between groups
comparison of qualitative variable was analysed by Chi-square test. For the diagnostic test evaluation Sensitivity, specificity, positive predictive value and negative predictive value was calculated. A p value <0.05 was considered as statistical significance. Data analysis was performed using SPSS ver. 17.0. Data was coded and entered in Microsoft Excel and analyzed using IBM SPSS software. Association between various factors was assessed using chi square test for qualitative variables and t test/ANOVA for quantitative variables. The level of statistical significance was p value less than 0.05.
Results
Baseline characteristics [Table1]
Total of 636 patients who satisfied the inclusion criteria were enrolled in the study and followed up to 6 months. There was no significant difference between the number of males [N=326]and females [N=310], with a p value of 0.37. Mean age of Female subset was 58.2 years [range 28 - 84 years] and for Male subsets 54.6 [range 23 - 87 years]
Among the various baseline characteristics, there were no significant differences between the history of past cerebrovascular accident, dyslipidemia, diabetes mellitus. Significant difference was observed in the incidence of hypertension, family history of coronary artery disease and renal failure defined by the CKD EPI [Chronic Kidney Disease EPI demiology collaboration equation 1] formula. All the patients who had renal dysfunction were having diabetes and hypertension.
Table 1: Basic characteristics
Females
310
Males 326
P value
CVA 16 [5.1%] 20 [6.1%] 0.58
Dyslipidemia 210 [67.7%] 207 [63.5%] 0.26
Hypertension 268 [86%] 167 63.5%] <0.0001
Diabetes Mellitus 113 [36.4%] 116 [35.5] 0.81
family history 101 [32.5%] 97 [29.7%] 0.0001
Smoking 64 [20.6%] 229 [70.2%] <0.0001
Suresh Madhavan et al JMSCR Volume 07 Issue 08 August 2019 Page 499 GRACE Scores and GLS Scores [Table 2]
Mean GRACE and GLS scores for female subset were 135.7&-14.8 [standard deviation 5.22&1.18] and for males 207.4 &-15.8 respectively [standard deviation 7.63&2.059]. There was significant difference in the GRACE score between the females &males, with a p value <0.0001. Same significance noted between both sexes in GLS score too. Within a particular GRACE score risk group, there was no significant difference between the mean GRACE score between both sexes, but
showed significant difference in GLS scores between them. 85.2% of females fell in to low or moderate GRACE score group, where as only 36% of males were in the same risk groups. [p value <0.0001]. The mean GLS score in GRACE mild risk group were -16.4 in females and -19.2 in males. The mean GLS score in GRACE moderate risk group were -14.9 in females and -17.6 in males. The GLS in GRACE high risk group were -9.6 in females and -14.5 in males.
Table 2 GLS scores across GRACE groups GRACE
GROUPS
sex No: Mean GRACE
score
Statistical significance
Mean GLS score
Statistical significance group 1
[ <100]
F M
148 36
98.2 98.6
P=0.056 -16.4
-19.2
P<0.0001
group 2 [ 100 to 170]
F M
116 84
153.3 154
P=0.56 -14.9
-17.6 P<0.0001
group 3 [ >170]
F M
46 206
212.4 248.2
P<0.0001 -9.6
-14.5
P<0.0001
TOTAL
F M
310 326
135.7 207.4
-14.8 -15.8
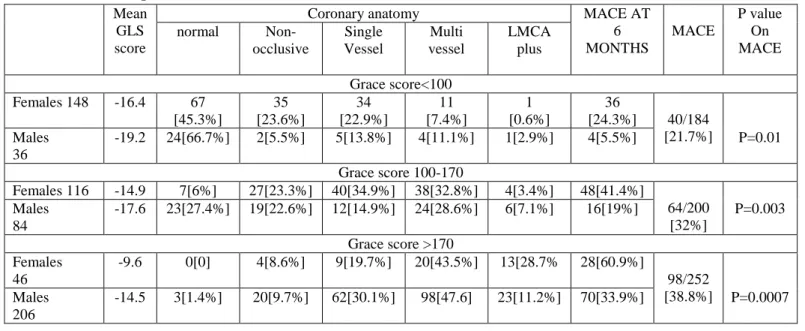
Follow up at 6 months in relation to grace score [Table 3]
The GLS score in GRACE mild risk group were -16.4 in females and -19.2 in males. Noted significant difference between females [24.3%] and males [5.5%] in MACE, with a p value of 0.01.The GLS score in GRACE moderate risk group were -14.9 in females and -17.6 in males.
There was significant difference between females [41.4%] and males [21.4%] in the MACE; with a p value of 0.003.The GLS SCORE in GRACE high risk group were -9.6 in females and -14.5 in males. Significant difference was observed in the MACE in females [60.9%] and males [33.9%], with a p value of 0.0007.
Table 3: Follow up data 6 months based on Grace Score Mean
GLS score
Coronary anatomy MACE AT
6 MONTHS
MACE
P value On MACE
normal
Non-occlusive
Single Vessel
Multi vessel
LMCA plus
Grace score<100
Females 148 -16.4 67
[45.3%]
35 [23.6%]
34 [22.9%]
11 [7.4%]
1 [0.6%]
36
[24.3%] 40/184
[21.7%] Males
36
-19.2 24[66.7%] 2[5.5%] 5[13.8%] 4[11.1%] 1[2.9%] 4[5.5%] P=0.01
Grace score 100-170
Females 116 -14.9 7[6%] 27[23.3%] 40[34.9%] 38[32.8%] 4[3.4%] 48[41.4%]
64/200 [32%] Males
84
-17.6 23[27.4%] 19[22.6%] 12[14.9%] 24[28.6%] 6[7.1%] 16[19%] P=0.003
Grace score >170 Females
46
-9.6 0[0] 4[8.6%] 9[19.7%] 20[43.5%] 13[28.7% 28[60.9%]
98/252 [38.8%] Males
206
Suresh Madhavan et al JMSCR Volume 07 Issue 08 August 2019 Page 500 Coronary Angiography [Table 4 &5]
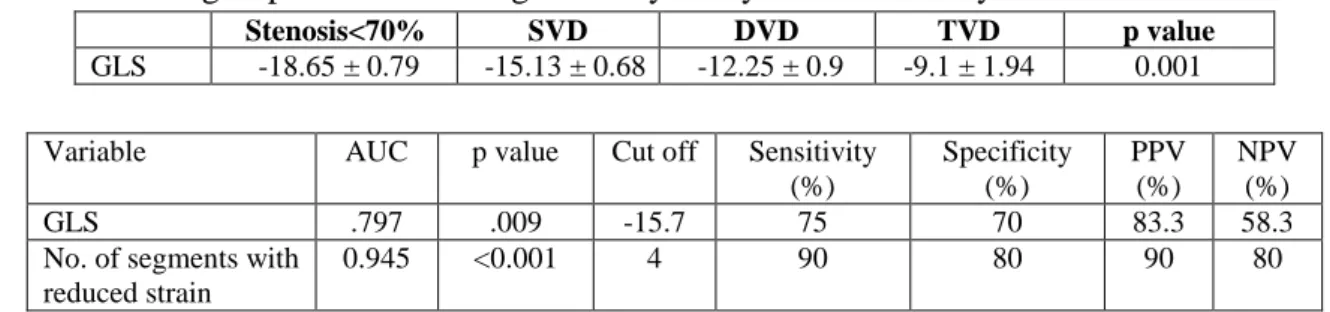
The coronary angiograms reports were analysed and correlated with underlying GLS score. Incidence of reduced GLS was more in patients who had significant occlusion in at least one coronary artery .Thus the optimal cut off value of LVGLS for prediction of significant CAD in the study population was found as ≥-15.7 (AUC 0.797, p value 0.009). The sensitivity, specificity and positive predictive value [PPV] of GLS for detecting significant CAD were 89%, 70%, and 83.3% respectively. An area of 4 or more adjacent dysfunctional segments had the best ability to identify patients with significant coronary occlusion (Area under Curve 0.945, p value <0.001, sensitivity 90%, specificity 80% and PPV 90%).
GRACE score correlated well with the underlying occlusive coronary artery disease and MACE. In
the low risk GRACE group ,there was more number of normal coronaries and more number of non occlusive coronary artery diseases like ectatic coronaries, slow flow, myocardial bridging etc. In 323 patients who had GLS score≥-15.7, the occurrence of occlusive CAD as well as MACE were higher compared to those with GLS score<-15.7, with a p value of < 0.0001. The mean GRACE score of both the groups had no significant difference, showed that GLS score had an added advantage of predicting MACE. In order to find any gender based difference in the predictive utility of the GLS score, both sexes were separately analysed. In females who had GLS score ≥-15.7, the incidence of CAD as well as MACE was significantly higher compare to those with GLS <-15.7. The GRACE score for the groups were having no significant difference.
Table 4 Coronary Angiography
GLS NO: MEAN
GRACE
CORONARY
ANATOMY MACE
NORMAL CAD
FEMALES 310
≥-15.7 211 142.6 32[15.2%] 179[84.2%] 98[46.4%]
<-15.7 99 120.9 42[42.4%] 57[57.6%] 14[14.1%]
Significance P<0.0001 P<0.0001 P<0.0001
MALES 326
≥-15.7 112 220.2 11[9.8%] 101[90.1% 38[33.9%]
<-15.7 214 201 39[18.2%] 175[81.7%] 52[24.3%
Significance P<0.04 P<0.04 P<0.06
Table 5: Data across groups with increasing coronary artery disease severity
Stenosis<70% SVD DVD TVD p value
GLS -18.65 ± 0.79 -15.13 ± 0.68 -12.25 ± 0.9 -9.1 ± 1.94 0.001
Variable AUC p value Cut off Sensitivity
(%)
Specificity (%)
PPV (%)
NPV (%)
GLS .797 .009 -15.7 75 70 83.3 58.3
No. of segments with reduced strain
0.945 <0.001 4 90 80 90 80
Mace at 6 Months Based on GLS Score [Table 6] 72.6% of the females and 32.7% of the males were having a GLS score of ≥-15.7, significance showing a p value of <0.0001. Noted significant difference between females and males in MACE in this group, with a p value of 0.02.
Of the remaining patients, 27.4% of the females and 67.2 % of the males were having a GLS score
Suresh Madhavan et al JMSCR Volume 07 Issue 08 August 2019 Page 501
Table 6: Follow up [6 months] analysis based on GLS score alone GLS scores G R A C E SEX& NUMBER
Coronary anatomy MACE MACE
TOTAL
P value Between
Each group
Normal Coronary artery disease
Non occlusive
SVD MVD LMCA
PLUS
≥ -15.7 TOTAL 323[50.8%]
169.5 FEMALES
211[72.6%] 32 [15.2%] 40 [18.9] 65 [30.8%] 57 [27%] 17 [8.05%] 98 [46.4%] 136
[42.1%] P<0.0001
MALES 112[32.7%] 11 [9.8%] 17 [15.2%] 20 [17.9%] 38 [34%] 26 [23.2%] 38 [33.9%]
323 43[13.3%] TOTAL NUMBER 280 [86.7%] P=0.03
<-15.7 TOTAL 313 [49.2%]
181 FEMALES
99[27.4%] 42 [42.4%] 26 [26.3%] 18 [18.2%] 12 [12.1%] 1 [1.01%] 14 [14.4%] 66 [21.1] MALES 214[67.2%] 39 [18.2%] 24 [11.2%] 59 [27.6%] 88 [41.1%] 4 [1.8%] 52 [24.3%]
313 81[26.7%] TOTAL NUMBER WITH CAD 222
[73.3%] P=0.04 TOTAL 636 FEMALES 310 74 [23.8%] 66 [21.3%] 83 [26.8%] 69 [22.3%] 18 [5.8%] 112 [36.1%] 202 [31.8%] P=0.02 MALES 326 50 [15.3%] 41 [12.6%] 79 [24.2%] 126 [38.7%] 30 [9.2%] 90 [27.6%] P=0.0001 Discussion
As per various studies including the INTERHEART studies22 Indian population is at risk for coronary artery disease at least a decade earlier than the rest of the world19-20. Compared with results of the community based trials by Krishnan et al19,20, the incidence of conventional risk factors in our study was much higher. Among the various risk factors higher incidence of metabolic syndrome, untreated hypertension and renal dysfunction were noted in females. Even after diagnosis of risk factors, majority of the females had no proper medications or regular follow up/life style modifications suggesting possible gender inequality in getting treatment even in an educated society like Kerala. The global longitudinal strain values were expected to be more negative for females considering less thickness of the ventricular myocardium. But in the present study, we noted that females with NSTEMI are having less negative values of GLS SCORE compared to male counterparts. There was significant difference in the mean GLS scores between males and females belonging to same GRACE risk group. Higher incidence of untreated Hypertension, renal dysfunction, increased heart
rate on index admission and underlying coronary artery disease could have resulted in the adverse GLS SCORE in females with NSTEMI. As expected, there was a good correlation with GRACE score and the in-hospital &6 months follow up mortality and MACE. When the GLS scores were < -15.7, the mortality and MACE were similar in males and females. Irrespective of the GRACE scores, when the GLS score was ≥15.7, the mortality and MACE were significantly higher, especially in females. Thus by considering the GLS score in addition to the GRACE score in NSTEMI, we can identify more patients who are at risk. The timing of angiography and revascularisation strategy differed a lot depending upon physician’s discretion, patient’s angina symptoms and patient’s wish to undergo the same. It was an expected finding that those who underwent coronary revascularisation had less mortality and MACE.
Suresh Madhavan et al JMSCR Volume 07 Issue 08 August 2019 Page 502 chest or upper abdomen, dizziness, sweating,
vague fullness or fatigue, where as majority of the males presented with classical angina. Female subsets were less likely to have an electrocardiogram when they had cardiac symptoms. Females received suboptimal and less-aggressive therapy for already established coronary risk factors like hypertension and diabetes. As a result renal dysfunction was more prevalent in females. These factors might have lead to less negative GLS scores in females compared to males. For the same comparable GRACE scores, females outnumbered males in mortality and MACE. The male subsets underwent more coronary revascularisation than female counterpart even though the suggestions for coronary angiography and revascularisation were given with equal importance to both. This gender bias was widened when the age was above 65 years, where the female patients and their immediate relatives preferred for intensive medical therapy over an invasive strategy.
Implications of the study
From this study we assume that the GLS SCORE values have more predictive power for adverse cardiac events in female patients even if they belonged to mild or moderate GRACE risk score groups. Compared to STEMI where primary angioplasty is accepted worldwide, there is no streamlined pattern for early invasive strategy in NSTEMI. Anginal symptoms were the main reason for early invasive strategy in our study. Even though the GRACE score is a prospectively studied scoring system to risk stratify patients with diagnosed ACS to estimate their in-hospital and 6 months to 3 year mortality, angina symptoms were not considered. Unlike in STEMI, treating physicians resorted primarily to angina symptoms in early angiography and revscularisation, whether the patient belonged high or low coronary risk scores. In such scenario simple echocardiographic GLS SCORE assessment can be of great value in decision making. CAD in females should be recognised as
a major public health issue so that outcomes can be improved in future with timely medical management. The atypical presentations, the unique risk factors including psycho social background and more frequent normal coronaries on angiography should be kept in mind. More studies are needed to explore these gender-related differences so that optimal gender-specific diagnostic and management strategies can be developed.
Limitations of the study
Being a single centre study, the results cannot be extrapolated to the general population or all routine patients admitted with NSTEACS. Being a tertiary care hospital, patients with more comorbid factors were referred to our institution, which could have been the reason for increased morbidity and mortality in our study, especially the female subsets. Same reasons were possible explanation for the less negative GLS scores across the female subsets. The exact timing of arrival after the onset of symptoms varied in different patients. The treatment strategy was purely decided by the treating physician based on the clinical symptoms predominantly angina, which is not considered in the GRACE scoring system. The timing of angiography and revascularisation varied in different patients depending on the symptoms, physicians’ discretion and patient’s wish. Similarly the effects of individual drugs that can have effect on ventricular after load, those which can affect the global strain were not studied.
Conclusion
Suresh Madhavan et al JMSCR Volume 07 Issue 08 August 2019 Page 503
References
1. Ramjane Khalill MD, Lei Han MD, Chang Jing PhD, He Quan PhD The use of risk scores for stratification of non-ST elevation acute coronary syndrome patients Exp Clin Cardiol Vol 14 No 2 2009]
2. Gong IY, Goodman SG, Brieger D, Gale CP, Chew DP, Welsh RC, Huynh T, De Young JP, Baer C, Gyenes GT, Udell JA, Fox KAA, Yan AT; Canadian GRACE/ GRACE-2 and CANRACE Investigators: GRACE risk score: Sex-based validity of in-hospital mortality prediction in Canadian patients with acute coronary syndrome. Int J Cardiol. 2017 Oct 1; 244:24-29.
3. GRACE Score Validation in Predicting Hospital Mortality: Analysis of the Role of sex: De-Miguel-Balsa Eva, Latour-Pérez Jaime, Baeza-Román Anna, Amorós-Verdú Cristina, Fernández-Lozano Juan Antonio, and the ARIAM-SEMICYUC group. Journal of Women's Health. May 2017, 26(5): 420-425.
4. Munk K, Andersen NH, Nielsen SS, et al. GLS by speckle tracking for infarct size estimation. Eur J Echocardiogr 2011; 12:156–65.
5. Lang RM, Bierig M, Devereux RB, et al. Recommendations for chamber quantification. Eur J Echocardiogr 2006; 7:79–108.
6. Nesbitt GC, Mankad S, Oh JK. Strain imaging in echocardiography: methods and clinical applications. Int J Cardiovasc Imaging 2009; 25(Suppl 1):9–22
7. Stanton T, Leano R, Marwick TH. Prediction of all-cause mortality from global longitudinal speckle strain: comparison with ejection fraction and wall motion scoring. CircCardiovasc Imaging 2009; 2:356–64.
8. Ersboll M, Valeur N, Mogensen UM, et al. Prediction of all-cause mortality and heart
failure admissions from global left ventricular longitudinal strain in patients with acute myocardial infarction and preserved left ventricular ejection fraction. J Am Coll Cardiol 2013; 61:2365–73. 9. A Test in Context: Myocardial Strain
Measured by Speckle-Tracking Echocardiography Patrick Collier, MD, PHD, Dermot Phelan, MD, PHD, Allan Klein, MD vol69,no:8,2017 J Am Coll Cardiolhttp://dx.doi.org/10.1016/j.jacc.201 6.12.012
10.Eek C, Grenne B, Brunvand H, Aakhus S, Endresen K, Hol PK, Smith HJ, Smiseth OA, Edvardsen T, Skulstad H. Strain echocardiography and wall motion score index predicts final infarct size in patients with non-ST-segment-elevation myocardial infarction. Circ Cardiovasc Imaging 2010; 3:187-94
11.Grenne B, Eek C, Sjoli B, Skulstad H, Aakhus S, Smiseth OA, Edvardsen T, Brunvand H. Changes of myocardial function in patients with non-ST-elevation acute coronary syndrome awaiting coronary angiography. Am J Cardiol 2010; 105:1212-8.
12.Picano E, Lattanzi F, Orlandini A, Marini C, L’Abbate A. Stress echocardiography and human factor: the importance of being expert. J Am Coll Cardiol 1991; 17:666-9. 13.Urheim S, Edvardsen T, Torp H, Angelsen
B, Smiseth OA. Myocardial strain by Doppler echocardiography: validation of new method to quantify regional myocardial function. Circulation 2000; 102:1158-64.
14.Edvardsen T, Helle-Valle T, Smiseth OA. Systolic dysfunction in heart failure with normal ejection fraction: speckle-tracking echocardiography. Prog Cardiovasc Dis 2006; 49:207-14.
Suresh Madhavan et al JMSCR Volume 07 Issue 08 August 2019 Page 504 echocardiography. Prog Cardiovasc Dis
2006; 49:207-14.
16.Thibault H, Derumeaux G. Assessment of myocardial ischemia and viability using tissue Doppler and deformation imaging: the lessons from the experimental studies. Arch Cardiovac Dis 2008; 101:61-78. 17.Wang J, Khoury DS, Yue Y,
Torre-Amione G, and Nagueh SF. Preserved left ventricular twist and circumferential deformation, but depressed longitudinal and radial deformation in patients with diastolic heart failure. Eur Heart J 2008; 29:1283-9.
18.Chan J, Hanekom L, Wong C, Leano R, Cho GY, Marwick TH. Differentiation of subendocardial and transmural infarction using two-dimensional strain rate imaging to assess short-axis and long-axis myocardial function. J Am CollCardiol 2006; 48:2026-33.
19.Prevalence of coronary artery disease andits risk factors in Kerala, South India: a community-based cross-sectional study :M. N. Krishnan, G. Zachariah, K. Venugopal, P. P. Mohanan, S. Harikrishnan, G. Sanjay, L. Jeyaseelan, K. R. Thankappan .BMC Cardiovascular Disorders (2016) 16:12
20.M.N. Krishnan, Coronary heart disease and risk factors in India,on the brink of an epidemic? Indian Heart Journal 64 [2012]364e367
21.Teerapat Yingchoncharoen, MD Shikhar Agarwal, MD, MPH Zoran B. Popović, MD, PhD,Thomas H. MarwickNormal Ranges of Left Ventricular Strain: A Meta-Analysis, Journal of American Society of
Echocardiography, February 2013,
Volume 26, Issue 2, Pages 185–191
![Table 6: Follow up [6 months] analysis based on GLS score alone GLS scores G R A C E SEX& NUMBER](https://thumb-us.123doks.com/thumbv2/123dok_us/7948439.2112271/6.892.31.880.92.506/table-follow-months-analysis-based-score-scores-number.webp)
