M E T H O D O L O G Y A R T I C L E
Open Access
FMLRC: Hybrid long read error correction
using an FM-index
Jeremy R. Wang
1*†, James Holt
2†, Leonard McMillan
2and Corbin D. Jones
3Abstract
Background: Long read sequencing is changing the landscape of genomic research, especiallyde novoassembly. Despite the high error rate inherent to long read technologies, increased read lengths dramatically improve the continuity and accuracy of genome assemblies. However, the cost and throughput of these technologies limits their application to complex genomes. One solution is to decrease the cost and time to assemble novel genomes by leveraging “hybrid” assemblies that use long reads for scaffolding and short reads for accuracy.
Results: We describe a novel method leveraging a multi-string Burrows-Wheeler Transform with auxiliary FM-index to correct errors in long read sequences using a set of complementary short reads. We demonstrate that our method efficiently produces significantly more high quality corrected sequence than existing hybrid error-correction methods. We also show that our method produces more contiguous assemblies, in many cases, than existing state-of-the-art hybrid and long-read onlyde novoassembly methods.
Conclusion: Our method accurately corrects long read sequence data using complementary short reads. We demonstrate higher total throughput of corrected long reads and a corresponding increase in contiguity of the resultingde novoassemblies. Improved throughput and computational efficiency than existing methods will help better economically utilize emerging long read sequencing technologies.
Keywords: de novo assembly, Hybrid error correction, Long read, Pacbio, BWT, FM-Index
Background
De novo genome assembly has benefitted dramatically from the introduction of so-called “long” read sequencing technologies. These technologies, such as SMRT ing by Pacific Biosciences (Pacbio) and nanopore sequenc-ing platforms by Oxford Nanopore Technologies, produce reads typically 10s of kilobases instead of hundreds of bases. These reads can span repetitive or low-complexity regions of the genome previously unresolvable using only “short”-read next-generation sequencing. Unfortunately, the relatively high error rate of these long-read technolo-gies introduces new informatics and analysis challenges. Effective and efficient methods are necessary to correct these errors in order to realize the potential of these long reads for whole genome assembly [1–4].
*Correspondence:[email protected] †Equal contributors
1Department of Genetics, University of North Carolina at Chapel Hill, CB 3280, 3144 Genome Sciences Building, 250 Bell Tower Dr, Chapel Hill, 27599, NC, USA Full list of author information is available at the end of the article
As the size of long read datasets and genomes undergo-ingde novoassembly increases, the performance of hybrid long read correction and assembly methods becomes increasingly important. For genomes of more complex eukaryotes and mammals, the computational resources required for effective de novo assembly are staggering and difficult to coordinate. This is driven largely by the pairwise overlap step required by all modern long read assemblers. The time required to overlap these long reads with one another increases quadratically relative to the number of reads. While novel methods such as MHAP [5] and Minimap [6] aim to improve this, in practice, the computational time and memory required are often prohibitively expensive.
Pre-assembly correction dramatically simplifies the sub-sequent overlap and layout of long reads for assembly by reducing the variance that must be accounted for in the overlapping step. In particular, long reads having under-gone error correction are likely to share much longer identical stretches that can be used to efficiently find
confidently overlapping reads. Fundamentally, the longer and more accurate these corrections are, the more quickly and accurately the long reads can be assembled.
Long read correction algorithms can be broadly clas-sified as either self-correction or hybrid correction algo-rithms. Self-correction algorithms correct long reads using only other long read sequences. Self-correcting algorithms, including Sprai [7], LoRMA [8], HGAP [1], and PBcR [3] align the long reads to each other and gener-ate a consensus sequence. In order to genergener-ate an accurgener-ate consensus, these methods require relatively high cover-age of long read sequence to overcome the high error rate. Unfortunately, the relatively high cost peraccurate nucleotide for long-read sequencing technologies means that deep sequencing using only long reads is expensive.
In contrast, hybrid correction algorithms use short-read sequencing of the same sample to complement and correct the long reads. Short-read sequencing has fewer sequencing errors, costs less per base sequenced, and thus the cost per accurate nucleotide is much lower. Many hybrid error correction methods act similar to scaffold-ers in that they require the assembly of complementary short read data first, then alignment between long reads and short-read unitigs or contigs. These approaches, while reasonably effective, suffer from two classes of problems. First, they incur the same type of disadvantages a short-read only assemblies in that low-complexity and repetitive elements larger than the size of the short reads cannot be reliably resolved. When short reads are preassembled, this bias can “correct” long read with incorrect sequence, confounding assembly. Second, short read assembly fol-lowed by pairwise alignment/overlap of long reads with short-read contigs is often significantly slower than direct long-read error correction.
Hybrid correction algorithms include LoRDEC [4], ECTools [9], Jabba [10], CoLoRMap [11], and Nanocorr [12]. Other methods, including Cerulean [13], DBG2OLC [14], and hybridSPAdes [15] perform hybrid assembly of long- and short-read data but do not explicitly correct errors in the long-read sequences. These hybrid methods are often able to construct more accurate and contiguous assemblies than exclusively long-read assembly methods at substantially lower cost. ECTools [9] and Nanocorr [12] are based on the same underlying methodology, but designed for Pacbio and nanopore sequences, respectively. They perform a full alignment between short and long reads, but are currently deprecated and take prohibitively long to run for anything larger than microbial genomes, so they were not considered further.
For error correction or assembly methods to be use-ful for large, complex genomes that are biomedically or economically important, the key challenge is performing as accurate an assembly as possible, as quickly as possi-ble, and using as few computational resources as possible.
Current methods often require prohibitively large com-putational resources. Given that finding the appropriate parameters for an assembly is often an iterative process, these high computational costs are a barrier.
Methods
We introduce a new hybrid method for correcting errors in long-read sequences called FM-index Long Read Corrector (FMLRC). The main contribution of our method is the application of an FM-index built from a multi-string Burrows-Wheeler Transform (BWT) [16] of the short-read sequencing datasets. The FM-index enables arbitrary length k-mer searches through the dataset, allowing for FMLRC to retrieve k-mer frequen-cies from the short-read dataset in O(k) steps. Unlike other data structures, the length of k is not fixed dur-ing construction of the FM-index but is instead selected at run-time. As a result, FMLRC uses the FM-index to implicitlyrepresentallde Bruijn graphs [17] of the short-read sequencing dataset. These de Bruijn graphs are then used to correct regions in the long reads that are not supported by the short-read sequencing dataset.
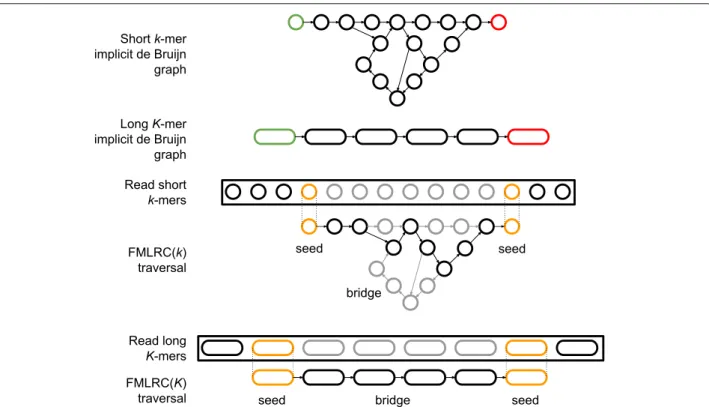
Two secondary contributions arise as a result of the first. FMLRC uses the single FM-index data structure to perform two correction passes over each read: first with a shortk-mer and second with a longerK-mer. Secondly, the specific parameters of the correction algorithm are dynamically adjusted to match thek-mer frequencies for a given read at run-time. FMLRC takes as input a BWT of the short-read sequencing dataset. It constructs a single FM-index in memory that is shared across all processes. Each process individually corrects one read at a time by applying common de Bruijn graph correction methods (namely seed-and-extend or seed-and-bridge) using the shared FM-index. These de Bruijn correction methods require both a k-mer size and frequency thresholds to determine whether a k-mer is present in the graph. FMLRC dynamically adjusts these thresholds at run-time for each pass over a long read. A single process will correct the read using the implicit shortk-mer de Bruijn graph and then the implicit longK-mer de Bruijn graph before writing the corrected result to disk. An overview of this approach is shown in Fig.1.
FMLRC is a publicly available C++ program1. The implementation requires construction of a BWT of the short-read dataset in the run-length encoded format of the msbwt package2.
Advantages of the FM-index
Fig. 1Illustration of the seed-and-bridge correction strategy using short and longk-mers.Implicitde Bruijn graphs with arbitrarykcan be inferred from an FM-index. The use of a short, fixedkoften does not resolve “hairball” and other structures in the graph caused by low-complexity and repetitive genomic elements. LongerK-mers may dramatically simplify the bridging step if sufficiently long seeds can be found. Illustrative seed-and-bridge paths are shown for shortk-mer and longK-mer graphs. Seedk-mers are shown in orange, and the correct path in black. The two-pass (k,K) seed-and-bridge correction implemented in FMLRC allows the correction of short, nonrepetitive segments in the first pass, then seeding largerK-mers and bridging to resolve more complex sequences
a fixedk-mer size and pruning threshold to be defined during the construction of the de Bruijn graph [17].
The main advantage of FMLRC is that it uses an FM-index as the underlying de Bruijn graph implementation. FMLRC builds an FM-index [18] from a BWT [19] of a short-read sequencing dataset to correct a long-read sequencing dataset. These data structures have been pre-viously used for short-read self-correction in FMRC [20], but it has not been previously applied to long-read error correction.
The FM-index is advantageous because many of the correction parameters are not properties of the data struc-ture itself and can instead be defined and/or dynamically adjusted at run-time. First, FM-index queries are not fixed to a singlek-mer size, allowing FMLRC to construct one FM-index and use it for allk-mer queries. Secondly, the FM-index is built from a BWT that is a lossless encod-ing of the original reads, meanencod-ing that no k-mers are “pruned” as they commonly are in a de Bruijn graph. This pruning is usually accomplished by removing allk-mers with a frequency less than a fixed threshold. Instead, FMLRC dynamically calculates thresholds for each long read and decides whether a k-mer is “pruned" at run-time. The combination of these two properties means the
FM-index implicitly representsallde Bruijn graphs for the short-read sequencing dataset.
FMLRC creates an in-memory FM-index by scanning the BWT from disk. There are many different imple-mentations of in-memory FM-indices that have varying trade-offs between memory usage and CPU time to per-form ak-mer lookup. FMLRC currently has two FM-index implementations. The default FM-index implementation uses bit arrays and rank operations to enable fastk-mer lookups. This primary implementation sacrifices memory usage to increase computational performance. The second index implementation is a traditional sampled FM-index that allows users to set the sampling rate, leading to longer computations with a smaller memory footprint. The two FM-index implementations produce identical corrected read results, and we present only the results from the primary implementation in our performance results.
is actually querying both the forward and reverse-complement sequences and adding their frequencies together prior to performing any checks.
De Bruijn graph-based correction
FMLRC accesses implicit, pruned,k-mer de Bruijn graphs through the FM-index. While the de Bruijn graph-based correction of FMLRC is similar to that of LoRDEC [4], we briefly describe it here for completion and for refer-ence in the following sections. Given a long read and a de Bruijn graph, the first step is to classify allk-mers in the long read as eitherweakorsolid. In general,solid k-mers are supported by the de Bruijn graph andweak k-mers are not. For eachk-mer in the long read, itsk-mer frequency is retrieved from the de Bruijn graph. If that frequency is below a threshold,t, it is consider weak and otherwise it is considered solid. Weak regions are consecutive weak k-mers in the long read. Solid regions are consecutive solidk-mers in the long read.
Weak regions can be flanked by zero, one, or two solid regions. If a weak region has no flanking solid regions, the entire read is one large weak region with no solidk-mers to initialize a traversal of the de Bruijn graph. As a result, these reads are not changed because there are no start points for a de Bruijn graph traversal.
If a weak region has one flanking solid region, then it is either a head or tail weak region in the read. In either case, the solidk-mer closest to the weak region is used as a “seed”k-mer for traversing the de Bruijn graph. FMLRC performs a depth-first traversal of the de Bruijn graph from this seed using an expected path length based on the size of the weak region and returns any found paths (seed-and-extend). If a weak region has two flank-ing solid regions, FMLRC uses the two closest k-mers from each solid region as “seed” and “target”k-mers (seed-and-bridge). FMLRC then performs a depth-first traversal from the seedk-mer and returns any paths that connect to the targetk-mer. If no path is found, FMLRC attempts to extend backwards from the target to the seedk-mer, which may resolve additional bridges that have exces-sive branching close to the seedk-mer. If any paths are returned from a de Bruijn graph traversal, the paths are compared to the original weak region and the one with the smallest edit distance is chosen to replace it. If no paths are returned, then no change is made to the long read at that region. In all de Bruijn graph traversals, we prevent exponential traversal time by enforcing a branching limit, L. Typically, the parameters t andL are either constant values in a program or user-defined static values.
Differences in the short and long passes
One of the key differences in FMLRC compared to other approaches is that it accesses two different de Bruijn graphs though the FM-index and dynamically adjusts the
parameters of the correction algorithm to adjust for dif-ferences in the graphs. FMLRC performs two passes: the first with a shortk-mer size and the second with a longer K-mer size. For FMLRC, the two passes are program-matically identical with the value of k orK passed as a parameter. For brevity, we describe the differences in each pass using parameter k noting that replacing k with K describes the second pass of our method. Additionally, we describe any dynamic variables as functions ofk, the implicit k-mer de Bruijn graph, and other user-defined constants.
In general, the short k-mer pass does the majority of the correction for FMLRC, whereas the longerK-mer pass tends to correct repetitive, low-complexity regions within the long read. To provide some intuition behind why the long pass improves the results, we focus on the differ-ences in de Bruijn graphs representing the same data but with two differentk-mer lengths. In general, two distinct paths will be merged in ak-mer de Bruijn graph if they share a pattern that is at leastklong. This is because the nodes along that shared region will be identical. At the ends of the shared region, there will be two paths emerg-ing representemerg-ing the differences at the edge of the shared regions.
When the same sequences are viewed through a longer K-mer de Bruijn graph, the number of merged, ambigu-ous paths strictly decreases because an increasing amount of similarity is required for the paths to become merged in the graph. This effect is illustrated in Fig.1. In practice, shortk-mers are often long enough to uniquely identify most areas of the genome. However, genomic charac-teristics such as low-complexity sequence, gene families, or repeat regions are difficult to traverse using short k-mers. Thus, our method uses the largerK-mer to bridge weak regions composed of repeated or low-complexity sequences that are computationally expensive to fully tra-verse using a smallk-mer.
or solidk-mers based on an absolute minimum and the surroundingk-mer frequencies from the long read.
For low-coverage short-read datasets, it is often the case that t = T because F ∗ m < T. For high-coverage short-read datasets, this dynamic threshold alleviates the need to select a fixed threshold beforehand, and it instead uses counts from the implicit de Bruijn graph to derive an expected count for k-mers in the read. Additionally, this approach enables FMLRC to adjust the threshold for different sizes ofkautomatically at run-time.
Finally, the branch limit,L, is scaled with each pass to allow for less branching whenkis small and more branch-ing when K is large. As described earlier, a smallk-mer de Bruijn graph will have more branches and may require more computation to do a full depth-first traversal in repetitive regions. To avoid this, we restrict the shortk -mer traversals to primarily fixes the “easy” errors caused by sequencing. As a result, the “harder” traversals caused by larger repetitive elements are addressed more accu-rately by the longK-mer pass. The branch limit factor,B, is a user defined parameter such that the maximum branch limit,L=B∗k.
FMLRC parameter selection
FMLRC allows for five main parameters to be defined by the user:T,F,B,k, andK.T is the absolute minimum fre-quency required for ak-mer to be considered solid in the de Bruijn graph. F is the fraction of the median counts required for ak-mer to be considered solid in the de Bruijn graph.Bis the branch limit factor that limits the amount of computation of a de Bruijn graph traversal. In all test cases, we used the FMLRC default parameters: T = 5, F=0.10, andB=4.
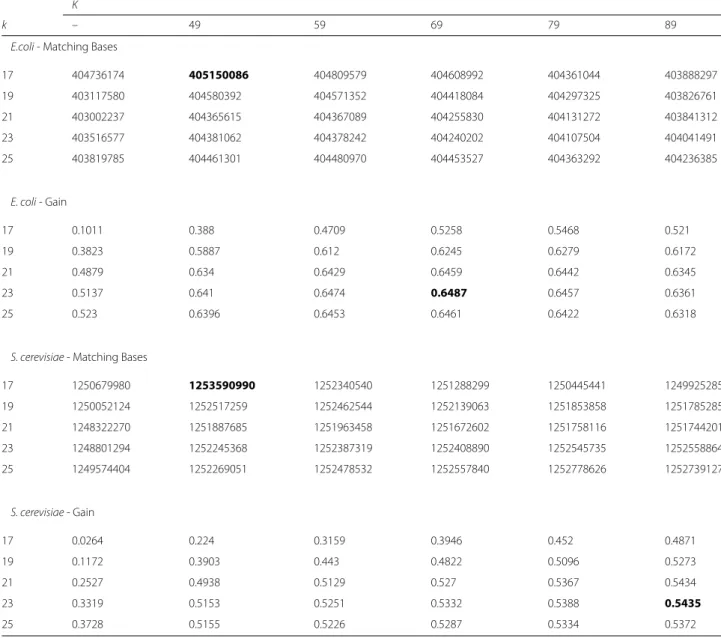
The last two parameters are the choice of k and K for the short and long correction passes. To gain some insight into what values ofkandKare best, we ran mul-tiple tests using theE. coliK12 MG1655 andS. cerevisiae W303 datasets. We allowedk = [17, 19, 21, 23, 25] and K=[−, 49, 59, 69, 79, 89], leading to a total of 30 test cases for each dataset. The test cases with K = − indicate that no second K-mer pass was performed (it is only using a one-pass, shortk-mer for correction). For each test case, we ran FMLRC, aligned the corrected reads to the reference genome, and then gathered statistics on the resulting alignment. We counted the the total number of bases that matched the reference genome and the “gain” (see “Correction accuracy” section). The results of this experiment are shown in Table1.
We see that askandKincrease, gain generally increases but the total number of matching bases decreases, indi-cating a tradeoff between sensitivity and specificity. In all of our tests, performing a second pass with the longK -mer always improved all three statistics. In general, the gain begins plateauing around k = 21 and K = 59
and matching bases decreases in theE. colidataset, so we chose these as the default values for k and K. While it is clear that the “best”k andK is likely data-dependent because differences in coverage, sequencing quality, and sequencing content will impact the ability of FMLRC to find solidk-mers and perform corrections, these defaults perform close to optimal across all of our evaluated datasets.
Results
We evaluated the accuracy of our method using comple-mentary long- and short-read datasets for three species: E. coliK12,S. cerevisiaeW303, andA. thalianaLer-0 (see “Availability of data and material” section). We compared the relative correction accuracy and computational per-formance of our method to several existing hybrid and long-read-only correction methods. We also assessed the effectiveness of our corrected reads forde novoassembly using a non-correcting assembler, Miniasm [6], and com-pared these data to several other state-of-the-art hybrid and long-read-onlyde novoassembly methods.
Correction accuracy
To evaluate FMLRC, we used the approach used by the Error Correction Evaluation Toolkit (ECET) [23] to cal-culate error correction sensitivity, specificity, and “gain” relative to a known reference genome (Sensitivity = TP/(TP+FN),Specificity=TN/(TN+FP), andgain=
(TP − FP)/(TP+ FN) where TP, TN, FP, and FN are true positives, true negatives, false positive, and false neg-ative, respectively). We modified the published pipeline to work efficiently with long reads, but the statistics are computed in an similar manner. In particular, we aligned the original and corrected FASTA files to the correspond-ing reference genome for each organism uscorrespond-ing BLASR [22]. Using the original ECET implementation, which was designed for short-read sequences, specific loci in long reads could not be evaluated before and after error correc-tion due to the high incidence of short insercorrec-tions and dele-tions. Instead, we consider loci relative to the reference sequence to which each read aligned. A nucleotide is con-sidered “correct” if it aligns properly to a single nucleotide in the read sequence. Loci in the reference sequence with mismatched or delected nucleotides in the read sequence are considered incorrect. Our evaluation code is available athttps://github.com/txje/lrc_eval, including the computation of error correction statistics directly from BLASR’s−m5 format alignments.
Table 1ChoosingkandK
K
k – 49 59 69 79 89
E.coli- Matching Bases
17 404736174 405150086 404809579 404608992 404361044 403888297
19 403117580 404580392 404571352 404418084 404297325 403826761
21 403002237 404365615 404367089 404255830 404131272 403841312
23 403516577 404381062 404378242 404240202 404107504 404041491
25 403819785 404461301 404480970 404453527 404363292 404236385
E. coli- Gain
17 0.1011 0.388 0.4709 0.5258 0.5468 0.521
19 0.3823 0.5887 0.612 0.6245 0.6279 0.6172
21 0.4879 0.634 0.6429 0.6459 0.6442 0.6345
23 0.5137 0.641 0.6474 0.6487 0.6457 0.6361
25 0.523 0.6396 0.6453 0.6461 0.6422 0.6318
S. cerevisiae- Matching Bases
17 1250679980 1253590990 1252340540 1251288299 1250445441 1249925285
19 1250052124 1252517259 1252462544 1252139063 1251853858 1251785285
21 1248322270 1251887685 1251963458 1251672602 1251758116 1251744201
23 1248801294 1252245368 1252387319 1252408890 1252545735 1252558864
25 1249574404 1252269051 1252478532 1252557840 1252778626 1252739127
S. cerevisiae- Gain
17 0.0264 0.224 0.3159 0.3946 0.452 0.4871
19 0.1172 0.3903 0.443 0.4822 0.5096 0.5273
21 0.2527 0.4938 0.5129 0.527 0.5367 0.5434
23 0.3319 0.5153 0.5251 0.5332 0.5388 0.5435
25 0.3728 0.5155 0.5226 0.5287 0.5334 0.5372
This table shows the result of running FMLRC using many different values forkandKfor anE. coliandS. cerevisiaedatasets
The test cases withK= −indicate that no second pass of correction using the longK-mer was performed, so those test cases use a single pass shortk-mer only. After correcting the reads, we aligned the results using BLASR [22] and gathered statistics on the alignments. Matching bases indicates the number of matching bases across all mappings. Gain is defined as(TP−FP)/(TP+FN)(see “Correction accuracy” section). For each statistic, the best result is bolded in the above table. To summarize, increasing values forkandKtend to increase the gain but decrease the total matching bases - a tradeoff between sensitivity and specificity. Additionally, all tested values ofKfor a long K-mer pass improves the results over a singlek-mer pass
downstream analysis. For example, error correction meth-ods that agressively filter out low-quality sequences, such as Jabba [10], may report very high sensitivity and speci-ficity, but do so by reporting and aligning only a subset of the input sequences.
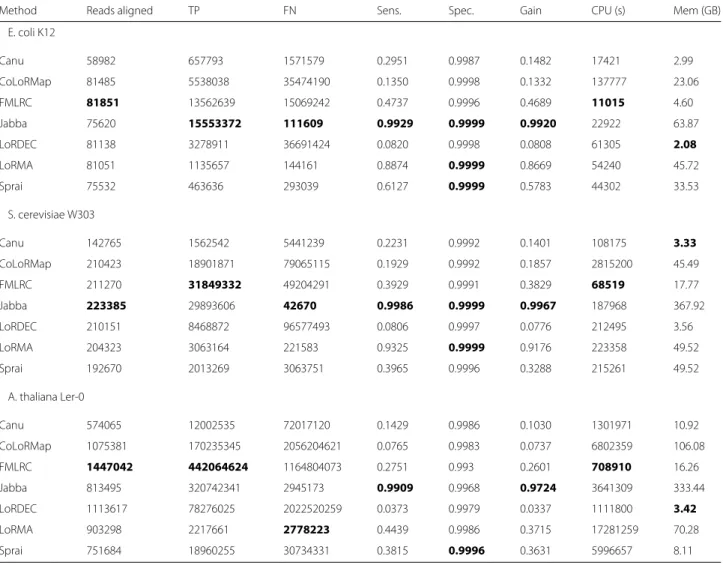
In addition to evaluating FMLRC, we also evaluated the following hybrid correction methods using the same ECET pipeline: LoRDEC [4], Jabba [10], and CoLoRMap [11]. For completeness, we also included comparison to long-read-only methods: Canu [5], LoRMA [8], and Sprai
[7]. For all tests, we ran LoRMA v0.4, LoRDEC v0.6 with options-k 21 -s 5, and Jabba with option-k 75 (as recommended in [10]). FMLRC was run with default parameters (-k 21 -K 59) forE. coli,S. cerevisiae, and A. thaliana. All other methods’ parameters were left at their defaults.
Table 2After aligning the corrected reads to a reference genome, sensitivity, specificity, and gain were computed
Method Reads aligned TP FN Sens. Spec. Gain CPU (s) Mem (GB)
E. coli K12
Canu 58982 657793 1571579 0.2951 0.9987 0.1482 17421 2.99
CoLoRMap 81485 5538038 35474190 0.1350 0.9998 0.1332 137777 23.06
FMLRC 81851 13562639 15069242 0.4737 0.9996 0.4689 11015 4.60
Jabba 75620 15553372 111609 0.9929 0.9999 0.9920 22922 63.87
LoRDEC 81138 3278911 36691424 0.0820 0.9998 0.0808 61305 2.08
LoRMA 81051 1135657 144161 0.8874 0.9999 0.8669 54240 45.72
Sprai 75532 463636 293039 0.6127 0.9999 0.5783 44302 33.53
S. cerevisiae W303
Canu 142765 1562542 5441239 0.2231 0.9992 0.1401 108175 3.33
CoLoRMap 210423 18901871 79065115 0.1929 0.9992 0.1857 2815200 45.49
FMLRC 211270 31849332 49204291 0.3929 0.9991 0.3829 68519 17.77
Jabba 223385 29893606 42670 0.9986 0.9999 0.9967 187968 367.92
LoRDEC 210151 8468872 96577493 0.0806 0.9997 0.0776 212495 3.56
LoRMA 204323 3063164 221583 0.9325 0.9999 0.9176 223358 49.52
Sprai 192670 2013269 3063751 0.3965 0.9996 0.3288 215261 49.52
A. thaliana Ler-0
Canu 574065 12002535 72017120 0.1429 0.9986 0.1030 1301971 10.92
CoLoRMap 1075381 170235345 2056204621 0.0765 0.9983 0.0737 6802359 106.08 FMLRC 1447042 442064624 1164804073 0.2751 0.993 0.2601 708910 16.26
Jabba 813495 320742341 2945173 0.9909 0.9968 0.9724 3641309 333.44
LoRDEC 1113617 78276025 2022520259 0.0373 0.9979 0.0337 1111800 3.42
LoRMA 903298 2217661 2778223 0.4439 0.9986 0.3715 17281259 70.28
Sprai 751684 18960255 30734331 0.3815 0.9996 0.3631 5996657 8.11
ForA. thalianaandS. cerevisiae, FMLRC produced more total true positive (corrected loci) than any other method while maintaining competitive sensitivity and gain. Methods with higher average specificity, notably Jabba, often discard a higher proportion of reads, reporting only those with the highest-confidence corrected sequence. FMLRC also requires significantly less CPU time than other hybrid error correction methods, and comparable memory. LoRDEC and FMLRC CPU time and memory resultsinclude construction of the BWT
E. coli, FMLRC corrects fewer loci than Jabba, but more total reads. As discussed above, methods with higher sensitivity and specificity - including LoRMA, Sprai, and Jabba - typically accomplish this by selectively reporting the highest-confidence corrected sequences. This kind of confidence filtering is possible after correction for most methods, but can negatively impact downstream assembly (see “De novoassembly” section).
Performance
CPU and memory usage for each method are shown in Table 2. Performance tests were run on a homogenous cluster of 120 compute nodes, each with two Intel E2680 (2.5GHz) processors and 1Tb RAM. FMLRC requires less CPU time (including construction of the general-purpose BWT) than all other hybrid correction methods. On
average, FMLRC’s memory usage is among the most memory-efficient methods, including Canu and LoRDEC. The remaining hybrid error-correction methods, CoLoRMap, LoRMA, and Jabba, use significantly more memory and, especially in the case of Jabba (>300GB) may prove prohibitive to run without significant computa-tional infrastructure. Jabba, in particular, while producing comparable total true positives to FMLRC, required 2−5×as much CPU time and 15−20×as much memory.
De novoassembly
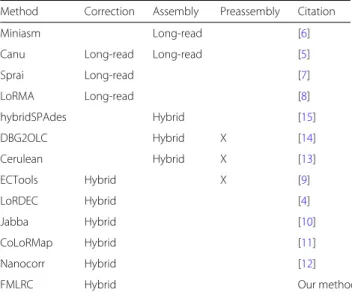
de novo assembly methods. We assessed the methods listed in Table3on theE. coli,S. cerevisiae, andA. thaliana datasets listed above. Our method, along with LoRDEC and Sprai, perform only read correction. We used Mini-asm (https://github.com/lh3/miniasmr159 and Minimap https://github.com/lh3/minimap r124) to assemble the corrected reads from these methods. We used option
−Sw5 for Minimap; all other parameters were left at their defaults. The straightforward approach to identity-based overlapping and graph layout used by Miniasm allows us to assess the effect of read correction onde novoassembly. All assemblies were run on a heterogeneous Linux-based cluster with more than 9600 cores and 48Gb-1Tb RAM per node. All jobs had a hard limit of 16 processes and 7 days wall-clock run time. For larger genomes such asA. thaliana, several methods, including hybridSPAdes and Cerulean, failed after exceeding these limits or exceeding 1Tb main memory. Canu is a modern fork of the Celera Assembler and consists of the basic PBcR correction method using the MHAP overlapper followed by assembly with HGAP. So we assess only the Canu pipeline as a whole.
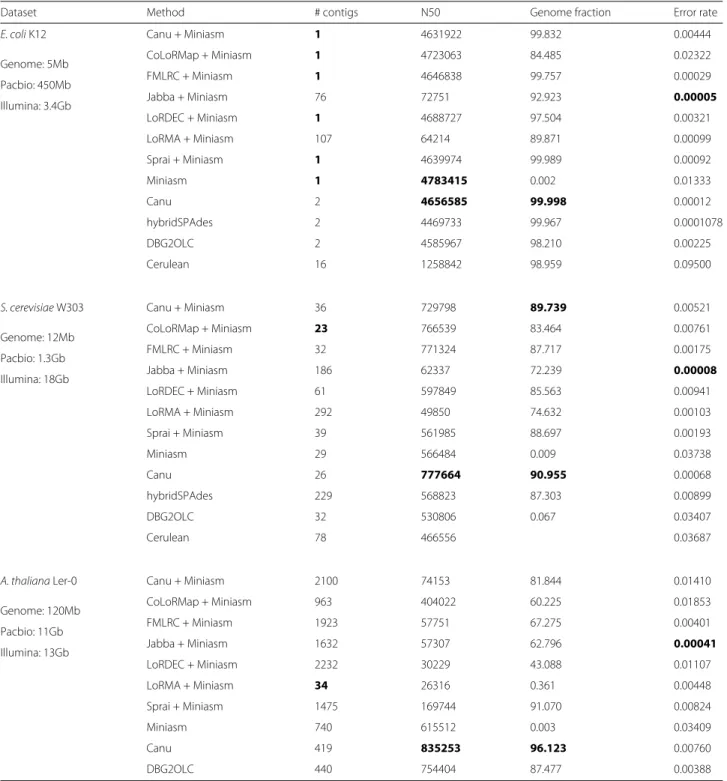
Several of the methods took prohibitively long (>1 week) or failed to assemble theA. thalianagenome. We analyzed completed assemblies using Quast v4.1 [24] with default parameters in Table 4. Percent error indi-cates the total of mismatched bases, insertions/deletions, and no-calls (Ns). As shown, FMLRC has comparable performance to other methods forE. coli K12. It also out-performs all methods except Canu in terms of N50 forS. cerevisiae W303. Although the continuity is often higher
Table 3Long-read and hybrid correction and assembly methods
Method Correction Assembly Preassembly Citation
Miniasm Long-read [6]
Canu Long-read Long-read [5]
Sprai Long-read [7]
LoRMA Long-read [8]
hybridSPAdes Hybrid [15]
DBG2OLC Hybrid X [14]
Cerulean Hybrid X [13]
ECTools Hybrid X [9]
LoRDEC Hybrid [4]
Jabba Hybrid [10]
CoLoRMap Hybrid [11]
Nanocorr Hybrid [12]
FMLRC Hybrid Our method
All of the compared methods are shown along with their mode of error correction and assembly, each either long-read only or “hybrid” using complementary short-read data. “Preassembly” indicates whether a hybrid method requires the short read data to be preassembled using a different method
for Canu and other long-read consensus methods, these typically rely on high coverage of long reads and degrade in performance as coverage drops. These test datasets contain high (> 100×) coverage of both long and short reads. Furthermore, post-assembly polishing steps such as Quiver [1] and Nanopolish [25] are typically effective in reducing the assembly error from less than 1% to less than 0.01%.
Discussion
Correction of errors in long read sequences using com-plementary short reads remains a popular method for increasing the utility of long read sequence, particularly since long read sequencing remains prohibitively expen-sive relative to standard NGS in many cases. While several methods exist for hybrid error correction and assembly [4,9–15], these approaches sometimes limit the utility of corrected sequences for downstream assembly or other applications due to low throughput - they report only segments where very high accuracy can be achieved or clip and trim low confidence sequences. These produce very polished (accuracy in excess of 99%) sequence, but reduce the total number and size of sequences available for assembly. In practice, a balanced approach is neces-sary to retain the long-range information while increasing sequence accuracy to aid in pairwise overlapping of reads. Our proposed method does not perform any clipping or trimming of long read sequences, but corrects errors using high-accuracy short read sequences, enabling more sensi-tive and specific overlap of reads duringde novoassembly. While no method produces obviously better results across all assembly metrics, FMLRC exhibits high accuracy cor-rection while maintaining high assembly contiguity for a range of genome sizes. Practically, our method is also computationally efficient whereas competitive methods such as Jabba take prohibitive computational resources for even moderately sized data sets.
Conclusion
Table 4Long-read and hybrid correction assembly statistics
Dataset Method # contigs N50 Genome fraction Error rate
E. coliK12 Canu + Miniasm 1 4631922 99.832 0.00444
Genome: 5Mb CoLoRMap + Miniasm 1 4723063 84.485 0.02322
Pacbio: 450Mb FMLRC + Miniasm 1 4646838 99.757 0.00029
Illumina: 3.4Gb Jabba + Miniasm 76 72751 92.923 0.00005
LoRDEC + Miniasm 1 4688727 97.504 0.00321
LoRMA + Miniasm 107 64214 89.871 0.00099
Sprai + Miniasm 1 4639974 99.989 0.00092
Miniasm 1 4783415 0.002 0.01333
Canu 2 4656585 99.998 0.00012
hybridSPAdes 2 4469733 99.967 0.0001078
DBG2OLC 2 4585967 98.210 0.00225
Cerulean 16 1258842 98.959 0.09500
S. cerevisiaeW303 Canu + Miniasm 36 729798 89.739 0.00521
Genome: 12Mb CoLoRMap + Miniasm 23 766539 83.464 0.00761
Pacbio: 1.3Gb FMLRC + Miniasm 32 771324 87.717 0.00175
Illumina: 18Gb Jabba + Miniasm 186 62337 72.239 0.00008
LoRDEC + Miniasm 61 597849 85.563 0.00941
LoRMA + Miniasm 292 49850 74.632 0.00103
Sprai + Miniasm 39 561985 88.697 0.00193
Miniasm 29 566484 0.009 0.03738
Canu 26 777664 90.955 0.00068
hybridSPAdes 229 568823 87.303 0.00899
DBG2OLC 32 530806 0.067 0.03407
Cerulean 78 466556 0.03687
A. thalianaLer-0 Canu + Miniasm 2100 74153 81.844 0.01410
Genome: 120Mb CoLoRMap + Miniasm 963 404022 60.225 0.01853
Pacbio: 11Gb FMLRC + Miniasm 1923 57751 67.275 0.00401
Illumina: 13Gb Jabba + Miniasm 1632 57307 62.796 0.00041
LoRDEC + Miniasm 2232 30229 43.088 0.01107
LoRMA + Miniasm 34 26316 0.361 0.00448
Sprai + Miniasm 1475 169744 91.070 0.00824
Miniasm 740 615512 0.003 0.03409
Canu 419 835253 96.123 0.00760
DBG2OLC 440 754404 87.477 0.00388
Miniasm does not perform either read correction or consensus calling, so the resulting assembly has the same error profile of the input read
To overcome these limitations, we developed FMLRC, a long read correction method that uses a multi-string BWT and FM-index to represent all de Bruijn graphs of a short read dataset. The method uses two passes to perform the correction: one with a relatively shortk-mer and one with a longerK-mer. In each pass, unsupported sequences are identified in the long reads and the implicit de Bruijn
graph identifies alternate, supported sequences from the short reads. These alternate sequences are then used to correct the original read.
error-correction methods evaluated. We further showed that using FMLRC as a preassembly error correction step in conjunction with existing overlap-layout assem-bly methods produces highly contiguous assemblies with competitive accuracy relative to existing hybrid and non-hybrid assembly methods.
Future work will include a specific cost-benefit analy-sis of the quantity of long- and short-read data required to effectively assemble genomes based on their size and repetitive structure. While previous work has been done in this area, FMLRC, as a more efficient method for hybrid correction of long reads, is expected to allow more effectivede novoassembly with less long read data than previously possible. Future improvement and opti-mization of the FM-Index structure and bridging strategy could produce further speed and accuracy improvements over existing methods. In addition to a BWT with FM-index, it will be worth exploring the performance of other data structures, including novel variants of a de Bruijn graph that support multiple values of k [27, 28]. Our method is applicable to both Pacbio SMRT sequenc-ing and nanopore sequencsequenc-ing datasets, however further parameter optimization may improve its accuracy and efficiency for nanopore sequences, which exhibit a slightly different error profile than Pacbio. In the long term, bet-ter integration of FMLRC error correction along with other tools for overlapping, layout, and consensus of long read sequencing data will help realize the goal of a fully modular and efficientde novoassembly process.
Endnotes
1http://github.com/holtjma/fmlrc
2http://github.com/holtjma/msbwt
3
https://github.com/holtjma/msbwt/wiki/Converting-to-msbwt’s-RLE-format
Abbreviations
BWT: Burrows-wheeler transform; ECET: Error correction evaluation toolkit; FMLRC: FM-index long read corrector, Pacbio: Pacific biosciences
Acknowledgements
Computational resources were supported by UNC Research Computing (Killdevil and Longleaf clusters).
Funding
This work was supported in part by funding from the National Science Foundation (C.D.J., DEB-1457707), North Carolina Biotechnology Center (C.D.J., 2013-MRG-1110), University Cancer Research Fund (C.D.J.), Center for Genome Dynamics (L. M., NIGMS P50 GM076468), and Gastroenterology Basic Science Research Training Program (J.R.W., NIH/NIDDK T32DK007737-17S1).
Availability of data and materials
We tested the correction algorithms on three publicly available Pacbio datasets. The Pacbio datasets were downloaded forE. coliK12 MG1655,S. cerevisiaeW303, andA. thalianaLer-0 from (https://github.com/ PacificBiosciences/DevNet/wiki/Datasets). For each dataset, we also downloaded complementary short-read sequencing datasets publicly available at:http://spades.bioinf.spbau.ru/spades_test_datasets/ecoli_qmc/ forE. coli,https://www.ncbi.nlm.nih.gov/sra?term=SRR1652473forA. thaliana, andhttp://schatzlab.cshl.edu/data/ectools/forS. cerevisiae.
Authors’ contributions
JRW and CDJ conceived the study. JRW and JH designed the method, performed analyses, and wrote the manuscript. JH implemented the software. All authors read and approved the final manuscript.
Ethics approval and consent to participate
Not applicable.
Consent for publication
Not applicable.
Competing interests
All authors declare that they have no competing interests.
Publisher’s Note
Springer Nature remains neutral with regard to jurisdictional claims in published maps and institutional affiliations.
Author details
1Department of Genetics, University of North Carolina at Chapel Hill, CB 3280,
3144 Genome Sciences Building, 250 Bell Tower Dr, Chapel Hill, 27599, NC, USA.2Department of Computer Science, University of North Carolina at Chapel Hill, Chapel Hill, NC, USA.3Department of Biology and Integrative
Program for Biological and Genome Sciences, University of North Carolina at Chapel Hill, Chapel Hill, NC, USA.
Received: 8 February 2017 Accepted: 1 February 2018
References
1. Chin CS, Alexander DH, Marks P, Klammer AA, Drake J, Heiner C, Clum A, Copeland A, Huddleston J, Eichler EE, et al. Nonhybrid, finished microbial genome assemblies from long-read smrt sequencing data. Nature methods. 2013;10(6):563–9.
2. Au KF, Underwood JG, Lee L, Wong WH. Improving pacbio long read accuracy by short read alignment. PLoS ONE. 2012;7(10):46679. 3. Koren S, Schatz MC, Walenz BP, Martin J, Howard JT, Ganapathy G,
Wang Z, Rasko DA, McCombie WR, Jarvis ED, et al. Hybrid error correction and de novo assembly of single-molecule sequencing reads. Nat Biotechnol. 2012;30(7):693–700.
4. Salmela L, Rivals E. Lordec: accurate and efficient long read error correction. Bioinformatics. 2014;30(24):3506–14.
5. Berlin K, Koren S, Chin CS, Drake JP, Landolin JM, Phillippy AM. Assembling large genomes with single-molecule sequencing and locality-sensitive hashing. Nat Biotech. 2015;33(6):623–30.
6. Li H. Minimap and miniasm: fast mapping and de novo assembly for noisy long sequences. Bioinformatics. 2016;32(14):2103–110.
7. Miyamoto M, Motooka D, Gotoh K, Imai T, Yoshitake K, Goto N, Iida T, Yasunaga T, Horii T, Arakawa K, Kasahara M, Nakamura S. Performance comparison of second- and third-generation sequencers using a bacterial genome with two chromosomes. BMC Genomics. 2014;15(1):1–9. 8. Salmela L, Walve R, Rivals E, Ukkonen E. Accurate selfcorrection of errors
in long reads using de bruijn graphs. Bioinformatics. 2016;33(6):799–806. 9. Lee H, Gurtowski J, Yoo S, Marcus S, McCombie WR, Schatz M. Error
correction and assembly complexity of single molecule sequencing reads. BioRxiv. 2014006395.https://doi.org/10.1101/006395. 10. Miclotte G, Heydari M, Demeester P, Rombauts S, Van de Peer Y,
Audenaert P, Fostier J. Jabba: hybrid error correction for long sequencing reads. Algo Mole Biol. 2016;11(1):10.
11. Haghshenas E, Hach F, Sahinalp SC, Chauve C. Colormap: Correcting long reads by mapping short reads. Bioinformatics. 2016;32(17):545–51. 12. Goodwin S, Gurtowski J, Ethe-Sayers S, Deshpande P, Schatz MC,
McCombie WR. Oxford nanopore sequencing, hybrid error correction, and de novo assembly of a eukaryotic genome. Genome Res. 2015;25(11): 1750–6.
13. Deshpande V, Fung ED, Pham S, Bafna V. Cerulean: A hybrid assembly using high throughput short and long reads. In: International Workshop on Algorithms in Bioinformatics. Springer; 2013. p. 349–63. arXiv preprint arXiv:1307.7933.
technologies. Scientific Reports. 2016;6:31900.https://doi.org/10.1038/ srep31900.
15. Antipov D, Korobeynikov A, McLean JS, Pevzner PA. hybridspades: an algorithm for hybrid assembly of short and long reads. Bioinformatics. 2016;32(7):1009–15.
16. Bauer MJ, Cox AJ, Rosone G. Lightweight BWT construction for very large string collections. In: Giancarlo R, Manzini G, editors. Combinatorial Pattern Matching. CPM 2011. Lecture Notes in Computer Science, vol. 6661. Berlin: Springer; 2011. p. 219–31.
17. Bruijn d. N. A combinatorial problem. Proceedings of the Koninklijke Nederlandse Akademie van Wetenschappen. Series A. 1946;49(7):758. 18. Ferragina P, Manzini G. An experimental study of an opportunistic index.
In: Proceedings of the twelfth annual ACM-SIAM symposium on discrete algorithms (SODA ’01). Philadelphia: Society for Industrial and Applied Mathematics; 2001. p. 269–78.
19. Burrows M, Wheeler DJ. A block-sorting lossless data compression algorithm. Digital Systems Research Center Research Reports. 1994. 20. Greenstein S, Holt J, McMillan L. Short read error correction using an
FM-index. In: 2015 IEEE International Conference on Bioinformatics and Biomedicine (BIBM). Washington: IEEE; 2015. p. 101–4.https://doi.org/10. 1109/BIBM.2015.7359662.
21. Li H. Fast construction of fm-index for long sequence reads. Bioinformatics. 2014;541.
22. Chaisson MJ, Tesler G. Mapping single molecule sequencing reads using basic local alignment with successive refinement (blasr): application and theory. BMC Bioinformatics. 2012;13(1):238.
23. Yang X, Chockalingam SP, Aluru S. A survey of error-correction methods for next-generation sequencing. Brief Bioinform. 2013;14(1):56–66. 24. Gurevich A, Saveliev V, Vyahhi N, Tesler G. Quast: quality assessment tool
for genome assemblies. Bioinformatics. 2013;29(8):1072–75. 25. Loman NJ, Quick J, Simpson JT. A complete bacterial genome
assembled de novo using only nanopore sequencing data. Nat Meth. 2015;12(8):733–5.
26. Treangen TJ, Salzberg SL. Repetitive dna and next-generation sequencing: computational challenges and solutions. Nature Rev Gen. 2011;13(1):36–46.
27. Boucher C, Bowe A, Gagie T, Puglisi SJ, Sadakane K. Variable-order de bruijn graphs. In: Proceedings of the 2015 Data Compression Conference, DCC ’15. Washington: IEEE Computer Society; 2015. p. 383–92. 28. Cazaux B, Lecroq T, Rivals E. In: Kulikov AS, Kuznetsov SO,
Pevzner P, editors. From Indexing Data Structures to de Bruijn Graphs. Cham: Springer; 2014, pp. 89–99.
• We accept pre-submission inquiries
• Our selector tool helps you to find the most relevant journal
• We provide round the clock customer support
• Convenient online submission
• Thorough peer review
• Inclusion in PubMed and all major indexing services
• Maximum visibility for your research
Submit your manuscript at www.biomedcentral.com/submit