ABSTRACT
Kevin James Currie. Bioassay Determination of Species
Specific Phytoplankton Responses to the Herbicide Atrazine and its Quantification in B. Everett Jordan Reservoir. (Under the direction of Dr. Donald E. Francisco)
Atrazine was quantified bi-weekly in samples from three locations in B. Everett Jordan Lake during March - July 1985 using gas chromatography. The presence in Segment 1 of
atrazine and other previously identified Haw River constituents was verified by GC/MS. The highest
concentrations were consistently found in Segment 1 (0.5-2.5
ug/L) and residue concentrations were generally higher in Segment 2 than Segment 3. Although atrazine concentrations
declined rather rapidly following the field application
runoff pulse in May, herbicide residue levels remained higher than those prior to that date. In vitro, natural population bioassays revealed species specific responses to atrazine. The population as a whole was severely inhibited at 50 ug/L
atrazine. Results suggest low-dose (1 ug/L) growth
stimulation for several members of the Cyanophyta. Several
species of the Chlorophyta exhibited temporal growth lags at
atrazine concentrations of 50 ug/L. However, maximum biomass was not severely depressed. Other species of green algae, Chlamydomonas in particular, exhibited resistance to the effects of atrazine at all doses. Competitive interactions between species affected individual responses to the
toxicant. Species specific responses to atrazine levels
commonly found in agricultural watersheds (0.25-10 ug/L)
ACKNOWLEDGEMENTS
I would like to thank Dr. Donald E. Francisco for his
interest, guidance, and support of my research project. I am
also grateful to Dr. Edward J. Kuenzler and Dr. James E. Hall
for their advice during this project and positive criticism
of this report. Dr. Peter H. Campbell provided invaluable
aid in phytoplankton identification as well as his manuscript
of North Carolina phytoplankton. Statistical models and
analyses were the result of many meetings with Dr. Gary Koch
and Jill Bissette. Dr. Charles M. Weiss provided data and
helpful insight concerning the hydrology of Lake Jordan. Dr.
Daniel Norwood, Gavin Thompson, and Andrea Dietrich guided me
around the pitfalls of GC/MS. Marilyn Maerker and Steve
Shoaf were always ready to listen and provide technical
support and humor. Special thanks must be given to Katherine
for her assistance in all phases of this project, her
understanding and support.
This investigation was part of a research program
supported by the U. S. Army Corps of Engineers, Wilmington
District, contracts DACW54-83-C-0004,
DACW54-83-C-0004,P-00001, and DACW54-83-C004,P-00002.
\
\
S
\
\
TABLE OF CONTENTS
PAGE
ACKNOWLEDGEMENTS... ii
ABSTRACT... iii
LIST OF FIGURES... vi
LIST OF TABLES... X LITERATURE REVIEW General Characteristics of Atrazine... 1
Fate of Field-Applied Atrazine... 2
Atrazine Concentration in Streams and Lakes... 8
Ecological Impacts of Atrazine... 9
Algal Sorption of Atrazine... 10
Effects of Atrazine on Algae-Single Species Bioassays... 12
Mechanisms of Inhibition and Resistance in Algae.. 16
Atrazine/Atrazine-Analog/Solvent Interactions and Toxicity... 17
Effects of Atrazine on Algae-Population Bioassays. 19 METHODS Atrazine Sampling in Jordan Lake... 24
Adsorption of Organics From Water Samples... 24
Elution of Adsorbed Organics... 28
Gas Chromatography and Mass Spectrometry Confirmation... 28
Bioassay Media and Enumeration Techniques... 40
Statistical Treatment of Bioassay Data... 44
RESULTS AND DISCUSSION Atrazine in Lake Jordan Flow Dynamics in Lake Jordan Watershed... 47
Relationship between the Storage of Input Flows and Conductivity to Atrazine Residue Concentration... 53
Biological Accumulation of Atrazine... 60
Summary... 62
Species Specific Responses to Atrazine in Bioassays I and II... 64
Total Count... 66
Oscillatoria limnetica... 68
Merismopedia tenuissima... 71
Gleocapsa punctata... 71
TABLE OF CONTENTS (Cont'd)
PAGE
Nephroselmis discoidea... 75
Cryptomonas spp... 77
Cyclotella spp... 78
Dictyosphaerium ehrenbergianum... 81
Chlorella spp... 82
Ankistrodesmus spp... 84
Ankistrodesmus falcatus var. spirilliformis... 87
Chlamydomonas (total count)... 88
Chlamydomonas debaryana... 90
Chlamydomonas sp. "L"... 92
Chlamydomonas altera... 94
Chlamydomonas mucicola... 94
Chlamydomonas globosa... 96
Scenedesmus spp... 97
Kirchneriella lunaris... 99
Merotrichia capilata... 100
Colorless Flagellates... 102
Unidentified Phytoplankton... 103
Phylogenetic Trends Associated with the Effects of Atrazine... 105
Interspecific Relationships and the Effects of Atrazine... 107
CONCLUSIONS AND RECOMMENDATIONS Conclusions... 110
Recommendations for Lake Management and Future Research... 113
LITERATURE CITED... 114
VI
LIST OF FIGURES
PAGE
Fig. 1. Map of Jordan Lake, N.C., showing sampling
station locations... 25
Fig. 2. Gas chromatogram of XAD-resin blank eluate
following extensive solvent clean-up... 31 Fig. 3. Gas chromatogram of a standard solution of
simetone, atrazine, and simetryne... 32 Fig. 4. Gas chromatogram of organic compounds present at
Station H16 on June 19^^ ... 33
Fig. 5. Mass spectra of atrazine and its surrogate,
simetryne extracted from water sampled at
Station H16 on June 19^^... 34
Fig. 6. Mass spectra of organic pollutants present in water
sampled at Station H16 on June 19^" ... 35
Fig. 7. Flame ionization detector linear range - response factor of analyte, atrazine/internal standard,
simetone... 36 Fig. 8. Flame ionization detector linear range - response
factor of surrogate, simetryne/internal standard,
simetone... 37 Fig. 9. Extraction efficiency of atrazine compared with
simetryne under worst-case conditions... 39
Fig. 10. Three-day mean flow into Jordan Lake at Segment 1, from the Haw River Watershed: measured at Bynum,
N.C., during March-July, 1985... 48 Fig. 11. Combined, three-day mean flow of Morgan, New Hope
and Northeast creeks into Segment 4 during
March-July, 1985... 49
Fig. 12. Agricultural land with high erosion rates near
permanent streams in Jordan Lake watershed... 51
Fig. 13. The relationship between lake storage of all input
flows and atrazine concentration at Station H16... 54
Fig. 14. The relationship between lake storage of all input
flows and atrazine concentration at Station NH17... 55
Fig. 15. The relationship between lake storage of all input
Vll
LIST OF FIGURES (Cont'd)
PAGE
Fig. 16. The relationship between atrazine concentration and
the presence of Microcystis aeruginosa in Segment 1.... 61
Fig.lVA. Combined cell counts for all species present in BI illustrating the effects of atrazine on cell
count for the days and at the doses indicated... 67
Fig.l7B. Combined cell counts for all species present in BII
illustrating the effects of atrazine on cell
count for the days and at the doses indicated... 67
Fig.lSA. Cell counts for Oscillatoria limnetica from in BI illustrating the effects of atrazine on cell
count for the days and at the doses indicated... 69
Fig.lSB. Cell counts for Oscillatoria limnetica from BII, illustrating the effects of atrazine on cell
count for the days and at the doses indicated... 69 Fig. 19. Cell counts for Merismopedia tenuissima from BII,
illustrating the effects of atrazine on cell
count for the days and at the doses indicated... 72 Fig. 20. Cell counts for Gleocapsa punctata from BII,
illustrating the effects of atrazine on cell
count for the days and at the doses indicated... 72 Fig. 21. Cell counts for Polycystis firma from BII,
illustrating the effects of atrazine on cell
count for the days and at the doses indicated... 74 Fig.22A. Cell counts for Nephroselmis discoidea from BI,
illustrating the effects of atrazine on cell
count for the days and at the doses indicated... 76 Fig.22B. Cell counts for Nephroselmis discoidea from BII,
illustrating the effects of atrazine on cell
count for the days and at the doses indicated... 76 Fig. 23. Cell counts for Cryptomonas spp. from BII,
illustrating the effects of atrazine on cell
count for the days and at the doses indicated... 79
Fig. 24. Cell counts for Cyclotella spp. from BII, illustrating the effects of atrazine on cell
Vlll
LIST OF FIGURES (Cont'd)
PAGE
Fig. 25. Cell counts for Dictyosphaerlum ehrenbergianum from
BII, illustrating the effects of atrazine on cell
count for the days and at the doses indicated... 83
Fig. 26. Cell counts for Chlorella spp. from BII, illustrating the effects of atrazine on cell
count for the days and at the doses indicated... 83
Fig. 27. Cell counts for Ankistrodesmus spp. from BI,
illustrating the effects of atrazine on cell
count for the days and at the doses indicated... 86
Fig. 28. Cell counts for Ankistrodesmus spp. from BII, illustrating the effects of atrazine on cell
count for the days and at the doses indicated... 86
Fig. 29. Cell counts for Ankistrodesmus falcatus var.
spirilliformis from BII, illustrating the effects of atrazine on cell count for the days and at the
doses indicated... 89 Fig. 30. Combined cell counts for all Chlamydomonas spp.
present in BII, illustrating the effects of atrazine on cell count, on the days and at
the doses indicated... 89 Fig.3lA. Cell counts for Chlamydomonas debaryana from BI,
illustrating the effects of atrazine on cell
count for the days and at the doses indicated... 91
Fig.31B. Cell counts for Chlamydomonas debaryana from BII,
illustrating the effects of atrazine on cell
count for the days and at the doses indicated... 91 Fig.32A. Cell counts for Chlamydomonas sp."L" from BI,
illustrating the effects of atrazine on cell
count for the days and at the doses indicated... 93
Fig.32B. Cell counts for Chlamydomonas sp."L" from BII,
illustrating the effects of atrazine on cell
count for the days and at the doses indicated... 93
Fig. 33. Cell counts for Chlamydomonas altera from BII,
illustrating the effects of atrazine on cell
count for the days and at the doses indicated... 95
Fig. 34. Cell counts for Chlamydomonas mucicola from BII,
illustrating the effects of atrazine on cell
IX
LIST OF FIGURES (Cont'd)
PAGE
Fig. 35. Cell counts for Chlamydomonas globosa from BII, illustrating the effects of atrazine on cell
count for the days and at the doses indicated... 98 Fig. 36. Cell counts for Scenedesmus spp. from BII,
illustrating the effects of atrazine on cell
count for the days and at the doses indicated... 98
Fig. 37. Cell counts for Kirchneriella lunaris from BII, illustrating the effects of atrazine on cell
count for the days and at the doses indicated... 101 Fig. 38. Cell counts for Merotrichia capilata from BII,
illustrating the effects of atrazine on cell
count for the days and at the doses indicated... 104 Fig. 39. Combined cell counts for Colorless Flagellates from
BII, illustrating the effects of atrazine on cell
count for the days and at the doses indicated... 104 Fig. 40. Combined cell counts for all unidentified species from
BII, illustrating the effects of atrazine on cell
LIST OF TABLES
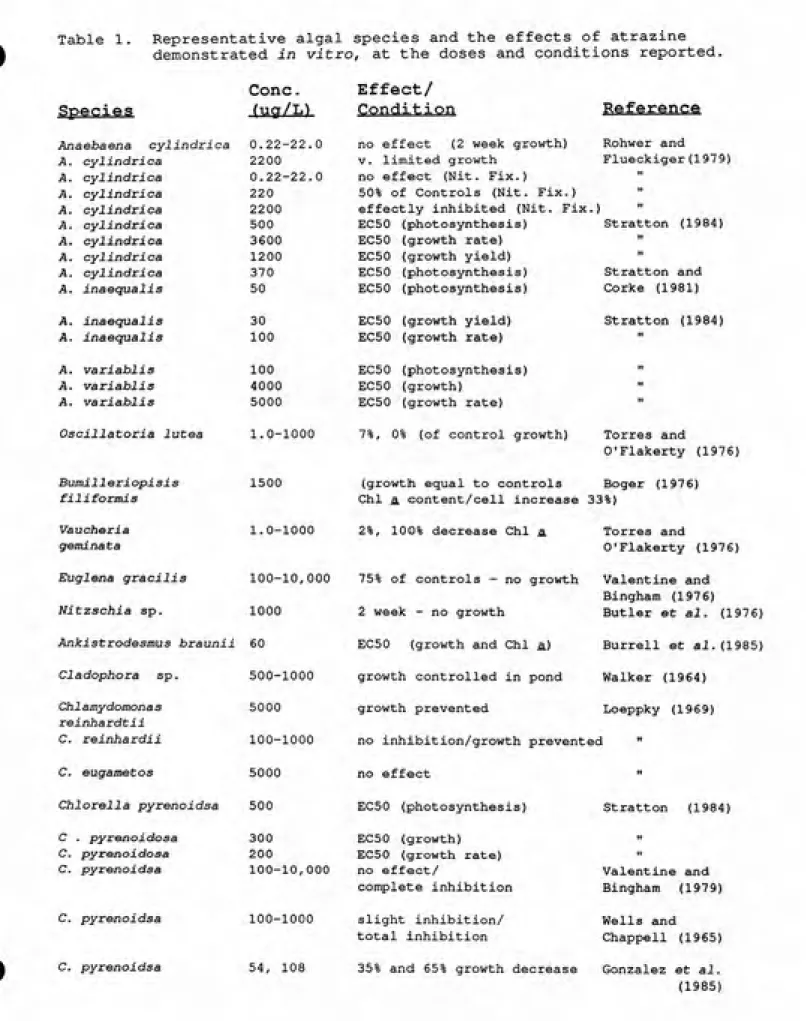
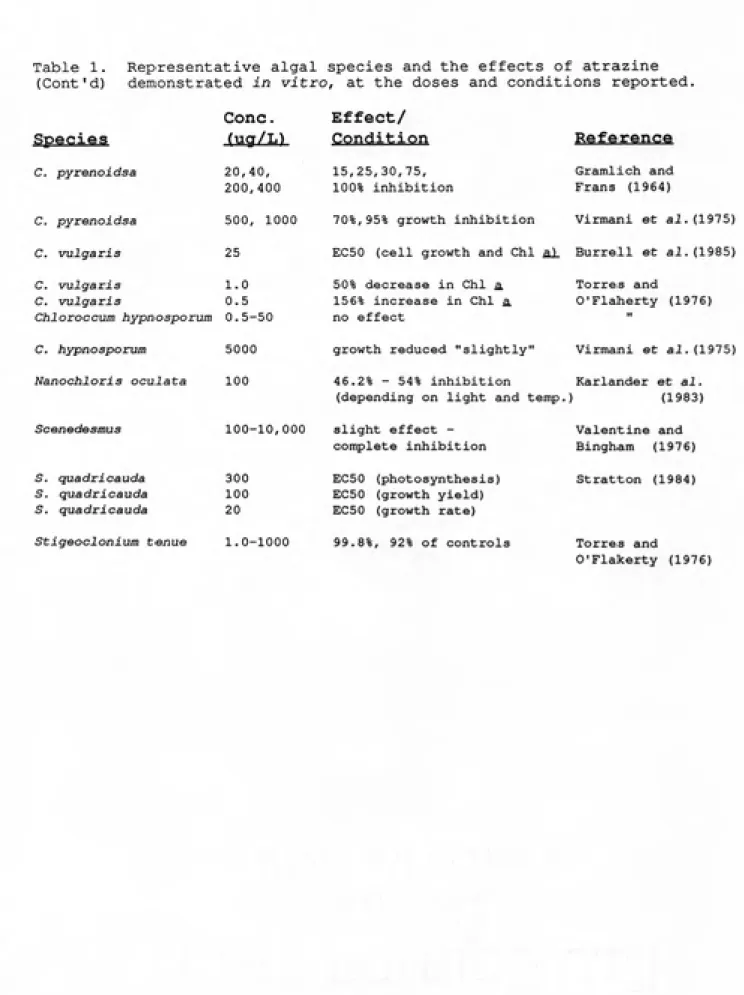
PAGE Table 1. Representative algal species and the effects of
atrazine demonstrated in vitro as reported in
the literature... 13
Table 2. Comparison of cell counts made with a hemacytometer
and the "Vaspar" method... 43 Table 3. Water-column mean conductivity for sites in Jordan
Lake measured during 1985... 59
Table 4. Summary of in vitro species specific responses of
LITERATURE REVIEW
General Characteristics of Atrazine
Atrazine (2-chloro-4-ethylamino-6-isopropylamino-s-triazine) is a colorless crystalline powder in its pure form with a melting point of 173-175°C. At 25°C it has a vapor
pressure of 4 x 10"^ mm Hg, and while relatively insoluble in
water (70 mg/L), it is very soluble in organic solvents (ether 12,000 mg/L, methanol 18,000 mg/L and chloroform 52,000 mg/L). It is stable in neutral, weakly acidic or alkaline media and has a pKa of 1.68 at 22"C in water.
The herbicidal potential of atrazine was recognized in the early 1950's, and it was released for public use in 1959. Today, atrazine is the herbicide of choice for American corn and sorghum farmers. It is widely used for pre-and post-emergent control of germinating weeds and for non-selective control of weeds in non-cropped areas (Lewis et al. 1985). Atrazine does not biomagnify, has relatively low toxicity to mammals (acute oral LD50 for rats is 1750 rag/kg) but somewhat
higher toxicity in fish (48 hour LC50 for rainbow trout is 10
mg/L). In 1976 41 million kilograms, as active ingredient, were applied to land in the United States (Eichers et al.
1978). In North Carolina alone, over 1.5 million kilograms are applied on an annual basis (Turner, Digiano, and DeRosa
Due to its low water solubility, atrazine is usually
supplied as a wettable powder or as a suspension concentrate although a granular formulation is available for longer
persistence. The usual method of application is whole field spraying. In North Carolina, application usually takes place
with crop planting in April but occasionally, a second
post-emergent treatment is also used (Lewis et al. 1985).
The amount of atrazine applied depends on the crop being
grown and the soil type. Recommended rates of active
ingredient for corn and sorghum (its principle application in North Carolina) are 2.0 - 3.0 and 1.6 - 2.4 pounds per acre, respectively. The range is due to soil type: The higher rates are used on heavy clay/organic soils while lighter loamy soils receive less herbicide. Atrazine is not recommended for sand or soils with less than 1% organic
content. No-till agriculture requires slightly higher rates of herbicide application to penetrate the surface soil to the
root zone where it has its action.
Fate of Field-Applied Atrazine
After application, atrazine will have one of six fates.
It may be 1) taken up by target crops where it inhibits
photosynthesis or by resistant crops where it is metabolized; 2) sorbed to the soil and hydrolyzed to inactive hydroxy-atrazine; 3) hydrolyzed in the soil-water to hydroxy-atrazine and remain soluble or become sorbed to the soil; 4)
released as active atrazine; 5) transported as active
atrazine in runoff waters in soluble form or as a soil-bound
colloid; or 6) degraded microbially producing a variety of
atrazine analogs.
The potential impacts a field-applied herbicide might have on non-target organisms present in receiving rivers and
lakes will be determined by the amount and form of the
herbicide in runoff waters. This in turn, is primarily
dependant on field moisture and the soil's physical-chemical characteristics. Atrazine is transported through the soil to absorbing plant roots by mass flow and molecular diffusion
(Lavy 1968). Without adequate field moisture atrazine's phytotoxicity towards target plants is severely diminished
(Harrison et al. 1976) and the molecule is increasingly
subject to sorption by clay and organic materials in the soil
(Dao et al. 1978).
Application rates for atrazine are based on the
percentage of clay and organic material contained by
receiving soils. The relationship between atrazine activity and percentage kaolinitic clay in North Carolina soils has been described as weak (Harrison et al. 1976), while Anderson et al. (1980) and Smit et al., as cited by Nel and Reinhardt
(1984), found a strong negative relationship between atrazine availability and percentage organic material found in soils.
In most soils the organic material is intimately bound to the clay, probably as a clay-metal-organic complex. Humus
times the cation exchange capacity of clay (Klingman, Ashton, and Noordhoff 1975). Then, the relative sorptive capacity of the soil will be determined by the degree to which the clay fraction is coated with organic material.
Soil pH determines, to a great extent, the degradative mechanisms operating on atrazine and the sorptive capacity of
the clays and humus present there. At pH values close to 7
atrazine is extremely stable, however a decrease in
availability of atrazine with decreasing pH is generally recognized. According to Armstrong et al. (1967), the most important chemical mechanism for degradation of atrazine at
low pH is hydrolysis to hydroxy-atrazine. It was suggested that sorption takes place between the ring nitrogen of
atrazine and a protonated-COOH group of the organic
matter/clay complex. Hydrogen bonding of the ring nitrogen causes loss of Cl~ and subsequent replacement with OH".
Under high pH conditions, direct nucleophilic substitution of
OH" for CI" is thought to take place. Mechanisms of
inactivation include sorption to organic/clay complexes via
hydrogen bonding or protonation in the soil solution and
subsequent ion exchange. Both mechanisms are reversible and
result in complexes that are subject to transport in runoff
water.
delayed decomposition of the herbicide because atrazine was
sorbed in the anionic form without hydroxylation at the
sorption site. The complexed atrazine is biologically
inactive, but their data suggest that atrazine is released in
the active form when the pH rises. Soils with a large
amorphous fraction could accumulate atrazine in this manner and release it a long time after application, during field liming, for example. This hypothesis is supported by the
work of Kells et al. (1980). Wijayaratne and Means (1984) have found that active atrazine is released from colloid complexes under oxidizing conditions. There is general
agreement that atrazine does carry over to the next growing season in soil (Armstrong 1967; Wu 1980; Khan and Saidak
1981; and Nel and Reinhardt 1984); however, it is apparently released in runoff during the next growing season because it does not accumulate over time (Wu 1980).
Smit et al., as cited by Nel and Reinhardt (1984), have found a positive correlation between phosphorus concentration and atrazine availability in soils containing a large
amorphous component. It was hypothesized that phosphorus competes with atrazine for the negative binding sites in
these soils.
A delay similar to the one outlined above has been
reported (Wu et al. 1983) for experimental watersheds. During the growing season (May-August, 1977), less than ten percent of the total atrazine discharge to receiving streams
6
January of 1978 which indicates that atrazine was either bound reversibly or remained uncomplexed for at least eight months and then was transported to receiving streams without _ decomposition. It should be noted that this runoff occurred after an extremely dry growing season and that this single storm event produced greater than 50% of the total atrazine discharged on an annual basis (Wu et al. 1983).
S-triazines are susceptible to biological degradation in
the soil. Early researchers thought this to be the primary
mechanism of atrazine inactivation. Non-sterile soils added
to aqueous solutions of simazine have been shown to have greater degradative capacity than sterile soils (Burnside et al. 1961). Fungi (Kearney 1966) and bacteria (Kaufman et al. 1965) have been implicated in a variety of metabolic
transformations. However, when compared to the evidence for the relatively rapid chemical degradative mechanisms
operating, microbes play a relatively minor role in the
inactivation of atrazine.
There is general agreement that a small percentage of applied atrazine actually makes its way to aquatic
environments. Values of between 0.1% to 3.0% are present in the literature (Hall et al. 1972; Frank et al. 1979; Muir and Baker 1978; Hermann et al. 1979; Wu 1980; and Glotfelty et al. 1984). Atrazine transport in streams occurs mainly in solution. Solution-atrazine comprised 58% to 99% of the total detected (Ritter et al. 1974; Leonard et al. 1979;
Estuarine colloids have been shown to be 10 to 35 times
greater in atrazine sorptive capacity than sediment or soil organic matter on an organic carbon basis (Means and
Wijayaratne 1982). However, a significant decrease in sorptive capacity occurred when the ambient pH of 7.98 was
increased to 9.0 or decreased to 5.0. It was suggested that
colloids could play an important role in atrazine transport.
The half-life of atrazine in various environments is
expected to be highly variable, reflecting the different conditions present (pH, soil type, organic carbon, and salinity). In distilled water, hydrolysis to hydroxy-atrazine reaches a minimum at pH 7.0. The half-life under
these conditions has been calculated to be approximately 1800
years (Plust et al. 1981). Essentially no atrazine
degradation occurred in synthetic sea water after four months (Ballantine et al. 1978). Armstrong et al. (1967) found a ten fold increase in hydrolysis of atrazine upon addition of sterile soil to aqueous medium. A three to twelve day half-life (degradation plus sorption) was determined by Jones et al. (1982) using a 2:1 water/soil estuary mixture, whereas Ballantine et al. (1978) found the half-life to be 30 days using a 10:1 water/soil estuary mixture from Chesapeake Bay. Less work has been done with fresh water degradation. The half-life of atrazine in fresh water/sediment mixtures has been found to be between 95 days to greater than three years
Atrazine Concentrations In Streams And Lakes
The above mentioned mechanisms for degradation as well as
transport of atrazine and its degradation products to aquatic
environments illustrate the complex set of factors that determine the concentration of atrazine and its degradation
products in streams and lakes. As might be expected,
concentrations of atrazine are highest near its source so the
greatest immediate impact will be on submerged plants and periphyton in streams. Glotfelty et al. (1984) found 300 ug/L atrazine in "edge of field" runoff after the first significant rainfall in the Wye River Estuary system.
Variation is to be expected with season and soil conditions. Wu (1980) reported "edge of field" values for the growing season (May-August, 1977) to be from <0.08 ug/L to 52 ug/L.
As atrazine is transported downstream, it may settle out if sorbed to suspended material and be diluted such that non-target impacts in larger streams and rivers should reflect lower concentrations. Conversely, if sorbed to colloids,
atrazine may be transported without significant decrease in its concentration. In the main body of the Wye River
Estuary, Glotfelty et al. (1984) reported upstream atrazine
values of 15 ug/L, decreasing downstream to 1 ug/L near the
Chesapeake Bay. Frank et al. (1979) reported atrazine values
at the mouths of rivers entering the Great Lakes similar to
those found upstream. Atrazine concentrations ranged from <
9
ug/L. Muir, Yoo, and Baker (1978) have reported similar
concentrations in five Quebec watersheds.
Lakes and bays may serve as reservoirs for atrazine inputs via bioaccumulation and colloid or sediment sorption, although concentrations reported are generally lower than in streams. Samples taken in June and July 1980 from the
Chesapeake Bay never exceeded 1.3 ug/L (Kemp et al., as cited by Glotfelty et al. 1984). This reflects the dry conditions that growing season and the low concentrations found in the Wye River (generally < 0.05 ug/L) reported by Glotfelty et
al. (1984) for that year. In contrast, concentrations in an Iowa reservoir were as high as 9.4 ug/L during May-June 1974 (Richard et al. 1975). The highest atrazine residues will
generally be found shortly after the first significant runoff
event following spraying. However, during drought years, significant discharge events may be missed with summer sampling. Wu et al. (1983) found "edge of field"
concentrations of atrazine exceeding 100 ug/L in runoff
sampled during January and approximately 20 ug/L before crop spraying in May.
Ecological Impacts of Atrazine
Many of the studies mentioned above were conducted to
assess the extent of atrazine pollution of aquatic systems due to concern over its impact on non-target organisms,
mainly fish and rooted aquatic plants. A "safe" value using
10
crab, shrimp, minnow and oyster populations of 9 ug/L
atrazine was found by Ward and Ballantine (1985). Frank et al. (1979) state that atrazine concentrations entering the Great Lakes "do not pose a threat to Great Lakes water quality as defined by water quality objectives for non-persistent organics." Glotfelty et al. (1984) "can find no evidence that atrazine entering the Chesapeake Bay via the Wye River Estuary causes significant harm to the submerged aquatic vegetation found there."
Algal Sorption Of Atrazine
Currently, there are no regulations governing the introduction of non point-source pollutants from the
perspective of phytoplankton impacts. However, the potential impacts a photosynthesis inhibitor might have on algae has
been of concern and much work has been done in this area.
The fact that atrazine is not biomagnified in aquatic ecosystems is to be expected of a non-lipophilic herbicide. Residues are, therefore, not concentrated in predators. However, evidence for bioaccumulation in algae (which have large surface/volume ratios and occasionally high biomass in lake ecosystems) has been reported (Streit 1979). Similar evidence is provided by the work of Valentine and Bingham
(1976). They found that adsorption of ^^C atrazine was
complete after six hours in aqueous media containing 10 ug/L
11
the higher concentration (20%). They found no difference with light or temperature conditions and concluded that the atrazine removal mechanism operating in Scenedesmus
quadriCauda must be physio-chemical in nature. This same experimental procedure was used with Chlamydomonas vulgaris and 2.5 mg/L atrazine (Veber et al. 1981). Within one hour, 90% of the atrazine present was adsorbed to cells. Upon longer exposure, adsorbed atrazine was released back to solution and subsequently taken back up by the end of 96
hours. This same result was observed in flasks in which
essentially no growth occurred (5.0 mg/L atrazine) indicating that uptake of atrazine isn't dependant on cell growth. In contrast Butler, Deason, and O'Kelley (1975b) concluded that algae did not remove atrazine from media in which 21 algal isolates were grown for two weeks.
Uptake in higher plants has been shown to occur through the root system and phytotoxic action takes place by
inhibition of photosythesis at photosystem II. Algae are susceptible to this same inhibition. It has been shown that atrazine does not inhibit respiration (Galloway and Mets 1981) or cause any permanent damage to the photosynthetic cell organelles (Boger 1976). Disregarding genetic
resistance for the moment, plant resistance is conferred by the ability to metabolize atrazine to an inactive molecule along one of several pathways (Nel and Reinhardt 1984). These degradative mechanisms have been shown to be
12
Valentine and Bingham 1976), and in fact species of
filamentous algae, considered a nuisance at high densities,
have been successfully controlled in ponds by addition of 0.5 to 1.0 mg/L atrazine (Walker 1964).
Effects Of Atrazine On Algae - Single Species Bioassays
Many investigators have provided evidence that atrazine
has an effect on the growth of algae. A representative sample of results is presented in Table 1.
Nitrogen fixation by Cyanophyta is an important factor in the availability of nitrogen in the soil, especially in rice cultivation. Rohwer and Flueckiger (1979) found that neither growth nor nitrogen fixation by Anaebaena cylindrica
was affected at concentrations of atrazine between 0.22
-22.0 ug/L. However, at 2.2 mg/L both functions were essentially static. This conflicts with the results of
Stratton (1984) who found EC50 values of greater than 100 and
55 mg/L atrazine for nitrogen fixation in A. cylindrica and
h' inaequalis respectively. These discrepancies may be due
to differences in incubation periods.
Atrazine was found to.delay growth of Chlorella
pyrenoidosa by extending the "lag phase" of growth (Gonzalez
et al. 1985). While cell division was inhibited by treatment
compared to controls, chlorophyll synthesis was more strongly
inhibited. In addition, it was found that atrazine dosing
13
Table 1. Representative algal species and the effects of atrazine demonstrated in vitro, at the doses and conditions reported.
gpgcigg
Cone.
Anaebaena cylindrica 0.22-22.0
A. cylindrica A. cyl In drl ca A. cylindrica A. cylindrica A. cylindrica A. cylindrica A. cylindrica A. cylindrica A. inaequalis A. inaequalis A. inaequalis A. variablis A. variablis A. variablis
Oscillatoria lutea
Bumilleriopisis
filiforiais Vaucheria
geminata
Euglena gracilis
Nitzschia sp.
2200 0.22-22.0 220 2200 500 3600 1200 370 50 30 100 100 4000 5000 1.0-1000 1500 1.0-1000 100-10,000 1000
Ankistrodesmus braunii 60
Cladophora sp. 500-1000
Chlamydomonas 5000
reinhardtli
C. reinhardii 100-1000
C. eugametos 5000
Chlorella pyrenoidsa 500
C . pyrenoidosa 300
C. pyrenoidosa 200
C. pyrenoidsa 100-10,000
C. pyrenoidsa 100-1000
C. pyrenoidsa 54, 108
Effect/
Condition
no effect (2 week growth) V. limited growth
no effect (Nit. Fix.)
50% of Controls (Nit. Fix.)
effectly inhibited (Nit. Fix.) EC50 (photosynthesis)
EC50 (growth rate) EC50 (growth yield) EC50 (photosynthesis) EC50 (photosynthesis) EC50 (growth yield) EC50 (growth rate) EC50 (photosynthesis)
EC50 (growth)
EC50 (growth rate)
7%, 0% (of control growth)
Reference Rohwer and Flueckiger(197 9) Stratton (1984) Stratton and Corke (1981) Stratton (1984) Torres and O'Flakerty (1976)
(growth equal to controls Boger (1976)
Chi a. content/cell increase 33%)
2%, 100% decrease Chi a Torres and
O'Flakerty (1976)
75% of controls - no growth Valentine and
Bingham (197 6) 2 week - no growth
EC50 (growth and Chi a) growth controlled in pond
growth prevented
no inhibition/growth prevented
no effect
EC50 (photosynthesis)
EC50 (growth) EC50 (growth rate)
no effect/
complete inhibition
Butler et al. (197 6) Burrell et ai.(1985) Walker (1964)
Loeppky (1969)
Stratton (1984)
Valentine and
Bingham (1979) slight inhibition/
total inhibition
35% and 65% growth decrease
Wells and
Chappell (1965) Gonzalez et al.
14
Table 1. Representative algal species and the effects of atrazine
(Cont'd) demonstrated in vitro, at the doses and conditions reported. Species
C. pyrenoidsa
C. pyrenoidsa C. vulgaris
Cone.
20,40, 200,400 500, 1000
25
C. vulgaris 1.0 C. vulgaris 0.5 Chloroccum hypnosporum 0.5-50
C. hypnosporum 5000
Nanochloris oculata 100
Scenedesmus 100-10,000
S. quadricauda 300
S. quadricauda 100
S. quadricauda 20
Stigeoclonium tenue 1.0-1000
Effect/
Condition
15,25,30,75,
100% inhibition
70%,95% growth inhibition EC50 (cell growth and Chi aj.
50% decrease in Chi a. 156% increase in Chi a
no effect
growth reduced "slightly"
46.2% - 54% inhibition
(depending on light and temp. slight effect
-complete inhibition EC50 (photosynthesis) EC50 (growth yield) EC50 (growth rate)
99.8%, 92% of controls
Reference
Gramlich and Frans (1964)
Virmani et al. (1975) Burrell et aJ. (1985)
Torres and
O'Flaherty (1976)
(I
Virmani et al. (1975)
Karlander et al.
) (1983)
Valentine and
Bingham (1976)
Stratton (1984)
Torres and
15
decrease relative to controls. Ridley (1977) suggests that
chlorophyll b is subject to less photo-destruction than
chlorophyll a because of efficient energy transfer to
chlorophyll a. Virmani, Evans, and Lynn (1975) reported a
70% and 95% initial growth reduction for Chlorella
pyrenoidosa by 0.5 and 1.0 mg/L atrazine respectively. These
results at non-lethal doses of atrazine were interpreted as an indication that cell walls adsorb the herbicide initially,
inhibiting growth but reducing the concentration of herbicide
remaining free in the media, which in turn allowed growth equal to controls. Similar results and conclusions were
presented for atrazine doses of 0.2 mg/L (Gramlick, and Frans
1964). Chlorococcum hypnosporum was not affected by doses of
50 ug/L atrazine. This result was explained as a failure of atrazine to penetrate the thick cell wall of this species
(Torres and 0'Flaherty 1976).
Some reports indicate that sub-toxic levels of triazine
herbicides increase growth and nitrogen content of certain
plant species (Ashton and Crafts 1981). Increases in growth
of Chlamydomonas eugametos grown in simazine, another
triazine-Hill reaction inhibitor, may result from increased
nitrate uptake (Vance and Smith 1969). Boger (1976) found a
33% increase, relative to controls, in chlorophyll a content
per cell and oxygen evolution in Bumilleriopsis filiformis
grown in atrazine-free media after being grown in 1.5 mg/L of
the herbicide. Cell growth was approximately the same as
16
response of Chlorella vulgaris (Torres and O'Flaherty 1976). Atrazine dosage of 0.5 ug/L produced a response that was 156%
of control values.
The wide range of effects reported in Table 1 and the text above illustrates the species specific nature of the
action of atrazine as well as the serious lack of standard
testing conditions. Karlander, Mayasich, and Terlizzi (1983) have pointed out that temperature and light, in addition to atrazine concentration, are important to the toxicity
exhibited by the herbicide. Toxicity was maximized when conditions were optimal for rapid growth. Their results for atrazine inhibition of Nanochloris oculata ranged from 46.2% at 15°C and 0.208 mW/cm to 54% at 25°C and 1.352 mW/cm.
Mechanisms Of Inhibition And Resistance In Algae
As early as 1964, species specific differences in
tolerance to atrazine were postulated as being due to herbicide/receptor site binding (Gramlick and Frans 1964). Herbicide resistance has been induced in Chlamydomonas
reinhardtii by growing it on atrazine-fortified medium. This culture showed atrazine resistance compared to the
17
(complex B) which receives electrons from the primary stable electron acceptor (complex Q) in photosystem II. It has been proposed that atrazine binds to the protein of complex B
preventing electron transfer from complex Q and that
resistance is conferred such that atrazine does not bind to
this protein (Galloway and Mets 1984). Erickson et al. (1984) have seguenced this protein and shown that a single amino acid change in mutant C. reinhardtii cells results in
resistance to the effects of the herbicide on electron transfer. It was also demonstrated that in the absence of atrazine, electron transfer from Q to B is inhibited in mutant cells. This effect has been established by others
(Galloway and Mets 1984). An additional note on the species
specific differences seen in atrazine resistance: Gillham (1978) points out that C. reinhardtii is the only alga for which gene recombination and therefore mutation possibility
during sexual reproduction has been observed. This would indicate that chloroplast gene recombination may be important
in conferring atrazine resistance via mutation in algae.
Atrazine/Atrazine-Analog/Solvent Interactions And Toxicity
Many of the studies cited above used relatively high concentrations of atrazine. The usual method of preparing
atrazine/water solutions is to dissolve the herbicide in a
water soluble organic solvent such as acetone and dilute this
18
O'Kelley (1975a) state the concentration of acetone they used was 0.5% or less, which did not affect growth. Stirring
media overnight containing these same concentrations allowed acetone to evaporate and experiments indicated that acetone had no effect on growth (O'Kelley and Deason 1976). It has been suggested that acetone increases cell permeability and subsequent herbicide uptake by disruption of membrane
structure and transport systems (Stratton, Burrell, and Corke 1982). It was argued that synergistic or antagonistic
interactions between solvent and herbicide can mask the effects of the herbicide and lead to erroneous conclusions
regarding its toxicity. Furthermore, it was suggested that the solvent used in bioassays should react additively with the herbicide and inhibition values should be calculated by subtraction from controls. Data provided by Stratton and
Corke (1981) indicate that atrazine and acetone interact
additively in experiments with Scenedesmus quadricauda at 0.1% and 0.2% acetone but synergistically above 0.2%.
Solvent/herbicide interactions were additive at 0.1, 0.2 and 0.6% acetone, antagonistic at 0.4% but synergistic at 0.8 and 1.0% for Chlorella pryenoidosa. It was suggested that
stimulation of photoactivity in the acetone controls (30-40%
at 1.0% acetone) is the result of solvation of selected
membrane components by acetone and the increased permeability to CO2 that would result.
19
several of its analogs, primarily hydroxy-atrazine. Few
studies have been conducted to assess the degree of
metabolite pollution in fresh water.
Atrazine/deethylated-atrazine ratios of between three and ten have been reported
for Ontario rivers feeding the Great Lakes (Frank et al. 1979). Only recently have studies of atrazine analog
toxicity been undertaken. Atrazine was found to be seven to ten times more inhibitory than the most effective metabolite towards blue-green algae (Stratton 1984). The order of
inhibition by metabolites tested was; deethylated >
deisopropylated > diamine > hydroxy-atrazine. The latter two metabolites were relatively non-toxic, having EC50 values greater than 10 mg/L. This same toxicity sequence has been reported for non-target submerged vascular plants (Jones and
Winchell 1984).
Effects Of Atrazine On Algae - Population Bioassays
The ability of atrazine to inhibit cellular functions and growth in algae is widely accepted. Therefore, its presence will have an impact on these non-target organisms. Toxicity testing with single species can only produce
information about the response of that organism to the
toxicant. This information may not be valid in predicting
any but immediate effects in a dynamic aquatic ecosystem in
which interspecific competition is operating. This has been
illustrated by Mosser, Fisher, and Wurster (1972).
20
in mixed culture in the presence of DDT or PCBs. Pure
culture bioassays with these toxicants had established D.
teriolecta and T. pseudonana as resistant and sensitive,
respectively. T. pseudonana established dominance over D.
teriolecta in control cultures but was not able to compete with the resistant D. teriolecta in the presence of either of
the pesticides. This was the case even at toxicant
concentrations shown to have no effect on either organism in
pure culture.
The ecosystem approach to toxicity testing has, to date
received little attention. This is probably due to the
enormity of the task and difficulty of its interpretation. DeNoyelles, Kettle, and Sinn (1982) exposed duplicate ponds
to 20 and 500 ug/L atrazine; two additional ponds served as
controls. Total biomass, as measured by cell counts and •^'^C
uptake decreased sharply during the first few days in the 500
ug/L ponds but by Day 30 equaled control ponds. The
immediate decrease was interpreted as a direct result of atrazine inhibition of all algal species in addition to the secondary effect of zooplankton grazing on the stressed
population. Later, opportunistic members capable of growing in the presence of atrazine dominated the ponds, bringing total autotroph biomass equal to controls. The lower, 20
ug/L dose of atrazine did not result in a biomass much
different than the controls. Species that grew well in the 500 ug/L ponds after initial inhibition were; Mallomonas spp.
21
C. erosa. Those that experienced decline were; Coelastrum spp., Oocystis spp., Scenedesmus spp., Staurastrum
tetracirum, and Tetraedron minimum. Species that were present in all ponds were; Dinobryon divergens var. Schauinslandii, Kirchneriella lunaris var. irregularis,
Synedra acus, Senedesmus radians, and Uroglenopsis americana.
Additional atrazine exposure of subsamples from each pond
after Day 42 resulted in less inhibition for populations from the higher atrazine-dosed ponds as measured by fluorescence
increases. This was taken as evidence of resistance to
atrazine by the species present. Resistance for one
particular species, Cryptomonas marsonii, was demonstrated in the laboratory. Growth after 19 days in 500 ug/L atrazine was not significantly different than that irt control flasks. Definite responses attributable to the effects of atrazine could not be shown for organisms in the food web of higher
order than the zooplankton.
Another interesting study has been conducted to determine what effect atrazine might have on periphyton community structure in flow-through microcosms. Species enumeration was conducted prior to, during, and after
treatment with 100 ug/L atrazine (Hamala and Kollig 1985). The pretreatment community was composed of (as percentage of total); Chlorophyta 71%, Bacillariophyta 19%, Cryptophyta 3% and Cyanophyta 2%. Following atrazine addition, the
composition relative to controls for treatment and recovery
22
25%, Chlorophyta 15 and 26%, Bacillariophyta 19 and 75%, Cyanophyta 216 and 83%, and Cryptophyta 9 and 8%. During
treatment Ankistrodesmus falcatus, Chlamydomonas spp., Cosmarium reinschii, Scenedesmus dimorphus, Staurastrum
manfeldtii, and Stigeoclonium lubricum all experienced large density decreases. In contrast Chroococcus minor increased
to 224% of control values.
Community productivity, as measured by oxygen production decreased throughout the treatment period. In contrast,
community respiration in the atrazine microcosms was similar
to controls, with slight increases during treatment
attributed to heterotrophic activity. It was suggested that the rapid recovery of community productivity following
treatment indicated the effect of atrazine was algistatic
rather than algicidal. No evidence for induced resistance
could be found for the treated microcosms upon additional atrazine treatment after the recovery period. In contrast to this study. Lynch, Johnson, and Adams (1985) could find no significant or lasting effects on primary productivity or community respiration in a similar study using 25 ug/L
atrazine.
To date, there is little information available
concerning the concentration of atrazine residues in lakes and reservoirs. Most sampling has focused on initial runoff periods. There is a large body of literature concerning the direct effects of atrazine on individual algal species.
23
affect the individual responses of a community of
phytoplankton to a toxicant. Efforts to quantify the
temporal, species specific responses of natural phytoplankton populations are apparently absent from the literature. Such an analysis could reveal not only the direct effects a
toxicant might have but also the indirect secondary effects
such as nutrient competition and interspecific inhibition.
The objectives of this study were to:
I. Document the presence and concentration of
atrazine at three locations in B. Everett Jordan Lake, N.C. from March through July of
1985.
II. Utilize in vitro bioassay techniques to:
A. Evaluate the direct and secondary effects of atrazine on individual species within a
phytoplankton community.
B. Determine whether dose/response inhibitions or stimulations exist for atrazine-treated phytoplankton species.
C. Evaluate the effect of atrazine on species
specific growth kinetics.
D. Determine whether an atrazine action level exists for natural communities of
METHODS
Atrazine Sampling In Jordan Lake
Water samples were taken from Stations H16, NH17, and
NH15 {Figure 1) in conjunction with bi-weekly water quality
sampling trips from March 1985 through July 1985. Atrazine
samples were composites of the euphotic zone (defined as the
zone from the surface to a depth at which 1% of surface
irradiation remains). This depth was chosen to represent the
zone most likely to contain phytoplankton. Approximately 20
liters of lake water were pumped (Jabsco Inc.) directly into
clean carboys. All glassware used for atrazine analyses was
soaked in Micro (International Products Corp.) overnight and
rinsed with at least six aliquots of glass distilled dionized
water. Samples were usually transferred to the laboratory
within four hours for resin adsorption which was always
complete within 36 hours of sampling. No attempt was made to
keep these large volumes of water on ice in the field.
However if sampling-day resin adsorption was not feasible,
the carboys were held at 4°C until the following day.
Adsorption Of Organics From Water Samples
Amberlite XAD resin has been used to concentrate
dissolved organic materials from water with many methods.
Junk et al. (1974) described in detail a method for
25
m 1
'^Z T.I
1
c'.Z
•Si. 1
•
^ 5 "
^:i li «1' ^
=? u to 4t«
^?
uir
1^
-5
w
•'ͣ^^ <r «'
(^
Fig 1. Map of Jordan Lake, N.C., showing sampling station
26 similar method was used to extract atrazine from various
real-water samples at concentrations less than one part per trillion (Richard et al. 1975). A modification of this method has been described by Pfaender et al. (1977) as well as others (Schnare 1979; Dietrich, Millington, and Christman 1983). Several aspects of these methods were combined for
use in the present study.
Amberlite polymeric adsorbent XAD-2 (Rohm and Haas) was
used to extract atrazine from lake water. This choice was
made in anticipation of atrazine levels below the liquid-liquid extraction limit. However, XAD-2 resin requires significant cleanup prior to use. A multi-solvent soxhlet extraction procedure was chosen to accomplish this task similar to that reported by Junk et al. (1974). The resin was cleaned in batches of approximately 150 mL using the following solvents in sequence, each one used twice for 48
hours such that methanol was the first and final solvent:
methanol, acetonitrile, methylene chloride, and diethyl
ether. Resin batches cleaned in this manner were stored under fresh methanol until needed.
Lake water for atrazine analysis was spiked with
simetryne, another s-triazine, prior to resin adsorption for quantification purposes. Simetryne was chosen as the
27
reactions as atrazine. Spiking solutions were made by
dissolving 100 mg simetryne in an appropriate volume of
methanol to give solutions in the range of suspected atrazine levels. Spikes of these solutions were made directly into the sampling carboys one hour prior to the start of resin
adsorption.
During that time period, the adsorption column (Biorad 100 mL.) was loaded with 10 mL resin (approximately 9 g) and the methanol was flushed out with 3-L of distilled dionized
water. Flushing was interrupted after 1-L had passed through
the column to disrupt air bubbles trapped in the resin bed. The spiked carboy containing the lake sample was then
attached to the Biorad column and allowed to flow via gravity through the resin bed. All attachments were of Teflon and the flow rate was maintained at approximately 100 mL/min. Water flowing through the resin bed was collected and
recorded to calculate the volume extracted. Occasionally, high algal biomass and detritus would slow the flow which was
then maintained by a positive pressure of clean, dry nitrogen
on the carboy. After the sample had passed onto the resin
bed (approximately three hours), two 1-L rinses of the carboy with distilled dionized water were allowed to pass through the column. The remaining water was expelled and the resin dried by connecting the column directly to the nitrogen
source. Resin containing adsorbed organics was placed in
25-mL Erlenmeyer flasks, sealed with Teflon tape and stored
28
Elution Of Adsorbed Organics
Micro-soxhlet (25-mL) elution usually took place within
the same week of sampling. The sample resin containing
adsorbed compounds was placed on a bed of glass wool
(previously extracted with methylene chloride) in the
soxhlet. Methylene chloride (15 mL) was added to the round
bottom flask of the soxhlet apparatus and allowed to cycle through the resin for 24 hours. At this time, methylene chloride containing the eluted organics was transferred back to the original Erlenmeyer flask and anhydrous sodium sulfate
was added to remove any remaining water. Finally, the sample was transferred back to the round bottom flask, a 3-ball
Snyder distillation column attached and the solvent was
allowed to evaporate until only 1 mL of sample remained. The
samples were stored in 2-mL vials equipped with Teflon/silicon septum screw caps. Prior to gas
chromatographic analysis, samples were further concentrated
with a gentle stream of clean, dry nitrogen to 25-50 ul,
which represents a concentration factor of approximately
500,000.
Gas Chromatography And Mass Spectrometry Confirmation
Gas chromatographic determination of the presence and concentration of atrazine was usually completed during the
29
gas chromatograph equipped with a Shimadzu integrator was used for all atrazine quantifications. Conditions were:
COLUMN: 30 meter DB-5, 1 um film thickness, J & W
Scientific
FLOWRATE: Helium, 1 mL/min @ 16 PSIG
INJECTOR: Split-splitless injector, split ratio 10:1-20:1, septum purge 4 mL/min. March and April samples analyzed in splitless mode due to low
concentrations
PROGRAM: 180°C (10 min), 6°/min, 260°C (5 min)
INJECTION: 1-2 ul
DETECTOR: Flame ionization detector (FID), 280°C Identification of atrazine and its surrogate,
simetryne was routinely based on a pair of injections. The first injection contained only sample while the second
injection included a standard solution containing both compounds in addition to sample. This second injection produced two peaks of greater amplitude (atrazine and
simetryne) than all others, which allowed correct selection of the two compounds from the first chromatogram and
subsequent quantification. Typically, three sample injections were made and averaged for reported
concentrations. Peak identifications utilizing this method
were confirmed for the June 19^^ sample from Station H16 by
GC/MS. The GC/MS system utilized was a Hewlett-Packard 5710-A gas chromatograph interfaced with a VG-Micromass Model
7070F double focusing mass spectrometer. Mass spectra were enhanced using computer assisted subtraction routines.
Chromatographic conditions were the same as above except that
30
(SGE Corp.). Electron ionization conditions were:
IONIZING ELECTRON ENERGY: 70 eV
ACCELERATING VOLTAGE: 4 KV
TRAP CURRENT: 200 uA
MASS RANGE: 40-400
SOURCE TEMPERATURE: 200°C SOURCE PRESSURE: 5 x 10"° torr CYCLE TIME: 0.7 sec/decade RESOLUTION: 1000 @ 10% valley
Representative gas chromatograms for resin blanks, standards,
and lake samples and the GC/MS confirmation spectra are
presented Figures 2-6. Several organic compounds (Figure 6)
found to be present in the June 19^^ sample from Station HI6
have been previously identified in Haw River water (Dietrich, Millington, and Christman 1983).
The linear response range of the the Carlo Erba FID for atrazine and simetryne, and the response factor of both of these compounds relative to simetone was determined in a single experiment. Equal amounts of each compound were
dissolved in methylene chloride and accurate dilutions of the resulting solutions were made such that a concentration range of two orders in magnitude was obtained for atrazine and
simetryne (10 - 1000 ng/ul). Three solutions covering this
range were made containing the analyte and surrogate standard at equal concentrations and a constant amount (100 ng/ul) of
the internal standard, simetone. Each of these solutions was
injected three times and the average peak count ratio of
atrazine/simetone and simetryne/simetone was plotted against
the known mass ratio of the analyte/internal standards added
tV
u>
Fig 2. Gas chromatogram of XAD-resin blank eluate following
Simetone
•—f
MV\
Atrazine
Simetryne
Fig 3. Gas chromatogram of a standard solution of simetone,
atrazine, and simetryne.
Atrazine
Fig 4. Gas chromatogram of organic compounds present at Station
H16 on June 19^^, showing endogenous atrazine and surrogate
34
! 00
8 0_
6 0_
t J
53
•iS
'i
rn.-.'fM
93
135
i.l.ihiil l|l.:>!j jIM,
its 122
t:.ytt-f ; iTi'iyi'i II iTri"i'p i I'rp'f i r i". ivyriT,-^
^0 80 120
jjijij
_1M
173
215
w'l fm>fiih'l'ri',I'l:W|'iii'i'i|ii'AiiVi'i'.''111l^ͣi',-Ar|t4-;¥frrt+ji
138 Zif
l| .'nnt,
Atrazine
leo 200
11 I'l I [ 11II11JI n ji 1111111| 11 I'l'I', II11111 n
2»0 230
-2JJ.
1 00
8 0.
80.
oj
57
5?
155 170
ins
111II ͣ I I'l'pI'll fi I'l I rii'i'i'i'i'i'i'i'ci'i'i'i'i I'^ri'i'i'it'ii'i'i'i'i'i'i'p;ii'i'ii,i.iviiri!,l.i|,!iii||ji|.|,|U.,iWlJii eo 120
"8 iA,
I|,.-iJiIniiTii'lVi'l'ihVtVf
185 198
Uh.
I'll 11 ri )'i I'M'i'i'i'I'l )i'i I i'l I'l'h I I'i 11 |i'i 11111 ii'i 1111111111II ii| 111111II1111111 160 200 2«0 280
HO
35 ] 00 £0. _2JL1 386 n 5 'Pi I ! lit I! 141
I : h^y^r ^^fWlHflVrtffrt
1 " "I 12 3 '
HO 80
0 1 M
1 0"? 'SH
Methyl Atraton
+r!s'H^UfK-fe'TVMfiiVflt-.'.^Y'W'r^
• !•
za
'i I |i rl I I'l J M I n'i 11II
ISO 160 100
I I'l 11 ͣ rl I I'l I M I n'l 11111111 M 111 I 11 I'l 111111111
2>ia 830 US 100 8 0_ ec_ 311 • 0. 0. *9 99 77 7! ...,.,! Tris(chloropropyl)phosphate II' 139 r%} >75 >77
215 2?3 295 111'l'i'i I I'l'l'i'iiTi'i'i'i'l ii'i I'l 111 ii'i'i'i I'i'i I'l I'l'i'i'i I I'l 1111'H II M I'i'i ivj'i I'l'I I I'l'i'i'i 11 ii'|i 1111'i'i ii'i'i I'ri'p 11 I'l I'l'vi 11111'l'ii'i 111111| 111'. || III ['I'i'i 11
ͣ
10 eo 120 160 200 240 260
100 8 0_ eo. >i . • 0. to. 99 155 1505
1 ir'>'i'|'i'|l| i|'|i|l| I |l| |l| 1111111 i'i'i I'l^i Ji'i I'l I ill'l'i ,'|i| ]U
1<1
Tributylphosphate
21)
11 iiji'...r, I I'l I'll I'I'I'I.'I'l i'I Tl I'i'i ri'l'|i'iri|i'lil'|l 111'l n u| In nn ii p i iin un m niiii| 11 n ii m |iiii| 120 180 200 2«0 260
H? 80
Fig 6. Mass spectra of organic pollutants present in water
sampled at Station H16 on June IS''^" previously determined to be
Response Factor Simetryne/Simetone
<D a
o
§
ͣ
H CO
0) a
ͣ
H
n)
(D M
(I)
Pi
12
10 —
6 —
4 —
2 —
1.121X 1.00
Mass Ratio Siaietryne/Simetone
Fig.7. Flame ionization detector linear range,
response factor of analyte, atrazine/internal
Response Factor Simetryne/Simetone
(D
C
o
i
ͣ
H CO
<a
a >i
H
ͣ
p
g
ͣ
H
to n) 0) M
<D
0*
H
0) Pi
y - 0.050 + 1.121X R = 1.00
^
4 6 8
Mass Ratio Simetzryne/Simetone
12
Fig. 8. Flame ionization detector linear range,
response factor of surrogate, simetryne/internal
38
resulting slopes (response factor) was used to calculate the
atrazine concentration in lake samples as follows:
STD * Ra/Rs * RF
Cone (ug/L)
V
where: STD is the mass of simetryne added in ug Ra is the integrator count for atrazine Rs is the integrator count for simetryne RF is the response factor (0.963), for
(simetryne/atrazine)
V is the volume of water adsorbed in liters. An experiment was designed to demonstrate that
recoveries of the surrogate standard simetryne and analyte atrazine were comparable even under worst-case conditions
(high turbidity). Five 20-L water samples were obtained as
described above from Station NH14 (Figure 1) and spiked with a range of equal amounts of atrazine and simetryne (0.5 - 3.5 ug/L). This range was selected as being representative of
suspected real-water concentrations. Extraction and
concentration took place as described previously. A known
and constant amount of internal standard, simetone, was added
to the final extract prior to gas chromatographic analysis.
Relative integrator count ratios (response factors taken into account) of surrogate standard and analyte to internal
standard, were plotted against the mass of atrazine and
simetryne added to the lake water (Figure 9). The slope of
each line represents recovery for that compound. The slight
upward deflection of the atrazine plot represents the
presence of endogenous atrazine. Atrazine and simetryne were
recovered with comparable efficiency: the slopes were 0.009
39
9
g ^ 1.00
I
^ 0.80 -i
<v c
•H
2 0.60
-H
0.40 H
0.20 _
a) 0.00
Extraction Efficiency of Atrazine
y = 0.074+0.009x R=0.99
ͤ
20 40 60
Mass Added/ ug Atrazine
80
0 c o
to
Extraction Efficiency of Simetryne
0.80
0.60
-•H
CO
rd
(I)
ͣ
3
y = -0.014+0.Ollx R=0.99
0.40
0.20
-20 40 60
Mass Added, ug Simetryne
80
40
'^~^ Bioassav Media and Enumeration Techniques
Species specific phytoplankton responses to atrazine
were determined using a modified version of the Selenastrum capricornutum Printz Algal Assay Bottle Test (Miller et al.
1978). In an attempt to provide a medium suitable for the
most diverse population of algae, and in view of reports that
some species may not use NO3" at all (Moss 1973), soil water
(prepared as described by Pringsheim, 1946) was added to the
medium (40 mL/L) and ammonium nitrate (12.75 mg/L) was
substituted for sodium nitrate.
Atrazine used as dosing reagent, was made up prior to
the bioassays by dissolving 100 mg of atrazine in 100 raL of
acetone. A working stock solution was prepared by adding 10 mL of the acetone solution to stirred, near-boiling water, and the acetone was allowed to evaporate overnight. ,
Dilutions of this solution were made such that 1 mL would
give the appropriate atrazine concentration in the bioassay flasks. These concentrations were 0.25, 1.0, and 50 ug/L and 1.0, 10, and 50 ug/L atrazine for bioassay I and II
respectively.
Water used to seed the bioassay flasks was obtained with a Kemmerer sampler from the SR1008 bridge close to Station NH14 on Jordan Lake. A composite sample representing the
euphotic zone was transferred immediately to the laboratory
where a subsample was concentrated by centrifugation. The
41
volume of bioassay medixom so that 1 mL of this seed, added to
the bioassay flasks, resulted in an initial population of
approximately 3000 cells/mL. Water was collected on June
19*-^ and on October 9, 1985 for the innoculum used in
bioassays I and II respectively.
Triplicate flasks of the control and three atrazine
dosages containing 60 mL of media were incubated in 250 mL
Pyrex Erlenmeyer flasks. The temperature was maintained at
25''C under continuous fluorescent lighting of approximately
400 footcandles. The flasks were rotated daily on a shaker
table to ensure equal light exposure. Cotton was used to
stopper the flasks which were shaken at 110 oscillations per
minute to facilitate gas exchange.
Two methods of cell enumeration were investigated in
this study. The "Vaspar" method is similar to the method of
Campbell (1973). A known volume (15 ul) of the sample is
placed under a cover glass of known surface area. A
paraffin-petroleum jelly mixture is used to seal the cover
glass and prevent drying of the sample. The number of
cells/mL is calculated from the known area of the cover
glass, the area of the transects counted, and the volume of
water placed under the cover glass. This method has the
advantage of allowing oil immersion (1250x magnification)
examination for careful cell identification. A major
difficulty with this method is that cells are quite often
distributed unevenly over the slide, causing variation
42
The second method investigated utilized a hemacytometer
which is commonly used for algal cell enumeration. A grid
embedded in the hemacytometer allows calculation of cells/mL
from the known volvime of sample contained by the counting
chamber. Even distribution of cells is enhanced by the
design of the loading channel. The disadvantage encountered
with this device is a result of its thickness which precludes
the use of oil immersion lenses. However, adequate
resolution is provided at 500x magnification. A comparison
of counts obtained from these two methods is presented in
Table 2.
It was determined that the "Vaspar" method, while
yielding much greater resolution, was too variable for the
purposes of this experiment. It was found that a combination
of these two methods proved to be quite successful.
Quantification was accomplished with a hemacytometer, and
species identification was verified with the "Vaspar" method.
All cell counts were made with a Zeiss GLF compound
microscope equipped with phase contrast. On each counting
day, a 1-mL subsaraple was removed from each flask and cell
clumps broken up by gentle grinding with a tissue grinder. A
loop-full of this sample was transferred to a hemacytometer
for quantification. At least 300 cells from each flask were
counted with the hemacytometer at 50Ox magnification.
Counts were begun on Day 3 of bioassay I (BI) and
continued every two days through Day 9, when it was certain
43
Table 2. A comparison of cell counts (cells/mL) of
Oscillatoria limnetica made with a hemacytometer and by the
Vaspar
48 50 60 69 32 23 100 35 10 58
48
26
0.53
"Vaspar" method.
METHOD Hemacytometer
49
30 45 31 50 25 16
23 33 34
***********
Mean 34
Std. Dev. 11
44
Examination of the results from this experiment indicated
that additional information could be obtained by daily cell
counts, which were begun on Day 2 of bioassay II (BII) and
continued through Day 8. A blind counting technique was
utilized for the second experiment which assured that cell
counts were made without knowledge of the atrazine
concentration associated with that count.
Statistical Treatment Of Algal Responses To Atrazine
During BII, it was noted that certain replicates did not
show good growth comparable to replicates of the same
atrazine dose for any species. No clear reason can be
determined for this occurrence. These replicates, one each
from doses 1, 10, and 50 ug/L atrazine were not included in
the statistical analysis or the graphic illustrations. A
complete listing of the statistical results from these
experiments is presented in Appendix A.
Four statistical models were developed to assess the
species specific responses of algae to different doses of
atrazine. In each model the natural logarithm of cell
count/mL was used as the dependant variable. The independent
variable was atrazine concentration used as a flask dose.
Cell counts for the predominant species or groupings
45
counts on a given day (Model A) or dose related differences in growth rate over a period of days (Model C). The CORR procedure with the Spearman option was invoked to detect the correlation between cell count and atrazine dose on a given day (Model B) or growth rate and atrazine dose over a period
of days (Model D).
It was found that the natural logarithm transformation
of cell count stabilized the variance of the dataset and
enhanced compatibility with the normal distribution. The
specific transformation was log^ (cells/mL+1), which allowed
for cell counts of zero. The model specification for the analysis of variance was:
Response = Constant + Treatment effect.
In this specification, the "constant" can be interpreted as the mean for the control group, and the treatment effects can be interpreted as differences from control for all atrazine
doses.
Least square mean values were calculated for each day/atrazine treatment combination for data found to be statistically significant (P<0.1000, F test) by analysis of variance Models A and C. Pairwise comparisons for these least square mean values were tested using a two sided T test. Rejection of this hypothesis (P<0.1000, T test) was
taken as evidence that the two atrazine doses in question were statistically different. The computing formula used in
the least square models was:
46
Spearman rank correlation coefficients were calculated in Models B and D to determine the linear dependence of cell count on atrazine dose. The hypothesis that the correlation
coefficient r equaled zero was tested {P<0.1000, T test) with
rejection indicating that the dose/response inhibition or stimulation was statistically significant. The formula for the Spearman correlation was:
ECa^-a) (Ci-c)
r=
'\|e (ai-c)2 E(ci-c)2)
where: a-^ is the rank of the i^^ atrazine value
Cj_ is the rank of the i^^ cell count value
a and c are the means of the aj_ and Cj^ values
47
RESULTS AND DISCUSSION
Atrazine Flow Dynamics In Jordan Watershed
B. Everett Jordan Lake has been described as having four
distinct segments. These are defined by the causeways
carrying traffic across the New Hope arm and the "narrows", a
constricted portion upstream from the confluence of the Haw
and New Hope arms on the New Hope side (Figure 1). Both
rivers carry point and non-point discharges which, during low flow conditions, make up a large percentage of the total flow into the lake. However, the causeways on the New Hope side cause a great deal of nutrient sedimentation, and the
resulting water quality has supported extensive recreational
usage.
The Haw River supplies the lake with much more water
than the New Hope flow (Figures 10 and 11). The 20-year average Haw to New Hope flow ratio is 4:1; the range is due to greater winter runoff from the larger watershed of the Haw River (Weiss 1986). During extreme hydrological events,
water from the Haw River flows up the New Hope arm of the lake. Muddy water from the Haw was observed at the NC-64 causeway following one occurence when the lake level rose eight feet in three days during February, 1985.
Inter-segment volume fluxes in Jordan Lake have been described for the water year October 1982 - September 1983