Willingness to Expend Effort for Reward and Substance Use Outcomes in Treatment
Elissa Scherer
The University of North Carolina at Chapel Hill Department of Psychology and Neuroscience
Senior Honors Thesis Spring 2019
Acknowledgements
First and foremost, I would like to thank Dr. Daughters for her support and feedback throughout this process. Through my work with her, I have been pushed to grow tremendously as a
researcher. As I leave my undergraduate career, I feel inspired and prepared to work in this field as a result of Dr. Daughters mentorship. Additionally, I would like to thank Catherine Paquette and Dr. Dichter for agreeing to sit on my committee and for providing additional support
Abstract
Individuals in substance use (SU) disorder treatment are attempting to maintain abstinence, but the positive rewards associated with abstinence are uncertain. Understanding how individuals weigh reward probability (RP) and reward magnitude (RM) in decision making is salient for understanding the factors associated with continued abstinence. This study sought to test
associations between effort expenditure for reward and SU outcomes among individuals entering outpatient SU treatment, and if SU moderates relationships between effort expenditure from pre-treatment to 3-month follow-up. Participants (N=86) completed the Effort Expenditure for Rewards Task (EEfRT) and the Timeline Followback (TLFB) at baseline and 3-month follow-up assessments. The independent variables in both primary and moderation analyses were
Willingness to Expend Effort for Reward and Substance Use Outcomes in Treatment
Every year, an estimated 740 billion dollars are lost to substance use disorder [SUD] in the United States and more than 90,000 American deaths are linked to alcohol and drug use [U.S. National Institute on Drug Abuse (NIDA), 2017] . In 2015, it was estimated that 21.5 million people aged 12 or older qualified for SUD in the United States (Lipari & Van Horn, 2017). The scope of this problem highlights an important area of need for furthering dissecting factors that contribute to the development and maintenance of SUD to alleviate this public health crisis. One major factor known to be associated with SUD is the dysregulation of the natural reward
processing systems of the brain (Kelley & Berridge, 2002). However, detailed information on certain aspects of reward processing, such as how individuals suffering from SUD weigh likelihood of receiving rewards with the potential benefits or magnitude of said rewards in decision making is still unclear. Further understanding of how various aspects of reward are related to decision making in SUD could generate greater understanding of the development and maintenance of SUD, which in turn could aid in interventions aiming to prevent SUD from occurring or aid in treatment for SUD. The goal of this study is to test the relationship between effortful decision making for uncertain reward and substance use among individuals with SUD. Reward Dysregulation and Substance Use
use, for instance, stronger aversive-withdrawal states than those associated with natural rewards (Kelley & Berridge, 2002).
Substance use behavior is thought to be strongly influenced by the positive rewards that are associated with use (Kelley & Berridge, 2002). Additionally, aversive states such as
withdrawal are thought to serve as motivators for substance use through moderating the strength of incentives to seek the reward associated with using said substance (Kelley & Berridge, 2002). Differences in reward processing within the population of individuals who suffer from SUD have been shown to be predictive of abstinence at follow-up (Gowin, Ball, Wittmann, Tapert, & Paulus, 2015).
Theories that reward processing is dysregulated in those who suffer from SUD are
supported by findings from imaging studies in which chronic substance use has been shown to be related to alterations in frontal lobe volume (Schlaepfer et al., 2006; Wang et al., 2012). The frontal cortex is associated with decision-making and reward processing (Kennerley & Walton, 2011), which serves to support arguments that reward processing becomes dysregulated through physiological, in addition to psychological changes. Additionally, neural activity has been shown to differ significantly between individuals with substance use disorder and healthy controls on reward processing tasks with substance and monetary related reward cues (García-García et al., 2014).
Dysregulated Decision-Making in Substance Use Disorder
The use of alcohol and illicit substances is associated with immediate positive
making consequences, implementation of choices that involve motivation, inhibitory processes and self-regulation, and the processing of feedback that leads to learning associated with reinforcement of substance use (Verdejo-Garcia, Chong, Stout, Yücel, & London, 2018). The altered reward system associated with SUD has been shown to be related to differential levels of risk taking decisions in response to varying dimensions of probability and value of reward (Voon et al., 2015), as well as a larger propensity to choose superficially attractive rewards in decision making tasks (Verdejo-Garcia et al., 2018).
Effort Expenditure for Reward Task
Within the last 10 years, a new measure has emerged through which to measure willingness to expend effort for reward: the Effort Expenditure for Rewards Task (Treadway, Buckholtz, Schwartzman, Lambert, & Zald, 2009), or EEfRT, which quantifies the willingness to put forth effort to receive differing levels of reward while weighing changing probabilities of receiving said rewards in decision making. The measure was designed to be an objective measure of anhedonia, or decreased sensitivity and motivation to seek reward (Treadway et al., 2009). Importantly, while several measures had previously quantified sensitivity to positive stimuli and responsiveness to reward cues associated with reward probability in individuals experiencing anhedonia, no behavioral measure until the EEfRT quantified the multiple factors (e.g. likelihood of receiving reward, amount of reward, effort needed to receive the reward, etc.) that interact to predict the decision to seek reward (Treadway et al., 2009).
Since the design of the EEfRT, the measure has been used to quantify the interacting aspects of decision-making behavior related to reward in populations with psychiatric diagnoses that are hypothesized to suffer from reward dysregulation. For example, individuals with
maximize reward on the EEfRT task (McCarthy, Treadway, Bennett, & Blanchard, 2016; Treadway, Peterman, Zald, & Park, 2014). Additionally, extreme ambitions in those
experiencing bipolar disorder have also been linked to effortful decision making as measured by the EEfRT (Hershenberg et al., 2016).
Additionally, studies utilizing populations with disorders with similar reward processing dysregulation to SUD, such as the obese population (García-García et al., 2014), have linked obesity to lowered willingness to expend effort for reward (Mathar, Horstmann, Pleger,
Villringer, & Neumann, 2016) and have established a link between greater adherence to weight-loss treatment and willingness to expend effort for an uncertain reward (Mata et al., 2017). Effort Expenditure for Reward and Substance Use Disorder
It is proposed that the dysregulated reward system of those with a SUD is related to lowered sensitivity and motivation to seek out natural rewards (Volkow et al., 2010).
The EEfRT was originally designed to quantify how anhedonia is associated with
various aspects of decision making when seeking reward, and those experiencing anhedonia have demonstrated reduced willingness to expend effort for reward (Bryant, Winer, Salem, & Nadorff, 2017; Treadway et al., 2009). Anhedonia has previously been shown to be related to SUD
diagnosis (Garfield, Lubman, & Yücel, 2014), highlighting the consequences of anhedonia for those who are suffering from SUD and the potential for altered effortful decision making when contemplating varying reward probabilities and magnitudes.
Since the EEfRT was designed within the last 10 years, there are very few studies evaluating effort-expenditure for reward among individuals with a SUD. Two studies thus far have used the EEfRT within the population of individuals who use substances (Lawn et al., 2016; Rubenis, Fitzpatrick, Lubman, & Verdejo-Garcia, 2018). The first of these studies
demonstrated that using cannabis is related to lower effort expenditure for reward on the EEfRT task when compared to participants who were given a placebo (Lawn et al., 2016), highlighting at least temporary influences of substance use on effortful decision making for reward. The second, more recent study, examined relationships between the EEfRT and changes in treatment motivation, and found no significant associations between the two (Rubenis et al., 2018).
However, this study was limited to methamphetamine users, rather than a larger more diverse range of individuals who suffer from SUD and the study lost 31% of their participants to
attrition, which could theoretically have had significantly less motivation to attend treatment than those who remained in the study. Further research is needed to understand how effort
Several factors have been consistently shown to be related to substance use outcomes (e.g. abstinence, relapse, meeting criteria for SUD) including sex, comorbid psychiatric disorders including anxiety, depression, anti-social personality disorder, and borderline personality
disorder, age, race, and IQ. Both male and female sex has been shown to be related to higher chances of substance use following treatment in different contexts (Soyka & Schmidt, 2009; Walitzer & Dearing, 2006; Wilson, Bandyopadhyay, Yang, Cerulli, & Morse, 2018).
Additionally, comorbid psychiatric disorders including anxiety (Schellekens, de Jong, Buitelaar, & Verkes, 2015), depression (Suter, Strik, & Moggi, 2011), anti-social personality disorder (Goldstein et al., 2001; Sargeant, Bornovalova, Trotman, Fishman, & Lejuez, 2012), and
borderline personality disorder (Zanarini et al., 2011) have all been shown to be related to worse substance use outcomes. Young age has been shown to be associated with worse substance use outcomes during treatment (Harrison & Asche, 1999). Better substance use outcomes for White, when compared to minority, individuals has also been highlighted multiple times (Chartier & Caetano, 2010; Greenfield et al., 2018).
Gaps in the Literature
Individuals in SUD treatment are attempting to maintain abstinence, but the positive rewards associated with abstinence are uncertain. Understanding how individuals weigh both reward probability and reward magnitude in decision making is salient for better understanding of the factors associated with abstinence. Additionally, the ability to respond to reward has been shown to increase with abstinence (Garfield et al., 2014; Gowin et al., 2015), highlighting a need for understanding not only how effort-based decision making predicts return to substance use, but how substance use predicts effort-based decision making. The goals of this study are therefore the following:
Aim 1. To test the relationship between pre-treatment effort-based decision making and frequency of substance use up to a 3-month follow-up.
Hypothesis: Individuals who more frequently choose to engage in the hard task of the EEfRT for low and medium chances of reward will report fewer substance use days between pre-treatment and a 3-month follow-up.
Aim 2. To test the effect of substance use frequency during the follow-up period on change in effort expenditure for reward.
Hypothesis: Substance use (i.e., proportion of days of substance use) will moderate the change in effort expenditure (i.e., engage in the hard task of the EEfRT for low and medium chances of reward), such that substance use will attenuate the improvement in effort expenditure between pre-treatment and the 3-month follow-up.
Methods Participants
Participants were recruited from an intensive outpatient treatment program in the larger Raleigh, North Carolina community for participation in a randomized control trial testing the effect of a behavioral treatment. Participants were excluded from the study if they met criteria for current psychosis as measured by the MINI-K (Sheehan et al., 1997), if they were over the age of 65 or under the age of 18, if they had completed more than 6 weeks of I.O.P. treatment, or if they scored below a 42 on the Wide Range Achievement Test (Jastak & Wilkinson, 1984).
Participants were included in the current study if they had complete measures from the baseline assessment and the three-month follow-up, which generated a final sample of 86 adults (72.1% male: Mage = 41.0 SD = 11.0, range 21-62; 54.7% Non-Hispanic White, 41.9% Black/African American; neither Hispanic or Asian ethnicity were endorsed).
General Procedures
Measures
Participant Characteristics and Survey Measures
Demographic information was assessed at baseline using a questionnaire administered electronically on an iPad. Age (continuous), sex(male/female), race (white, African-American, Asian/Southeast Asian, Native American/American Indian, or other), ethnicity (Hispanic/non-Hispanic) and education (number of years completed) were all assessed in order to collect information on potential covariates.
One additional measure was taken from the larger battery of survey measures as a potential covariate: the Circumstances, Motivation, and Readiness scale (CMR; De Leon, Melnick, Kressel, & Jainchill, 1994). This scale measures an individual’s potential to remain engaged in substance use treatment based on their Circumstances (exterior motivations or pressures to attend treatment), Motivation (intrinsic desire to change substance use habits), and Readiness (an individual’s perception of their own need for treatment). Participants rated statements on a 5-point Likert scale ranging 1=strongly disagree to 5=strongly agree. The total score is included as a covariate in the current study. The hypotheses of this study were built on the assumption that participants were attempting to achieve abstinence, which is not universally true of those in substance use treatment. Including the CMR as a covariate serves to control for the possibility that a participant was not attempting to achieve abstinence.
Comorbid Psychopathology
(GAD), anti-social personality disorder (ASPD), and borderline personality disorder (BPD). Additionally, participants were evaluated to see if they meet criteria for several substance use disorders, including alcohol use disorder, stimulant use disorder, cocaine use disorder, opiate use disorder, hallucinogen use disorder, dissociative use disorder, inhalant use disorder, cannabis use disorder, tranquilizer use disorder, and miscellaneous substance use disorder. For the purposes of these analyses, a dummy variable (1: meets criteria, 0: does not meet criteria) was generated to indicate if a participant met criteria for any of the aforementioned psychiatric or substance use disorders. The MINI has been shown to be a valid and reliable measure in comparison to the Structure Clinical Interview for Diagnostic and Statistical Manual (Sheehan et al., 1997), and has been used previously in populations with substance use disorder (Langås, Malt, & Opjordsmoen, 2011; Magura, Rosenblum, & Betzler, 2009).
Effort Expenditure for Rewards Task (EEfRT)
Willingness to expend effort for reward was assessed with the Effort Expenditure for Rewards Task (Treadway et al., 2009). The EEfRT is a measure of an individual’s propensity to expend effort for varying magnitudes of monetary reward, dependent on the probability of receiving said reward (Treadway et al., 2009). The 20-minute task consists of a series of individual trials in which participants choose between an easy or a hard task for varying
magnitudes and probabilities of reward. The hard task involves pressing a computer key with the pinky of the non-dominant hand 100 times within 21 seconds, and the easy task involves
winning and the possible compensation for the hard task for five seconds, during which time they are given the choice of the easy and the hard task. If a decision for the easy or hard task is not selected within the five seconds, the difficulty of the task is randomly chosen by the computer.
Since participants played continuously for 20 minutes, and hard trials took longer than easy trials, trial number was variable. In order to standardize analyses, only the first 40 trials were included in analyses. Included in analyses were the total hard choices and proportion of hard choices for each probability of reward (low, medium, high) at baseline assessment and 3-month follow-up. The EEfRT has been shown to have high test-retest reliability in individuals with cognitive deficits (Horan et al., 2015; Reddy et al., 2015). Additionally, reward sensitivity beta values were calculated to quantify an individual’s responsiveness to reward magnitude based on the probability of receiving that reward. These betas were generated by performing logistical regressions for each participant of the association of the expected value of the reward, defined as the probability of receiving the reward multiplied by the magnitude of the reward, and hard/easy task choice on the EEfRT (Treadway et al., 2014). Betas were excluded if they fell greater than two standard deviations above the mean (N=31 [15 excluded from baseline and 16 excluded from 3-month follow-up]).
Timeline Followback
Substance use during the assessment period was assessed using the clinician-administered Timeline Followback (TLFB) (Sobell & Sobell, 1992). Participants are asked to recount the type and amount of substance use for each day over an assessment period. During this study,
participants were asked to recount information about all substances they might have used over the assessment period, and were specifically asked to verify if they had used any alcohol,
dissociatives, painkillers, inhalants, opiate dependency medications or any other non-prescribed substances during the time between baseline and the 3 month follow-up and between the baseline assessment and the 30 days prior to the start of intensive outpatient treatment. The TLFB has been used extensively in the field (Hjorthøj, Hjorthøj, & Nordentoft, 2012) and has been shown to have high validity and agreement with urinalysis results. Proportion of days used was
generated by taking the total number of days used between the baseline assessment and the 3-month follow-up and dividing it by the total number of days assessed. Additionally, in order to evaluate potential covariates, the proportion of days used between the baseline assessment and the 30 days before intensive outpatient treatment began was calculated by dividing the total number of days of use by the number of days assessed. Finally, information from the TLFB was used to calculate number of days since participants last use of any substance at the baseline assessment.
Statistical Analysis
Analyses began by generating descriptive statistics (mean, SD, range) on age, number of years of education, CMR Total Score, days since last use at the baseline assessment, the
proportion of the days used between 30 days before starting intensive outpatient treatment and the baseline date and between baseline and 3-month follow-up, the total hard choices and hard choices for low, medium, and high probability of reward on the EEfRT at both baseline and 3-month follow-up timepoints, and reward sensitivity betas for total hard choices and hard choices for low, medium, and high probability of reward at baseline. Additionally, percent male, percent white/black/ Native American/Other, and percent met criteria for each DSM-5 comorbid
To identify possible covariates, independent samples t-tests and correlation analyses were performed to assess significant predictors of baseline proportion of days used and baseline EEfRT total hard choices, and baseline EEfRT hard choices at low, medium, and high reward probability. For categorical variables (sex, race, and DSM-5 disorders) independent samples t-tests were generated to determine if any differences existed in mean proportion of days used from 30-days prior to admission to outpatient treatment and the baseline assessment and total percent of hard choices on the EEfRT, as well as EEfRT hard choices at every probability level between groups. If a participant characteristic was endorsed by less than 5% of the sample (e.g. Obsessive Compulsive Disorder), then t-tests were not conducted due to a lack of power to detect differences. For continuous variables (age, years of education, days since last use at baseline, and proportion of days used prior to baseline, CMR Total score, and reward magnitude betas for total hard choices and each respective reward probability) correlations were generated with the
proportion of days used from 30-days prior to admission to outpatient treatment and the baseline assessment and total percent of hard choices on the EEfRT, as well as EEfRT hard choices at every probability level. Variables with significant associations were included as covariates in subsequent hierarchical linear regression analysis for each respective outcome variable.
Hierarchical regression models were generated to analyze relationships between hard choices on the EEfRT (total, low, medium, and high probability) and future days of use up to the 3-month follow-up for a total of four models. Identified covariates were entered into step 1 for all 4 models. In step 2, proportion of hard choices (total, low, medium, and high probability) were added into their respective models.
Similarly, hierarchical regression models were generated to test if substance use
follow-up at each probability of reward for a total of four models. In step 1, identified covariates were regressed on the proportion of hard choices on the EEfRT (total, low, medium, and high). In step 2, substance use between baseline and 3-month follow-up as well as baseline proportion of total, low, medium, or high probability were added into their respective models. Finally, in step 3, the interaction term between proportion of days used and proportion of hard choices (for each level of reward probability) was added to assess potential moderating factors of substance use on the relationship between the EEfRT at baseline and 3-month follow-up.
Results Sample Characteristics
Participants were majority male (72.1% male) and white (55.7% White, 41.9% Black, 4.7% Native American, 3.5% Other). 2.3% met criteria for panic disorder, 8.1% met criteria for agoraphobia, 16.3% met criteria for social anxiety disorder, 4.7% met criteria for obsessive compulsive disorder, 8.1% met criteria for post-traumatic stress disorder, 9.3% met criteria for generalized anxiety disorder, 7.0% met criteria for depression, 38.4% met criteria for ASPD, 19.8% met criteria for BPD, 65.1% met criteria for alcohol use disorder, 26.7% met criteria for stimulant use disorder, 60.5% met criteria for cocaine use disorder, 46.5% met criteria for opiate use disorder, 9.3% met criteria for hallucinogen use disorder, 4.7% met criteria for dissociative use disorder, 4.7% met criteria for inhalant use disorder, 39.5% met criteria for cannabis use disorder, 27.9% met criteria for tranquilizer use disorder, and 10.5% met criteria for
62.7 (SD: 107.4, range: 0-832), and the average proportion of days used in the assessment period before baseline was 0.15 (SD: 0.20, range: 0.00-0.87).
Identification of Covariates
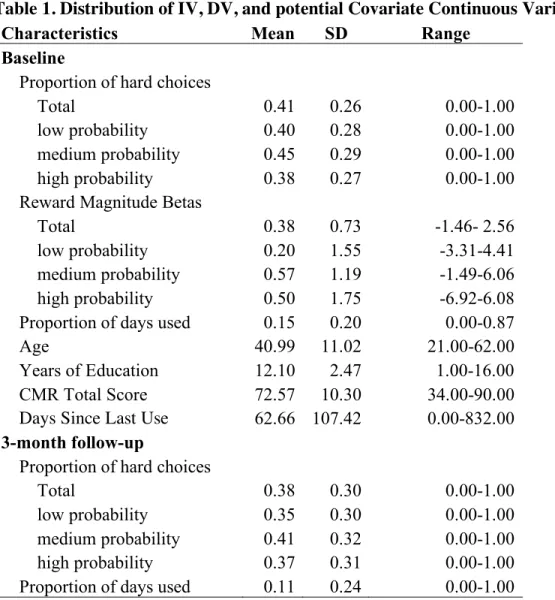
Table 1 displays means, standard deviations, and ranges for all continuous IVs, DVs, and potential covariates. Table 2 displays mean differences and counts for all baseline categorical IVs, DVs, and potential covariates. Table 3 displays correlations between potential continuous covariates and the IVs utilized in this study. Independent sample t-tests between potential categorical covariates and proportion of days used at baseline assessment yielded no significant associations. In correlation analyses, the number of days since a participant had last used any substance was significantly correlated with the proportion of days used at the baseline
assessment. Independent sample t-tests between potential categorical covariates and total hard choices on the EEfRT yielded significant associations with anti-social personality disorder, stimulant use disorder, and hallucinogen use disorder. Hard choices for low probability of reward was significantly associated with alcohol use disorder, stimulant use disorder, opiate use disorder and hallucinogen use disorder. Hard choices for medium probability of reward was significantly associated with anti-social personality disorder. Hard choices for high probability of reward was significantly associated with post-traumatic stress disorder, alcohol use disorder, and
hallucinogen use disorder. Reward sensitivity beta was significantly associated with total hard choices and hard choices for low-probability of reward. Age was significantly associated with hard choices for reward across all reward values.
Hierarchical Linear Regression Modeling
reward probability (low, medium, or high) significantly predicted frequency of substance use (Table 4).
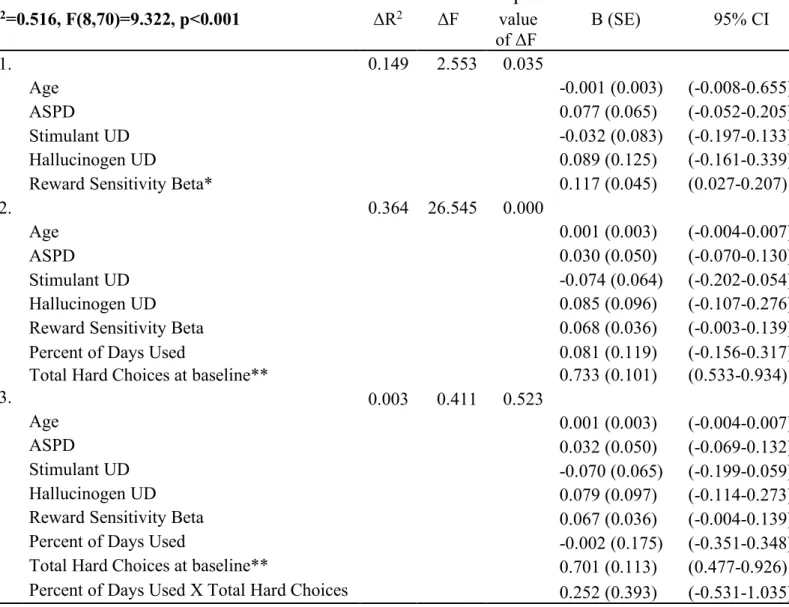
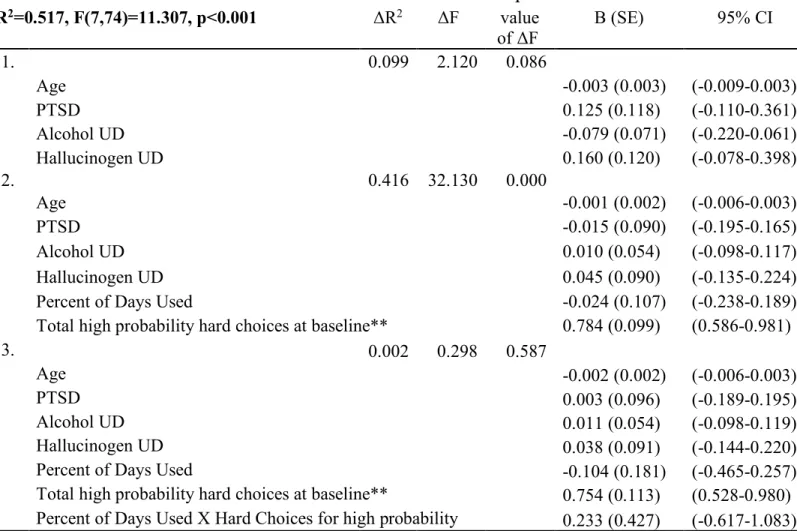
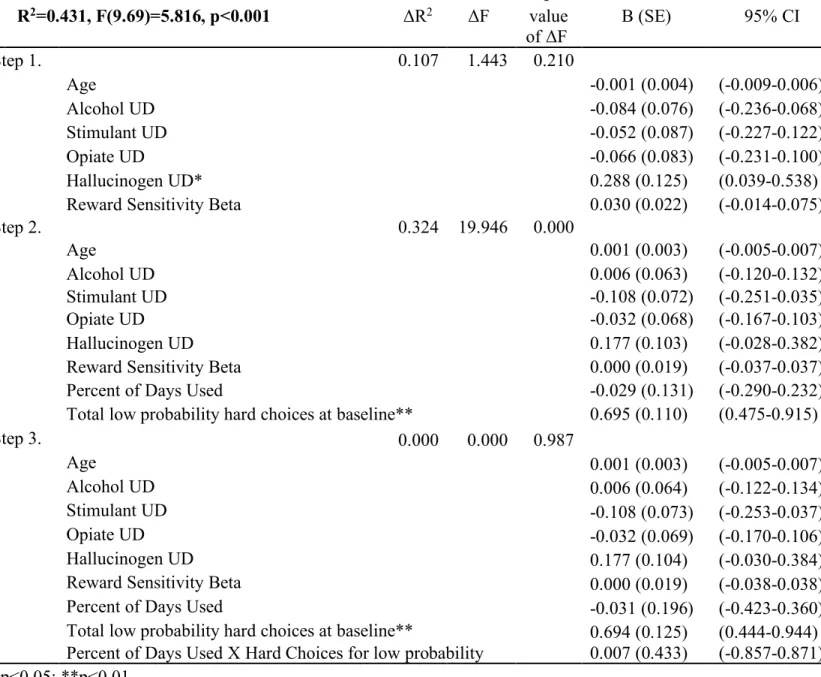
In moderation analyses, there were no significant interaction effects, such that the interaction between substance use frequency and hard choices (across all reward levels) was not significantly associated with hard choices at the 3-month follow-up (Tables 5-8). Across all reward levels, baseline hard choices was positively and significantly associated with hard choices at the 3-month follow-up.
Discussion
This study utilized the effort expenditure for reward task (EEfRT) to test the association between pretreatment willingness to expend effort for a reward and the frequency of substance use during a 3-month follow-up period among adults enrolled in intensive outpatient treatment for substance use. Additionally, this study analyzed the relationship between performance on the EEfRT between baseline assessment and a 3-month follow-up assessment and analyzed potential moderation of substance use between these time points. The primary hypothesis was that
choosing to put forth effort for the hard task when reward was uncertain (12% and 50% chance of winning) would predict substance use at follow-up. Additionally, it was hypothesized that substance use between baseline and 3-month follow-up would moderate the relationship between hard choices for uncertain reward (12% and 50%) on the EEfRT between assessments. It was also hypothesized that similar modeling for the previous hypotheses for total hard choices and hard choices for high probability of reward would yield no significant associations.
substance use. Similarly, the second hypothesis was unsupported. Substance use between assessments did not moderate the relationship between the EEfRT hard choices for low and medium probabilities of reward at baseline and follow-up. The third hypothesis was supported: there were no significant relationships between hard choices for high probability for reward/total hard choices and substance use at follow-up, nor did substance use moderate the relationship between either at baseline with its counterpart at 3-month follow-up. The relationship between EEfRT at baseline and EEfRT at follow-up was significant for total hard choices and all levels of reward probability (low, medium, high), providing support for test-retest reliability of the EEfRT in the SUD population.
EEfRT does measure how individuals value reward based on probability and magnitude when making effortful decisions (Treadway et al., 2009), it is possible that it is not mapping on to the decision making involved in an abstinence attempt, as it does not capture the negative affect that may drive impulsive decisions to use.
Abstinence attempts are associated with high levels of physical and psychological distress (U.S. Department of Health and Human Services, 2016) and the negative sensations associated with withdraw serve as powerful drives to use (Koob & Le Moal, 2001). The ability to withstand psychological distress has been shown to be associated with abstinence duration (Daughters, Lejuez, Kahler, Strong, & Brown, 2005). It is possible that distress tolerance, or the ability of an individual to endure aversive physical, psychological, and emotional states (Brown, Lejuez, Kahler, Strong, & Zvolensky, 2005), could tie in to effortful decision making. The tendency to act impulsively as related to distress has been shown to be related to substance use and consequences associated with substance use (Kaiser, Milich, Lynam, & Charnigo, 2012). Additionally, low, but not high, levels of distress tolerance have been shown to significantly interact with negative affect in predicting alcohol use (Gorka, Ali, & Daughters, 2012). It is possible that effortful decision making is impacted by distress tolerance, such that individuals with high distress tolerance are more able to exert effort for uncertain reward, while those with lower distress tolerance are unable to do so.
Limitations and Future Directions
The sample contained an unusual group make-up in terms of psychiatric comorbidity. It is estimated that 32.8% of Individuals in treatment for alcohol use disorder and 44.3% of
depressive disorder is related to anhedonia (Keedwell, Andrew, Williams, Brammer, & Phillips, 2005), the main construct the measure is measuring (Treadway et al., 2009), it is possible that relationships between the EEfRT and substance use exist among individuals with psychiatric comorbidities associated with anhedonia, but there was not a large enough sample size of these individuals to distinguish differences.
The lack of significant relationships in this study raises questions about how effortful decision making is related to substance use or consequences associated with substance use disorder. Future studies may explore if effortful decision making, as related to affective and physical states more closely related to an abstinence attempt are related to consequences associated with substance use disorder. For example, a modified version of the EEfRT that involved effortful decision making with a physically or psychologically distressing task could better capture how effortful decision making, in combination with distress tolerance, might be associated with substance use outcomes.
Another possible direction for future research could be to investigate the relationship between the EEfRT between individuals with substance use disorder and healthy controls. While substance use was not predicted by within group differences on the EEfRT, it is possible that effortful decision making is dysregulated between those who develop SUD and healthy controls.
Finally, in t-tests there were several significant differences in EEfRT behavior based on drug of choice, which could be further evaluated in future studies.
Tables
Table 1. Distribution of IV, DV, and potential Covariate Continuous Variables (N=86)
Characteristics Mean SD Range
Baseline
Proportion of hard choices
Total 0.41 0.26 0.00-1.00 low probability 0.40 0.28 0.00-1.00 medium probability 0.45 0.29 0.00-1.00 high probability 0.38 0.27 0.00-1.00 Reward Magnitude Betas
Total 0.38 0.73 -1.46- 2.56 low probability 0.20 1.55 -3.31-4.41 medium probability 0.57 1.19 -1.49-6.06 high probability 0.50 1.75 -6.92-6.08 Proportion of days used 0.15 0.20 0.00-0.87 Age 40.99 11.02 21.00-62.00 Years of Education 12.10 2.47 1.00-16.00 CMR Total Score 72.57 10.30 34.00-90.00 Days Since Last Use 62.66 107.42 0.00-832.00 3-month follow-up
Proportion of hard choices
Table 2. T-test comparisons of proportion of days used at baseline and total percent of EEfRT hard choices by sociodemographic/MINI diagnostic criteria (N=86)
Mean (SD) Substance
Use Days Proportion of Hard Choices
Total Low Medium High Sex
Female (N=24) 0.18 (0.24) 0.38 (0.26) 0.34 (0.26) 0.44 (0.30) 0.35 (0.26) Male (N=62) 0.14 (0.18) 0.42 (0.27) 0.42 (0.28) 0.45 (0.29) 0.39 (0.28) White
No (N=39) 0.18 (0.24) 0.42 (0.28) 0.40 (0.30) 0.46 (0.30) 0.38 (0.29) Yes (N=47) 0.13 (0.15) 0.40 (0.25) 0.39 (0.27) 0.44 (0.29) 0.38 (0.26) Black
No (N=50) 0.15 (0.20) 0.42 (0.25) 0.41 (0.27) 0.46 (0.29) 0.40 (0.26) Yes (N=36) 0.16 (0.20) 0.39 (0.28) 0.38 (0.30) 0.43 (0.30) 0.36 (0.29) PD +
Agoraphobia
No (N=75) 0.15 (0.20) 0.39 (0.25) 0.37 (0.27) 0.43 (0.28) 0.36 (0.26) Yes (N=7) 0.18 (0.24) 0.54 (0.29) 0.57 (0.30) 0.54 (0.34) 0.52 (0.30) PTSD
No (N=75) 0.15 (0.20) 0.39 (0.25) 0.37 (0.27) 0.44 (0.29) 0.35 (0.25)* Yes (N=7) 0.23 (0.21) 0.55 (0.30) 0.54 (0.34) 0.50 (0.30) 0.60 (0.30) GAD
No (N=74) 0.16 (0.20) 0.41 (0.26) 0.40 (0.28) 0.45 (0.29) 0.38 (0.27) Yes (N=8) 0.13 (0.13) 0.32 (0.25) 0.32 (0.26) 0.35 (0.29) 0.28 (0.25) SAD
No (N=68) 0.14 (0.19) 0.39 (0.26) 0.38 (0.28) 0.43 (0.29) 0.37 (0.27) Yes (N=14) 0.23 (0.24) 0.45 (0.26) 0.45 (0.27) 0.49 (0.30) 0.40 (0.26) MDD
No (N=76) 0.15 (0.19) 0.40 (0.26) 0.39 (0.28) 0.44 (0.29) 0.36 (0.27) Yes (N=6) 0.15 (0.26) 0.46 (0.25) 0.42 (0.31) 0.49 (0.29) 0.46 (0.23) ASPD
No (N=49) 0.15 (0.22) 0.35(0.25)* 0.34 (0.26) 0.38 (0.29)* 0.33 (0.26) Yes (N=33) 0.16 (0.17) 0.47(0.26) 0.46 (0.29) 0.53 (0.28) 0.43 (0.27) BPD
No (N=65) 0.15 (0.21) 0.38 (0.25) 0.36 (0.26) 0.41 (0.27) 0.35 (0.25) Yes (N=17) 0.16 (0.14) 0.50 (0.29) 0.48 (0.30) 0.55 (0.33) 0.46 (0.29) Alcohol UD
Stimulant UD
No (N=59) 0.15 (0.21) 0.36 (0.25)* 0.34 (0.27)** 0.41 (0.28) 0.34 (0.24) Yes (N=23) 0.16 (0.16) 0.50 (0.27) 0.51 (0.26) 0.52 (0.29) 0.45 (0.31) Cocaine UD
No (N=30) 0.17 (0.23) 0.35 (0.21) 0.33 (0.22) 0.40 (0.26) 0.32 (0.20) Yes (N=52) 0.14 (0.18) 0.43 (0.28) 0.42 (0.30) 0.47 (0.30) 0.40 (0.29) Opiate UD
No (N=42) 0.14 (0.18) 0.35 (0.24) 0.33 (0.25)* 0.40 (0.26) 0.33 (0.25) Yes (N=40) 0.17 (0.22) 0.45 (0.28) 0.45 (0.29) 0.49 (0.31) 0.42 (0.28) Hallucinogen UD
No (N=74) 0.16 (0.20) 0.38 (0.26)* 0.37 (0.27)* 0.42 (0.29) 0.35 (0.26)* Yes (N=8) 0.11 (0.16) 0.58 (0.21) 0.59 (0.23) 0.60 (0.24) 0.55 (0.24) Cannabis UD
No (N=48) 0.15 (0.22) 0.37 (0.24) 0.35 (0.26) 0.40 (0.27) 0.35 (0.24) Yes (N=34) 0.15 (0.17) 0.45 (0.28) 0.44 (0.29) 0.50 (0.30) 0.41 (0.30) Tranquilizer UD
No (N=58) 0.17 (0.22) 0.38 (0.25) 0.37 (0.27) 0.42 (0.28) 0.35 (0.25) Yes (N=24) 0.12 (0.14) 0.45 (0.28) 0.44 (0.28) 0.49 (0.31) 0.43 (0.29) Misc. UD
No (N=73) 0.15 (0.21) 0.39 (0.25) 0.38 (0.26) 0.44 (0.29) 0.36 (0.25) Yes (N=9) 0.14 (0.14) 0.46 (0.34) 0.45 (0.36) 0.46 (0.33) 0.48 (0.37) PD: panic disorder, PTSD: post-traumatic stress disorder, GAD: generalized anxiety disorder, SAD: social anxiety disorder, MDD: major depressive disorder, ASPD: anti-social personality disorder, BPD: borderline personality disorder, UD: use disorder
Substance Use Days: Proportion of days used between 30 days prior to admission to intensive outpatient treatment and baseline assessment
Proportion of Hard Choices: Proportion of hard choices for total EEfRT task, and for trials with low (12%) probability of reward, medium (50%) probability of reward, and high (88%) probability of reward
Table 3. Correlation of proportion of days used at baseline and total percent of EEfRT hard choices with participant self-report measures and EEfRT Reward Betas (N=86)
Substance
Use Days Hard Choices
Total Low Medium High Age -0.120 -0.280** -0.305** -0.260* -0.232*
Years of Education 0.047 0.003 0.026 0.030 -0.046
Days since last use at baseline -0.337** 0.052 0.078 0.066 0.004 Proportion of days used prior to baseline 1.000** -0.070 -0.042 -0.060 -0.093
CMR Total Score 0.035 -0.046 0.015 -0.033 -0.105
Reward Sensitivity Betas
Total Hard Choices -0.043 0.236* 0.197 0.170 -0.301**
Hard Choices for High Probability of Reward 0.020 -0.062 -0.063 -0.086 -0.026 Hard Choices for Medium Probability of Reward 0.153 0.202 0.195 0.183 0.191 Hard Choices for Low Probability of Reward 0.106 0.242* 0.275* 0.171 0.249* CMR: Circumstances, Motivation, & Readiness
Table 4. Relationship between EEfRT hard choices (total, high probability, medium probability, and low probability) and proportion of substance use days at 3-month follow-up (N=85)
ΔR2 ΔF P value of
ΔF B (SE) 95% CI Step 1 (all models). 0.034 2.942 0.090
Days Since Last Use 0.000 (0.000) (-0.001-0.000) Total Hard Choices: R2= 0.035, F(2,83)=1.511, p=0.227
Step 2. 0.001 0.111 0.740
Days Since Last Use 0.000 (0.000) (-0.001-0.000) Total Hard Choices 0.033 (0.099) (-0.164-0.230) Hard Choices for high probability of reward: R2= 0.034, F(2,83)=1.474, p=0.235
Step 2. 0.000 0.040 0.842
Days Since Last Use 0.000 (0.000) (-0.001-0.000)
Hard choices for high probability 0.019 (0.097) (-0.173-0.211)
Hard Choices for medium probability of reward: R2= 0.034, F(2,83)=1.454, p=0.240
Step 2. 0.000 0.001 0.980
Days Since Last Use 0.000 (0.000) (-0.001-0.000)
Hard choices for medium probability -0.002(0.090) (-0.182-0.178)
Hard Choices for low probability of reward: R2= 0.042, F(2,83)=1.837, p=0.166
Step 2. 0.009 0.740 0.392
Days Since Last Use 0.000 (0.000) (-0.001-0.000)
Hard choices for low probability 0.080 (0.093) (-0.105-0.266)
Table 5. Relationship between Baseline total hard choices during EEfRT and substance use predicting EEfRT total hard choices at 3-month follow-up (N=78)
R2=0.516, F(8,70)=9.322, p<0.001 ΔR2 ΔF value P
of ΔF B (SE) 95% CI
Step 1. 0.149 2.553 0.035
Age -0.001 (0.003) (-0.008-0.655)
ASPD 0.077 (0.065) (-0.052-0.205)
Stimulant UD -0.032 (0.083) (-0.197-0.133) Hallucinogen UD 0.089 (0.125) (-0.161-0.339) Reward Sensitivity Beta* 0.117 (0.045) (0.027-0.207)
Step 2. 0.364 26.545 0.000
Age 0.001 (0.003) (-0.004-0.007)
ASPD 0.030 (0.050) (-0.070-0.130)
Stimulant UD -0.074 (0.064) (-0.202-0.054) Hallucinogen UD 0.085 (0.096) (-0.107-0.276) Reward Sensitivity Beta 0.068 (0.036) (-0.003-0.139) Percent of Days Used 0.081 (0.119) (-0.156-0.317) Total Hard Choices at baseline** 0.733 (0.101) (0.533-0.934)
Step 3. 0.003 0.411 0.523
Age 0.001 (0.003) (-0.004-0.007)
ASPD 0.032 (0.050) (-0.069-0.132)
Table 6. Relationship between Baseline hard choices for high probability of reward during EEfRT and substance use predicting EEfRT hard choices for high probability of reward at 3-month follow-up (N=81)
R2=0.517, F(7,74)=11.307, p<0.001 ΔR2 ΔF value P
of ΔF B (SE) 95% CI
Step 1. 0.099 2.120 0.086
Age -0.003 (0.003) (-0.009-0.003)
PTSD 0.125 (0.118) (-0.110-0.361)
Alcohol UD -0.079 (0.071) (-0.220-0.061) Hallucinogen UD 0.160 (0.120) (-0.078-0.398)
Step 2. 0.416 32.130 0.000
Age -0.001 (0.002) (-0.006-0.003)
PTSD -0.015 (0.090) (-0.195-0.165)
Alcohol UD 0.010 (0.054) (-0.098-0.117) Hallucinogen UD 0.045 (0.090) (-0.135-0.224) Percent of Days Used -0.024 (0.107) (-0.238-0.189) Total high probability hard choices at baseline** 0.784 (0.099) (0.586-0.981)
Step 3. 0.002 0.298 0.587
Age -0.002 (0.002) (-0.006-0.003)
PTSD 0.003 (0.096) (-0.189-0.195)
Table 7. Relationship between Baseline hard choices for medium probability of reward during EEfRT and substance use predicting EEfRT hard choices for medium probability of reward at 3-month follow-up (N=81)
R2=0.410, F(5,76)=10.560, p<0.001 ΔR2 ΔF value P
of ΔF
B (SE) 95% CI
Step 1. 0.082 3.522 0.034
Age -0.005 (0.003) (-0.011-0.001)
ASPD 0.132 (0.069) (-0.006-0.271)
Step 2. 0.326 21.217 0.000
Age -0.001 (0.003) (-0.007-0.004)
ASPD 0.047 (0.058) (-0.068-0.162)
Percent of Days Used -0.004 (0.123) (-0.249-0.240) Total medium probability hard choices at baseline** 0.660 (0.102) (0.457-0.863)
Step 3. 0.002 0.240 0.626
Age -0.002 (0.003) (-0.007-0.004)
ASPD 0.049 (0.058) (-0.067-0.166)
Table 8. Relationship between Baseline hard choices for low probability of reward during EEfRT and substance use predicting EEfRT hard choices for low probability of reward at 3-month follow-up (N=78)
R2=0.431, F(9.69)=5.816, p<0.001 ΔR2 ΔF value P
of ΔF B (SE) 95% CI
Step 1. 0.107 1.443 0.210
Age -0.001 (0.004) (-0.009-0.006)
Alcohol UD -0.084 (0.076) (-0.236-0.068) Stimulant UD -0.052 (0.087) (-0.227-0.122) Opiate UD -0.066 (0.083) (-0.231-0.100) Hallucinogen UD* 0.288 (0.125) (0.039-0.538) Reward Sensitivity Beta 0.030 (0.022) (-0.014-0.075)
Step 2. 0.324 19.946 0.000
Age 0.001 (0.003) (-0.005-0.007)
Alcohol UD 0.006 (0.063) (-0.120-0.132) Stimulant UD -0.108 (0.072) (-0.251-0.035) Opiate UD -0.032 (0.068) (-0.167-0.103) Hallucinogen UD 0.177 (0.103) (-0.028-0.382) Reward Sensitivity Beta 0.000 (0.019) (-0.037-0.037) Percent of Days Used -0.029 (0.131) (-0.290-0.232) Total low probability hard choices at baseline** 0.695 (0.110) (0.475-0.915)
Step 3. 0.000 0.000 0.987
Age 0.001 (0.003) (-0.005-0.007)
References
Adinoff, B. (2004). Neurobiologic Processes in Drug Reward and Addiction. Harv Rev Psychiatry, 12(6), 305–320. https://doi.org/10.1080/10673220490910844
Brooks, S. J., Wiemerslage, L., Burch, K., Maiorana, S., Cocolas, E., Schiöth, H., … Stein, D. (2017). The impact of cognitive training in substance use disorder: the effect of working memory training on impulse control in methamphetamine users. Psychopharmacology, 234(12), 1911–1921. https://doi.org/10.1007/s00213-017-4597-6
Brown, R. A., Lejuez, C. W., Kahler, C. W., Strong, D. R., & Zvolensky, M. J. (2005). Distress tolerance and early smoking lapse, 25(6), 713–733.
Bryant, J., Winer, E. S., Salem, T., & Nadorff, M. R. (2017). Struggling toward reward: Recent experience of anhedonia interacts with motivation to predict reward pursuit in the face of a stressful manipulation. PLoS ONE, 12(3), 1–16.
https://doi.org/10.1371/journal.pone.0173439
Chartier, K., & Caetano, R. (2010). Ethnicity and health disparities in alcohol research. Alcohol Research & Health : The Journal of the National Institute on Alcohol Abuse and
Alcoholism, 33(1–2), 152–160. Retrieved from
http://www.ncbi.nlm.nih.gov/pubmed/21209793%0Ahttp://www.pubmedcentral.nih.gov/art iclerender.fcgi?artid=PMC3887493
Daughters, S. B., Lejuez, C. W., Kahler, C. W., Strong, D. R., & Brown, R. A. (2005). Psychological distress tolerance and duration of most recent abstinence attempt among residential treatment-seeking substance abusers. Psychology of Addictive Behaviors, 19(2), 208–211. https://doi.org/10.1037/0893-164X.19.2.208
readiness, and suitability (The CMRS Scales): Predicting retention in therapeutic
community treatment. The American Journal of Drug and Alcohol Abuse, 20(4), 495–515. Duarte, N., Woods, S., & Rooney, A. (2012). Working memory deficits affect risky
decision-making in methamphetamine users with attention-deficit/hyperactivity disorder. J Psychiatr Res, 46(4), 492–499.
García-García, I., Horstmann, A., Jurado, M. A., Garolera, M., Chaudhry, S. J., Margulies, D. S., … Neumann, J. (2014). Reward processing in obesity, substance addiction and
non-substance addiction. Obesity Reviews, 15(11), 853–869. https://doi.org/10.1111/obr.12221 Garfield, J. B. B., Lubman, D. I., & Yücel, M. (2014). Anhedonia in substance use disorders: A systematic review of its nature, course and clinical correlates. Australian and New Zealand Journal of Psychiatry, 48(1), 36–51. https://doi.org/10.1177/0004867413508455
Goldstein, R. B., Bigelow, C., McCusker, J., Lewis, B. F., Mundt, K. A., & Powers, S. I. (2001). Antisocial behavioral syndromes and return to drug use following residential relapse
prevention/health education treatment. American Journal of Drug and Alcohol Abuse, 27(3), 453–482. https://doi.org/10.1081/ADA-100104512
Gorka, S. M., Ali, B., & Daughters, S. B. (2012). The role of distress tolerance in the relationship between depressive symptoms and problematic alcohol use. Psychology of Addictive
Behaviors, 26(3), 621–626. https://doi.org/10.1037/a0026386
Gowin, J. L., Ball, T. M., Wittmann, M., Tapert, S. F., & Paulus, M. P. (2015). Individualized relapse prediction: Personality measures and striatal and insular activity during reward-processing robustly predict relapse. Drug and Alcohol Dependence, 152, 93–101. https://doi.org/10.1016/j.drugalcdep.2015.04.018
K. (2006). Prevalence and Co-Occurrence of Substance Use Disorders and Independent Mood and Anxiety Disorders Results from the NESARC. Alcohol Research & Health, 29(2), 107–120.
Greenfield, B. L., Roos, C., Hagler, K. J., Stein, E., Bowen, S., & Witkiewitz, K. A. (2018). Race/ethnicity and racial group composition moderate the effectiveness of mindfulness-based relapse prevention for substance use disorder. Addictive Behaviors, 81(October 2017), 96–103. https://doi.org/10.1016/j.addbeh.2018.02.010
Harrison, P. A., & Asche, S. E. (1999). Comparison of substance abuse treatment outcomes for inpatients and outpatients. Journal of Substance Abuse Treatment, 17(3), 207–220.
https://doi.org/10.1016/S0740-5472(99)00004-5
Heil, S. H., Johnson, M. W., Higgins, S. T., & Bickel, W. K. (2006). Delay discounting in currently using and currently abstinent cocaine-dependent outpatients and non-drug-using matched controls. Addictive Behaviors, 31(7), 1290–1294.
https://doi.org/10.1016/j.addbeh.2005.09.005
Hershenberg, R., Satterthwaite, T. D., Daldal, A., Katchmar, N., Moore, T. M., Kable, J. W., & Wolf, D. H. (2016). Diminished effort on a progressive ratio task in both unipolar and bipolar depression. Journal of Affective Disorders, 196, 97–100.
https://doi.org/10.1016/j.jad.2016.02.003
Hjorthøj, C. R., Hjorthøj, A. R., & Nordentoft, M. (2012). Validity of Timeline Follow-Back for self-reported use of cannabis and other illicit substances — Systematic review and meta-analysis. Addictive Behaviors, 37(3), 225–233.
https://doi.org/10.1016/J.ADDBEH.2011.11.025
Green, M. F. (2015). Effort-based decision-making paradigms for clinical trials in schizophrenia: Part 2 - External validity and correlates. Schizophrenia Bulletin, 41(5), 1055–1065. https://doi.org/10.1093/schbul/sbv090
Jastak, S., & Wilkinson, G. (1984). Wide Range Achievement Test-Revised (WRAT-R). The Psychological Corporation.
Kaiser, A. J., Milich, R., Lynam, D. R., & Charnigo, R. J. (2012). Negative Urgency, Distress Tolerance, and substance abuse among college students. Addictive Behaviors, 37(10), 1075– 1083. https://doi.org/10.1016/j.addbeh.2012.04.017
Keedwell, P. A., Andrew, C., Williams, S. C. R., Brammer, M. J., & Phillips, M. L. (2005). The Neural Correlates of Anhedonia in Major Depressive Disorder. Biological Psychiatry, 58(11), 843–853. https://doi.org/10.1016/j.biopsych.2005.05.019
Kelley, A. E., & Berridge, K. C. (2002). The Neuroscience of Natural Rewards: Relevance to Addictive Drugs. The Journal of Neuroscience, 22(9), 3306–3311.
https://doi.org/10.2478/raon-2014-0021
Kennerley, S. W., & Walton, M. E. (2011). Decision making and reward in frontal cortex: Complementary evidence from neurophysiological and neuropsychological studies. Behavioral Neuroscience, 125(3), 297–317. https://doi.org/10.1037/a0023575
Khurana, A., Romber, D., Betancourt, L., & Hurt, H. (2017). Working Memory Ability and Early Drug Use Progression as Predictors of Adolescent Substance Use Disorders. Addiction, 112(7), 1220–1228. https://doi.org/10.1007/s11065-015-9294-9.Functional Kirby, K. N., & Petry, N. M. (2003). Heroin addicts have higher discount rates for delayed
Koob, G. F., & Le Moal, M. (2001). Drug addiction, dysregulation of reward, and allostasis. Neuropsychopharmacology, 24(2), 97–129. https://doi.org/10.1016/S0893-133X(00)00195-0
Langås, A. M., Malt, U. F., & Opjordsmoen, S. (2011). Comorbid mental disorders in substance users from a single catchment area - a clinical study. BMC Psychiatry, 11(1), 25.
https://doi.org/10.1186/1471-244X-11-25
Lawn, W., Freeman, T. P., Pope, R. A., Joye, A., Harvey, L., Hindocha, C., … Curran, H. V. (2016). Acute and chronic effects of cannabinoids on effort-related decision-making and reward learning: an evaluation of the cannabis ‘amotivational’ hypotheses.
Psychopharmacology, 233(19–20), 3537–3552. https://doi.org/10.1007/s00213-016-4383-x Lipari, R. N., & Van Horn, S. L. (2017). Trends in Substance Use Disorders Among Adults
Aged 18 or Older. SAMHSA: The CBHSQ Report, 1–8.
MacKillop, J., & Kahler, C. W. (2009). Delayed reward discounting predicts treatment response for heavy drinkers receiving smoking cessation treatment. Drug and Alcohol Dependence, 104(3), 197–203. https://doi.org/10.1016/j.drugalcdep.2009.04.020
Magura, S., Rosenblum, A., & Betzler, T. (2009). Substance use and mental health outcomes for comorbid patients in psychiatric day treatment. Substance Abuse: Research and Treatment, 3(1), 71–78.
Mata, F., Treadway, M., Kwok, A., Truby, H., Yücel, M., Stout, J. C., & Verdejo-Garcia, A. (2017). Reduced Willingness to Expend Effort for Reward in Obesity: Link to Adherence to a 3-Month Weight Loss Intervention. Obesity, 25(10), 1676–1681.
https://doi.org/10.1002/oby.21948
Effort? Novel Insights into Obesity-Associated Alterations in Cost-Benefit Decision-Making. Frontiers in Behavioral Neuroscience, 9(January), 1–13.
https://doi.org/10.3389/fnbeh.2015.00360
McCarthy, J. M., Treadway, M. T., Bennett, M. E., & Blanchard, J. J. (2016). Inefficient effort allocation and negative symptoms in individuals with schizophrenia. Schizophrenia Research, 170(2–3), 278–284. https://doi.org/10.1016/j.schres.2015.12.017
Paulus, M. P., Rogalsky, C., Simmons, A., Feinstein, J. S., & Stein, M. B. (2003). Increased activation in the right insula during risk-taking decision making is related to harm
avoidance and neuroticism. NeuroImage, 19(4), 1439–1448. https://doi.org/10.1016/S1053-8119(03)00251-9
Reddy, L. F., Horan, W. P., Barch, D. M., Buchanan, R. W., Dunayevich, E., Gold, J. M., … Green, M. F. (2015). Effort-Based Decision-Making Paradigms for Clinical Trials in Schizophrenia: Part 1—Psychometric Characteristics of 5 Paradigms. Schizophrenia Bulletin, 41(5), 1045–1054. https://doi.org/10.1093/schbul/sbv089
Rubenis, A. J., Fitzpatrick, R. E., Lubman, D. I., & Verdejo-Garcia, A. (2018). Sustained attention but not effort-based decision-making predicts treatment motivation change in people with methamphetamine dependence. Journal of Substance Abuse Treatment, 95(September), 48–54. https://doi.org/10.1016/j.jsat.2018.09.007
Sargeant, M. N., Bornovalova, M. A., Trotman, A. J. M., Fishman, S., & Lejuez, C. W. (2012). Facets of impulsivity in the relationship between antisocial personality and abstinence. Addictive Behaviors, 37(3), 293–298. https://doi.org/10.1016/j.addbeh.2011.11.012 Schellekens, A. F. A., de Jong, C. A. J., Buitelaar, J. K., & Verkes, R. J. (2015). Co-morbid
Psychiatry, 30(1), 128–136. https://doi.org/10.1016/j.eurpsy.2013.08.006
Schlaepfer, T. E., Lancaster, E., Heidbreder, R., Strain, E. C., Kosel, M., Fisch, H. U., &
Pearlson, G. D. (2006). Decreased frontal white-matter volume in chronic substance abuse. International Journal of Neuropsychopharmacology, 9(2), 147–153.
https://doi.org/10.1017/S1461145705005705
Sheehan, D. V., Lecrubier, Y., Sheehan, K. H., Janavs, J., Weiller, E., Keskiner, A., … Dunbar, G. C. (1997). The validity of the Mini International Neuropsychiatric Interview (MINI) according to the SCID-P and its reliability. European Psychiatry, 12(5), 232–241. https://doi.org/10.1016/S0924-9338(97)83297-X
Sobell, L. C., & Sobell, M. B. (1992). Timeline Follow-Back. In R. Z. Litten & J. P. Allen (Eds.), Measuring Alcohol Consumption: Psychosocial and Biochemical Methods (pp. 41– 72). Totowa, NJ: Humana Press. https://doi.org/10.1007/978-1-4612-0357-5_3
Soyka, M., & Schmidt, P. (2009). Outpatient alcoholism treatment--24-month outcome and predictors of outcome. Substance Abuse Treatment, Prevention, and Policy, 4, 15. https://doi.org/10.1186/1747-597X-4-15
Suter, M., Strik, W., & Moggi, F. (2011). Depressive symptoms as a predictor of alcohol relapse after residential treatment programs for alcohol use disorder. Journal of Substance Abuse Treatment, 41(3), 225–232. https://doi.org/10.1016/j.jsat.2011.03.005
Treadway, M. T., Buckholtz, J. W., Schwartzman, A. N., Lambert, W. E., & Zald, D. H. (2009). Worth the “EEfRT”? The effort expenditure for rewards task as an objective measure of motivation and anhedonia. PLoS ONE, 4(8), 1–10.
https://doi.org/10.1371/journal.pone.0006598
patients with schizophrenia. Schizophrenia Research, 161(2–3), 382–385. https://doi.org/10.1016/j.schres.2014.11.024
U.S. Department of Health and Human Services. (2016). Facing Addiction in America: The Surgeon’s General Report on Alcohol, Drugs, and Health.
https://doi.org/https://www.ncbi.nlm.nih.gov/books/NBK424857/pdf/Bookshelf_NBK4248 57.pd
U.S. National Institute on Drug Abuse. (2017). Trends & Statistics, 1–6.
Verdejo-García, A., Bechara, A., Recknor, E. C., & Pérez-García, M. (2007). Negative emotion-driven impulsivity predicts substance dependence problems. Drug and Alcohol
Dependence, 91(2–3), 213–219. https://doi.org/10.1016/j.drugalcdep.2007.05.025
Verdejo-Garcia, A., Chong, T. T. J., Stout, J. C., Yücel, M., & London, E. D. (2018). Stages of dysfunctional decision-making in addiction. Pharmacology Biochemistry and Behavior, 164, 99–105. https://doi.org/10.1016/j.pbb.2017.02.003
Volkow, N. D., Wang, G. J., Fowler, J. S., Tomasi, D., Telang, F., & Baler, R. (2010).
Addiction: Decreased reward sensitivity and increased expectation sensitivity conspire to overwhelm the brain’s control circuit. BioEssays, 32(9), 748–755.
https://doi.org/10.1002/bies.201000042
Voon, V., Morris, L. S., Irvine, M. A., Ruck, C., Worbe, Y., Derbyshire, K., … Grant, J. E. (2015). Risk-taking in disorders of natural and drug rewards: Neural correlates and effects of probability, valence, and magnitude. Neuropsychopharmacology, 40(4), 804–812. https://doi.org/10.1038/npp.2014.242
https://doi.org/10.1016/j.cpr.2005.11.003
Wang, X., Li, B., Zhou, X., Liao, Y., Tang, J., Liu, T., … Hao, W. (2012). Changes in brain gray matter in abstinent heroin addicts. Drug and Alcohol Dependence, 126(3), 304–308.
https://doi.org/10.1016/J.DRUGALCDEP.2012.05.030
Wilson, J. L., Bandyopadhyay, S., Yang, H., Cerulli, C., & Morse, D. S. (2018). Identifying Predictors of Substance Use and Recidivism Outcome Trajectories Among Drug Treatment Court Clients. Criminal Justice and Behavior, 45(4), 447–467.
https://doi.org/10.1177/0093854817737806