ASSESSING TARGETED GENOMIC EXPRESSION FOLLOWING IN VITRO EXPOSURES OF HUMAN LUNG CELLS TO AMBIENT GASES IN HOUSTON, TEXAS
Hang Nguyen
A thesis submitted to the faculty at the University of North Carolina at Chapel Hill in partial fulfillment of the requirements for the degree of Master of Science in the Department of Environmental Sciences and Engineering in the Gillings School of Global Public Health.
Chapel Hill 2018
Approved by:
William Vizuete
Rebecca Fry
ii
iii ABSTRACT
Hang Nguyen: Assessing targeted genomic expression following In Vitro exposures of human
lung cells to ambient gases in Houston, Texas (Under the direction of William Vizuete)
Current in vitro studies do not typically assess the cellular impacts in relation to ambient
atmospheric mixtures of gases that are constantly undergoing chemical transformations. In the
present study, we set out to examine the biological (i.e. mRNA) responses of human lung cells
upon exposure to air toxics by comparing the expression in response to controlled ozone, clean air,
and mixtures of gases found in the ambient air. These ambient exposures are the first testing of a
field-deployed lung cell experiment. Examining mRNA levels, we identified changes in genes that
play a role as inflammatory responders in the cell. These results highlight that cells exposed to
clean air had minimal transcriptional change, while as anticipated, cells exposed to the ambient
conditions displayed changes in 11 genes. The potential to produce field gas-phase toxicity data
would enable environmental pollution researchers to begin to reduce uncertainties in gas exposure
iv
ACKNOWLEDGEMENTS
Foremost, I would like to express my sincere gratitude to my advisor Dr. William Vizuete
for the continuous support of my study and research.
Besides my advisor, I would like to thank the rest of my thesis committee: Dr. Rebecca Fry,
and Dr. Kenneth G. Sexton, for their encouragement, and insightful comments.
My sincere thanks also go to the Vietnam Education Foundation and the Department of
Environmental Sciences and Engineering for offering me the fellowships to cover my study here.
I am also thankful to The Benzene and other Toxics Exposure (BEE‐TEX) Study and collaborators
from Houston Advanced Research Center (HARC), University of Houston, Baylor College of
Medicine for giving me a chance to conduct research in Houston Ship Channel, Texas.
I thank my fellow lab mates, Jose Zavala, Wang Chitsan, Ma Mutian and Azin Eftekhari, for
their support and encouragement. In particular, I am grateful to my friend, Kathy Cruz, for
enlightening me throughout the difficulties of the research.
Last but not the least, I would like to thank my family, my parents for giving birth to me in
v
TABLE OF CONTENTS
LIST OF TABLES………..………....vi
LIST OF FIGURES………vii
LIST OF ABBREVIATIONS………..……....viii
CHAPTER 1: INTRODUCTION………..………..1
CHAPTER 2: METHOD………...4
1. Study site…...………..…………...………...……….4
2. Exposure Condition……….……..………...………..6
3. Supernatant analysis………...……....8
4. RNA extraction………...………9
5. NanoString Gene Expression Assays ………...………9
6. NanoString Normalization and Analysis...………..………...………..10
CHAPTER 3: RESULTS……..……….11
1. Cytotoxicity………...……….……..….14
2. Genomic Expression Response…………...………...…………...15
CHAPTER 4: DISCUSSION………...………..…19
vi
LIST OF TABLES
Table 1. Ambient measurements from CAMs monitors and the University of Houston PTR-MS (UH) of selected pollutants that were exposed to the biology. For all data, the average, median, min, max values were calculated using hourly
average data from 12-4 pm on February 8, 24, and 26…..…....………...………...13
Table 2. Meteorological measurements for exposed biology………14
vii
LIST OF FIGURES
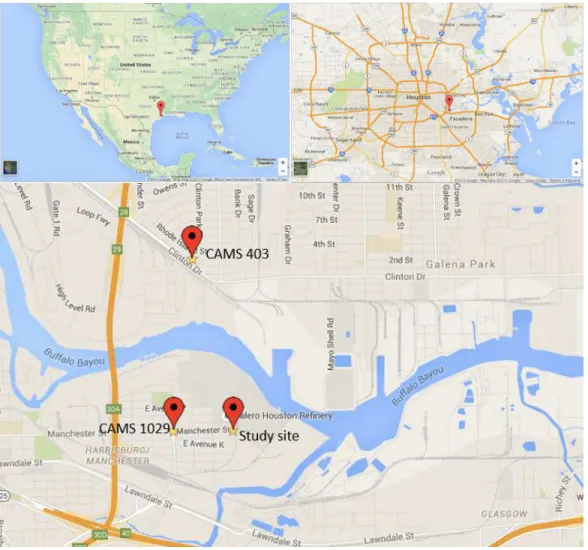
Figure 1. Location of study site for cell exposures, CAMs 1029 and CAMs 304………5
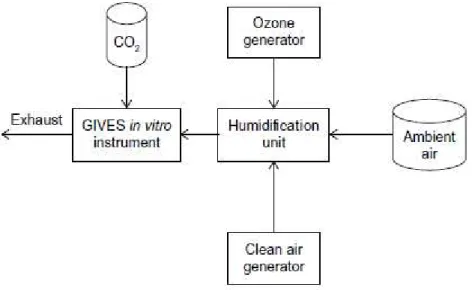
Figure 2. Schematic of the sample airflow from sources (clean air, ozone, and ambient air) through the humidification unit and into the GIVES exposure
instrument housing the lung cells……….…….………..…...6
Figure 3. LDH data from the supernatant analysis……….……….15
Figure 4. Heat map displaying the 11 differentially expressed genes
viii
LIST OF ABBREVIATIONS
ALOX5 Arachidonate 5-Lipoxygenase
BEE-TEX Benzene and other toxics exposure
C2 Complement Component 2
CAMS Continuous ambient monitoring station
CCL11 Chemokine (C-C Motif) Ligand 11
CCL24 Chemokine (C-C Motif) Ligand 24
DEFA1 Defensin, Alpha 1
EPA Environmental Protection Agency
FDR False discovery rate
FGFR3 Fibroblast Growth Factor Receptor 3
GIVES Gas Phase In Vitro Exposure System
HAPs Hazardous air pollutants
HARC Houston Advanced Research Center
IFIT3 Interferon-induced protein with tetratricopeptide repeats 3
IL8 Interleukin 8
IL11 Interleukin 11
IL12B Interleukin 12B
LDH Lactate dehydrogenase
MX2 MX Dynamin-Like GTPase 2
PTGIR Prostaglandin I2 (Prostacyclin) Receptor
PTRMS Proton-transfer-reaction mass spectrometer
ix
UH University of Houston
1
CHAPTER 1: INTRODUCTION
In the ambient environment, the public can be exposed to a wide number of different gaseous
air pollutants. These ambient exposures may include hazardous air pollutants (HAPs) such as
benzene and 1, 3 butadiene, which are known carcinogens and are emitted by human activity
directly into the atmosphere [1]. Other harmful pollutants, such as ozone, are not emitted but rather
formed via chemical reactions that occur in the atmosphere. The resulting public exposure in the
ambient environment is a constantly changing mixture of primary and secondary gas-phase
pollutants that are influenced by both chemical transformations and physical processes. The
dynamic nature of this exposure environment makes it a challenge to simulate in a laboratory
setting and thus has limited our ability in risk assessment to a real-world mixture. The assessment
of toxicity for many gas-phase pollutants, such as those found on the U.S. Environmental
Protection Agency (EPA) Hazardous Air Pollutant (HAP) list, is based on evidence provided by
exposures to a single pollutant [1]. Experiments to single pollutants are unable to assess any
synergistic impact that may occur from the simultaneous exposure of multiple pollutants. Further,
atmospheric chemistry produces a diverse number of different gas-phase species, many of which
are not even measured but could be a contributor to the overall toxicity of an ambient exposure.
The enormity of a number of species in the atmosphere and its dynamic nature require a systematic
approach to identify what gas-phase species in an ambient exposure are the most critical to public
2
There has been limited exposure data generated that has quantified the risk due to exposures
to mixtures of gas-phase pollutants [2,3]. In one study, the influence of atmospheric chemistry on
emitted gas-phase pollutants was quantified using in vitro exposures to epithelial lung cells [4].
These researchers first exposed A549 epithelial lung cells to two primary emitted pollutants of 1,3
butadiene and isoprene, and then exposed their photochemically aged gas-phase products. After
the exposures, biological responses were quantified using IL8 and LDH as biomarkers. When cells
were exposed to major oxidation products there was up to 15-fold increase in LDH levels, and a
2-fold increase in IL8 levels when compared to exposures to just the primary pollutants [5]. Studies
investigating oxidation products have also focused on urban exposures and their photochemical
gas-phase products [6-9]. This work was completed through the in vitro exposures of A549
epithelial lung cells to an urban mixture of volatile organic carbon (VOC) and oxides of nitrogen
(NOx) [9]. This urban mixture was created to represent an average U.S. city and consists of 55
different hydrocarbons [9]. In addition to in vitro exposures to this mixture, these researchers then
photochemically aged these pollutants in an outdoor smog chamber and created secondary
products that were also exposed to A549 cells. After exposure, the RNA was collected and then
extracted and genomic responses were quantified for 28,869 genes using Affymetrix GeneChip®
Human Gene 1.0 ST arrays (Affymetrix Inc., Santa Clara, CA) [9]. Exposure to the
non-photochemically aged pollutants altered 19 genes while exposure to the non-photochemically aged
pollutants altered over 700 genes. These studies show the importance of combined exposures of
gas-phase pollutants and the substantial influence due to photochemistry in the ambient
environment in epithelial lung cells.
In laboratory-based experiments, all exposure environments are a simulation of the real
3
laboratory and also to guide new experiments. A recent field campaign provided an opportunity to
do in vitro exposures to a real atmosphere in the city of Houston, Texas. Houston is the fourth
largest city in the US and features a large refining and petrochemical industry. A recent task force
found that the resulting emissions in Houston put city residents at risk due to exposures to ozone
and nine hazardous air pollutants [3]. To assess the exposure to gas-phase pollutants, the Houston
Advanced Research Center (HARC) funded a field campaign called the Benzene and other Toxics
Exposure (BEE-TEX) [10]. BEE-TEX study aimed at monitoring air quality in three
neighborhoods in Houston Ship Channel, Texas through the use of real-time monitoring equipment
and advanced remote sensing equipment.
The location, campaign infrastructure, and advanced measurements provided by the
BEE-TEX study created an ideal opportunity to deploy an in vitro instrument into the field for real
atmosphere exposures to epithelial lung cells. In February of 2015, A549 cells were exposed in
vitro to positive and negative controls as well as ambient air at the field site on 9700 Manchester
Street (29°43′00.18′′N, 95°15′21.83′′W) [11]. Results from the positive and negative exposures
supported the production of quality assured data. Further, the cells had a significant genomic
expression of 11 genes related to inflammatory, immunity and oxidative stress. This successful in
vitro deployment and the amount of highly temporally resolved chemical characterization data
present a unique opportunity to correlate pollutant exposures to specific gene expressions [9]. This
study provides the first test of a field-deployed lung cell experiment to examine the genomic
4
CHAPTER 2: METHOD
1. Study site
Houston is the largest city in the Southern United State, the most populous city in Texas, and
the fourth most populated metropolitan statistical area in the United States. With an estimation of
2013, the city population is 2.19 million people living in a land area of 599.6 square miles (1,553
km2). Houston is home to more than 3,700 energy-related businesses, the Institute for Energy
Research, Energy Research Park, and Advanced Energy Consortium. Houston is considered as the
Energy Capital of the world. It is the location of 40 of the nation’s 145 publicly traded oil and gas
exploration and production firms, including 11 of the top 25 as ranked by 2011 total assets.
Petrochemical industry produces the more important plastics and resins from raw materials. The
Houston metropolitan area dominates U.S. production of three major resins: polyethylene, with
36.6% of U.S. capacity; polypropylene with 51.7%; and polyvinyl chloride with 41.5% [12]. The
Houston Ship Channel in Houston, Texas is part of the Port of Houston, which ranks first in the
United States in international waterborne tonnage handled, second in total cargo tonnage handled
and the tenth largest port in the world. The Port handled 220 million short tons of domestic and
foreign cargo in 2010. The channel is the host for big vessels between Houston-area and the Gulf
5
Figure 1: Location of study site for cell exposures, CAMs 1029 and CAMs 304
The study site is located at 9700 Manchester Street in downtown Houston, Texas, USA
(29o43’00.18’’N, 95o15’21.83’’W). To the North and Northeast, Valero Houston refinery is across
Manchester Street, as shown in Figure 1. 450 meters to the Northeast of the site is the watercourse
of Buffalo Bayou Channel. To the Southeast, it is around 545 meters far from Sims Bayou Channel.
Approximately 1.2 kilometers to the East is the E loop Freeway and 884 meters to the Southwest
of the site is Lawndale Street. Around 622 meters far from the site, there are railways connecting
industries in the area. Close to a residential area, it is believed that the pollution from industries
6
largest medical center in the world where hosts several cancer patients from different parts of US.
Next to the trailer at the site, a mobile station was operated by University of Houston (UH). This
mobile station included a PTRMS to provide real-time monitoring data of selected VOCs as shown
in Table 1. Close to the site, locations of two Continuous Ambient Monitoring Station, CAMs
1029 and CAMs 304, were shown in Figure 1 as ambient data were also collected from these two
stations operated by Texas Commission on Environmental Quality (TCEQ).
2. Exposure description
The exposure system was installed inside a secure temperature controlled portable field
laboratory building. The setup of this exposure system is shown in Figure 2. At least 4 hours before
exposure, the exposure chamber was cleaned with ethanol and the complete system powered
including the heated incubator, humidifier, and the peristaltic water (Fisher HPLC grade) pump.
This protocol allows the humidifier to be wetted and stabilize at a temperature of 37oC, Relative
Humidity of 60- 90%, and 5% CO2.
7
The epithelial lung cell A549 was used in the field deployment because of its commercial
availability, robustness and worldwide reproducibility with consistent results. A549 cells from
UNC lab were frozen and transported to the cell culture lab in Baylor Medicine College, Houston,
Texas. As they arrived, cells were thawed and moved to a T75 flask with 20 ml of 37oC culture
media (F-12K, fetal bovine serum (FBS), Penicillin/Streptomycin). The cells were cultured using
air-liquid interface system in which the basolateral surfaces of cells were cultured by media and
the apical surfaces of cells without media were contacted directly with air pollutants. Until
confluence (80%), cells were split to a new T75 flask of 1,800K of cell/ml and placed to each well
800ml of 850k cells/ml to 9-12 wells plate (Corning) overnight prepared for the next day morning
exposure.
To expose cells, the culture media was replaced with starving media (F-12K, BSA,
Penicillin/Streptomycin) for four hours. Prior to exposure, the starving media was removed and
new starving media added. Plated cells were then placed in an insulated blackout box and
transported to the field site. During transport, a level was maintained using a “bubble” balance.
Once placed in the instrument the cells were maintained in an environment of 5% CO2 and 37oC
and 56-90% relative humidity. The first experiments in the field were three exposures to clean air
(negative control) and two exposures to 400 ppb Ozone (positive control). In addition, cells were
placed in an incubator as a control. For these field experiments, flowrates of 1L/min were checked
using a Gilibrator flow meter before connecting to a medical clean air source or an ozone generator.
The ozone generator was sampled with a calibrated ozone meter (Monitor Labs 9811). After
exposures, the cells were covered and place in the insulated blackout box and transported
immediately back to the Baylor Medical School laboratory where a UNC team member received
8
For the ambient exposures, the in vitro exposure instrument sample inlet was connected to a
Teflon (FEP, ¼ inch O.D) sample tube mounted on a 7 feet long mast on top of the field laboratory.
The end of the ambient sample line at the top of the mast was protected with a funnel to prevent
rain droplets and insects from touching the tube inlet. All ambient exposures started at
approximately 12 PM and lasted 4 hours. We conducted 5 days of ambient air exposure, February
18, 29, 24, 25, and 26 of 2015. After 16 hours, post-exposure cells were collected with RNA in
Trizol and supernatant separately. Then samples were stored in a box with dry ice and transport
by car to UNC lab. Cell exposure samples were frozen at -20oC during the field campaign and then
driven back to UNC on dry ice (-80oC) during a 48-hour driving time.
3. Supernatant Analysis
Upon arriving in UNC lab, cells were frozen at a temperature of -80oC. Then supernatant
from samples was thawed and measured for the cytotoxicity. For the cytotoxicity, supernatant
samples were dyed and analyzed for the enzyme lactase dehydrogenase (LDH) using Pierce™
LDH Cytotoxicity Assay Kit (Life Technologies) [14]. Incubator control and exposed sample wells
were also analyzed for LDH cytotoxicity in triplicate and scanned absorbance reading for 492nm
and 690nm wavelength using Thermo / LabSystems 352 Multiskan MS Microplate Reader.
Applying the Grubb’s test, the reading outliers were indicated as those with less than 5%
probability of occurring relative to a normal distribution [15]. Fold increase of LDH level was
calculated by dividing the mean levels of exposed samples by those of control samples after
subtracting them with BSA blank (starving media). Data for LDH are presented as the mean ±
standard error from the mean and expressed as fold increase over control. Data were analyzed
9
were first exposed to clean air as a negative control. This allowed us to investigate any potential
problems with cell culture media evaporation that could lead to cell desiccation or to contamination
of any type including carry-over from previous exposures. No statistical difference in LDH levels
between incubator controls and clean air exposures were observed.
4. RNA extraction
Following a revised Qiagen miRNeasy protocol, total RNA was extracted from exposed and
control samples. In short, samples stored in Trizol were thawed at room temperature (25oC) and
were homogenized using a QIAshredder. Then the homogenized cell constituents were incubated
at 25oC for 5 minutes. After 5 minutes, 200μl chloroform was added to the mixture, incubated at
25oC for 3 minutes, then centrifuged for 15 minutes with the rate of 12,000 x g at 4°C. The aqueous
phase of the mixture was transferred to a new tube containing 750 μl of biological grade ethanol
and mixed thoroughly. This new mixture was then spun using a Qiagen miRNeasy spin column
and the end of extraction were followed the manufacturer’s instructions.
5. NanoString Gene Expression Assays
From each extracted sample, 50ng of RNA was checked for biological qualification and
evaluated for comparative expressions of various gene targets using NanoString’s nCounter
Inflammation and PanCancer Panels of the NanoString technology [16]. The NanoString
technology employed a specific binding of a unique molecular barcode for each targeted mRNA
and a molecular imaging for direct hybridization. Probes for each target included a visible reporter
probe and a biotinylated capture probe, hybridizing to target mRNA overnight at 65°C. After the
10
streptavidin-treated cartridge. The molecules were fixed using an electrical field and the cartridge
was moved to the nCounter instrument where epifluorescence microscopy and a CCD camera were
employed to capture images of target-probe complexes. The molecular images were processed
within the nCounter instrument and counts were tabulated and reported in a .csv format.
6. NanoString Normalization and Analysis
NanoString data were processed separately using two software, SAS (SAS Institute, Cary,
NC) and Partek Genomic Suite (St. Louis, MO). Data were normalized in a two-step process
following the manufacturer’s guide. First, positive control normalization was carried out. Second,
housekeeping gene normalization was performed for each panel. Both normalization processes
provide quality control for batch effect and artifact error. Differential expression was identified as
the condition of a p<0.05, and a fold change >|1.5| was met [9]. False discovery rates (FDR)
11
CHAPTER 3: RESULTS
1. Ambient Measurements
We collected meteorological data and ambient measurements from two Continuous Ambient
Monitoring Station (CAMS) operated by the Texas Commission on Environmental Quality
(TCEQ). The two CAMS sites were CAMS 1029 and CAMS 403. Both sites report hourly average
data [17]. CAMS 1029 was located at 29° 43' 7.00" North and 95° 15' 35.00" West and was 0.4
miles to the west of the study site at 9700 Manchester Street, Houston, Texas. CAMS 1029
recorded pollutant as total non-methane organic compounds and meteorological data as wind
speed, wind direction, maximum wind gust, and outdoor temperature. All data from CAMS 1029
is reported in Table 2. CAMS 403 was situated at 29° 44' 1.00" North and 95° 15' 27.00" West
which was around 1 mile to the North of the study site. CAMS 403 recorded meteorological data
as wind speed, wind direction, maximum wind gust, outdoor temperature, dew point temperature,
relative humidity, solar radiation, ultraviolet radiation barometric pressure, precipitation, some
pollutants as carbon monoxide, sulfur dioxide, nitric oxide, nitrogen dioxide, oxide of nitrogen,
ozone, PM2.5 and GC data as ethane, ethylene, propane, benzene, etc. Concentrations of the
pollutants were presented in Table 1. Dewpoint temperature, relative humidity, solar radiation,
ultraviolet radiation barometric pressure, precipitation from this station were also included in Table
2.
Moreover, we collected VOC data measured by researchers from the University of Houston
12
acetaldehyde, acetone, benzene, toluene, C2 benzenes, C3 benzenes, Styrene, and MEK. The
pollutant concentrations were recorded three to five data points every second. These data were
averaged and reported into hourly values.
As shown in Table 1, the in vitro ambient exposures days showed differentiated composition
when compared to the clean air. The biology was exposed to peaks of hourly ozone concentrations
of 38 ppb and NOx at 29.5 ppb. There were also exposures to a variety of VOCs, most importantly
aromatics where toluene peaked at 4.98 ppb, all benzene at 15 ppb, and xylene at 1.44 ppb. Table
2 provides some meteorological parameters from the exposure period. There was no precipitation
on these days and resultant wind speed suggests calm winds, approximately 3 mph, indicating that
for a 4-hour exposure period, cells were exposed to air pollution sources up to 12 miles away if
13
Table 1. Ambient measurements from CAMs monitors and the University of Houston PTR-MS (UH) of selected pollutants that were exposed to the biology. For all data, the average, median, min, max values were calculated using hourly average data from 12-4 pm on February 8, 24, and 26
Species Average Median Min Max Site
Ozone b 26.67 28.00 12.00 38.00 CAMs
Total Non-Methane Organic
Compounds a 18.69 20.16 8.20 27.03 CAMs
Oxides of Nitrogen b 14.87 16.4 4.2 29.5 CAMs
Ethane a 17.36 17.44 12.52 24.86 CAMs
Propane a 13.65 12.84 10.47 17.61 CAMs
Methanol a 2.35 2.29 1.36 3.66 UH
n-Butane a 8.61 8.76 6.36 10.36 CAMs
Acetone a 5.15 4.95 2.68 7.36 UH
Acetaldehyde a 1.65 1.62 0.94 2.28 UH
Isobutane a 3.29 3.28 2.80 3.92 CAMs
Isopentane a 3.71 3.75 2.75 4.90 CAMs
Ethylene a 1.38 1.16 0.74 2.32 CAMs
n-Pentane a 2.74 2.65 2.30 3.20 CAMs
Acetylene a 1.01 1.06 0.64 1.32 CAMs
Toluene a 2.71 2.87 0.06 4.98 UH
C2_Benzenes a 3.04 3.00 0.59 6.16 UH
Benzene a 2.11 2.16 0.61 3.72 UH
MEK a 1.37 1.16 0.85 2.53 UH
C3_Benzenes a 2.81 2.19 0.36 8.19 UH
Carbon Monoxide c 0.24 0.20 0.20 0.30 CAMs
Sulfur Dioxide b 0.21 0.20 -0.10 0.60 CAMs
Propylene a 0.58 0.63 0.33 0.81 CAMs
n-Hexane a 1.05 1.02 0.84 1.38 CAMs
Acetonitrile a 0.28 0.32 -0.03 0.49 UH
p-Xylene + m-Xylene a 0.82 0.72 0.56 1.44 CAMs
Styrene a 0.43 0.61 -0.71 1.21 UH
14
Table 2. Meteorological measurements for exposed biology
Parameters Average Median Minimum Maximum
Resultant Wind Speed (MPH) 2.99 - - -
Outdoor Temperature (degree F) 50.3 52.8 38.1 61.8
Maximum Wind Gust (MPH) 12.3 13 8.6 16.8
Dew Point Temperature (degree F) 31.4 32.5 27.2 34.3
Relative Humidity (%) 52.6 49.3 27.2 78.4
Precipitation (inches) 0 0 0 0
2. Cytotoxicity
Figure 3 shows the LDH results from the analysis of the supernatant. The LDH assay was
used to quantify the cytotoxicity of the three negative control experiments (clean air exposures)
which were reported as fold change over the incubator control (lung cell housed in the incubator).
All data were then normalized to a maximum cytotoxicity of a 7.5-fold change [18]. As shown in
the figure the clean air exposures did not have a significant increase in LDH over the control. The
ozone exposures show a 3.5-4-fold increase over control. Both the clean air and ozone exposures
replicated responses seen in the laboratory. This is significant as it means that the instrument itself
and the field deployment of the biology did not have an adverse impact on the cells. Thus, the
15 Figure 3. LDH data from the supernatant analysis
3. Genomic Expression Response
To determine whether ozone, ambient exposure and/or clean air alter the mRNA expression
level of inflammation and cancer-related genes, field experiments and laboratory exposures were
carried out in A549 cells. Of the 594 immune-related genes and 730 pan cancer related genes that
were measured, 11 genes showed significant (p<0.05) differential expression in response to one of
the treatments. The detail of expressed genes was shown in Table 3. In the heat map in Figure 4,
red color represents a positive value of gene expression while blue color represents a negative
value of gene expression. The positive value of gene expression represents an upregulated gene
changed due to exposure while the negative value of gene expression represents a downregulated
16
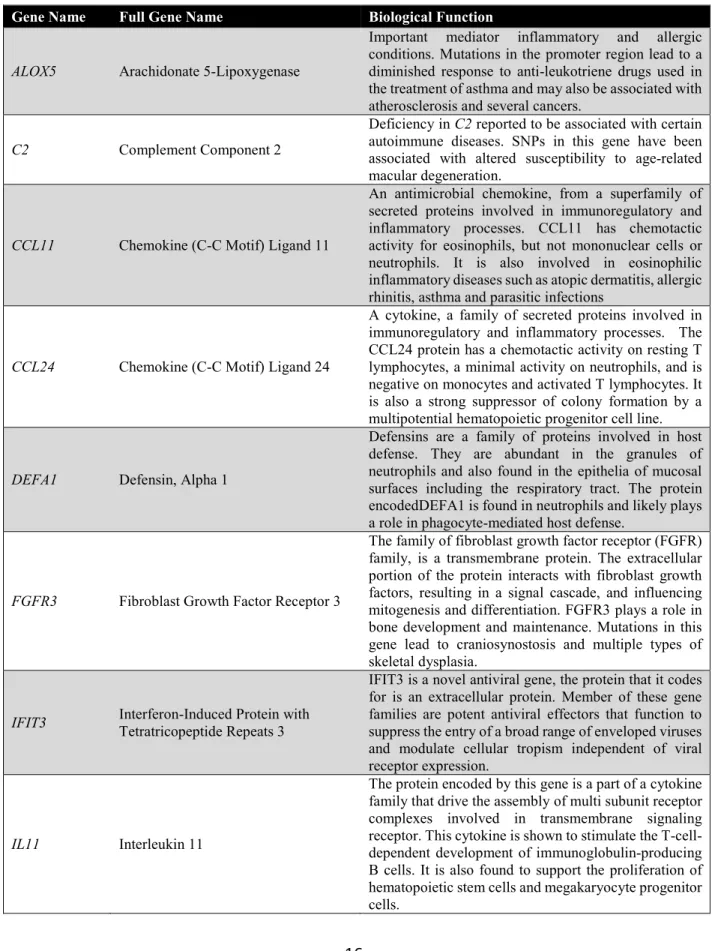
Table 3. Differentially Expressed Genes in response to air-toxics exposures
Gene Name Full Gene Name Biological Function
ALOX5 Arachidonate 5-Lipoxygenase
Important mediator inflammatory and allergic conditions. Mutations in the promoter region lead to a diminished response to anti-leukotriene drugs used in the treatment of asthma and may also be associated with atherosclerosis and several cancers.
C2 Complement Component 2
Deficiency in C2 reported to be associated with certain autoimmune diseases. SNPs in this gene have been associated with altered susceptibility to age-related macular degeneration.
CCL11 Chemokine (C-C Motif) Ligand 11
An antimicrobial chemokine, from a superfamily of secreted proteins involved in immunoregulatory and inflammatory processes. CCL11 has chemotactic activity for eosinophils, but not mononuclear cells or neutrophils. It is also involved in eosinophilic inflammatory diseases such as atopic dermatitis, allergic rhinitis, asthma and parasitic infections
CCL24 Chemokine (C-C Motif) Ligand 24
A cytokine, a family of secreted proteins involved in immunoregulatory and inflammatory processes. The CCL24 protein has a chemotactic activity on resting T lymphocytes, a minimal activity on neutrophils, and is negative on monocytes and activated T lymphocytes. It is also a strong suppressor of colony formation by a multipotential hematopoietic progenitor cell line.
DEFA1 Defensin, Alpha 1
Defensins are a family of proteins involved in host defense. They are abundant in the granules of neutrophils and also found in the epithelia of mucosal surfaces including the respiratory tract. The protein encodedDEFA1 is found in neutrophils and likely plays a role in phagocyte-mediated host defense.
FGFR3 Fibroblast Growth Factor Receptor 3
The family of fibroblast growth factor receptor (FGFR) family, is a transmembrane protein. The extracellular portion of the protein interacts with fibroblast growth factors, resulting in a signal cascade, and influencing mitogenesis and differentiation. FGFR3 plays a role in bone development and maintenance. Mutations in this gene lead to craniosynostosis and multiple types of skeletal dysplasia.
IFIT3 Interferon-Induced Protein with Tetratricopeptide Repeats 3
IFIT3 is a novel antiviral gene, the protein that it codes for is an extracellular protein. Member of these gene families are potent antiviral effectors that function to suppress the entry of a broad range of enveloped viruses and modulate cellular tropism independent of viral receptor expression.
IL11 Interleukin 11
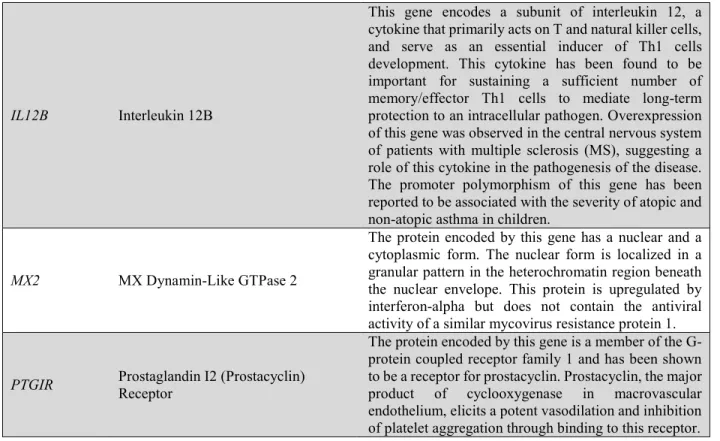
17 IL12B Interleukin 12B
This gene encodes a subunit of interleukin 12, a cytokine that primarily acts on T and natural killer cells, and serve as an essential inducer of Th1 cells development. This cytokine has been found to be important for sustaining a sufficient number of memory/effector Th1 cells to mediate long-term protection to an intracellular pathogen. Overexpression of this gene was observed in the central nervous system of patients with multiple sclerosis (MS), suggesting a role of this cytokine in the pathogenesis of the disease. The promoter polymorphism of this gene has been reported to be associated with the severity of atopic and non-atopic asthma in children.
MX2 MX Dynamin-Like GTPase 2
The protein encoded by this gene has a nuclear and a cytoplasmic form. The nuclear form is localized in a granular pattern in the heterochromatin region beneath the nuclear envelope. This protein is upregulated by interferon-alpha but does not contain the antiviral activity of a similar mycovirus resistance protein 1.
PTGIR Prostaglandin I2 (Prostacyclin) Receptor
The protein encoded by this gene is a member of the G-protein coupled receptor family 1 and has been shown to be a receptor for prostacyclin. Prostacyclin, the major product of cyclooxygenase in macrovascular endothelium, elicits a potent vasodilation and inhibition of platelet aggregation through binding to this receptor.
18
Of the 11 genes that showed significant changes in gene expression, 9 genes were associated
with ambient air exposures, 3 were expressed due to ozone exposures and only 1 was altered
because of clean air exposure. The 9 genes changed in response to ambient air were associated
with immune and inflammatory response: Arachidonate 5-Lipoxygenase (ALOX5), Complement
Component 2 (C2), Chemokine (C-C Motif) Ligand 11(CCL11), Chemokine (C-C Motif) Ligand
24(CCL24), Defensin, Alpha 1(DEFA1), Interferon-induced protein with tetratricopeptide repeats
3(IFIT3), Interleukin 11(IL11), Interleukin 12B(IL12B), MX Dynamin-Like GTPase 2(MX2), and
Prostaglandin I2 (Prostacyclin) Receptor (PTGIR). The final gene, Fibroblast Growth Factor
Receptor 3 (FGFR3), is involved in mitogenesis and differentiation specific to bone development
19
CHAPTER 4: DISCUSSION
The Benzene and other Toxics Exposure (BEE-TEX) campaign was a field deployment
aimed at measuring exposure source attribution of air toxics. The study was conducted in 2015 in
the Houston Ship Channel where intense industrial sources of air toxics are located in close
proximity to residential neighborhoods. During BEE-TEX, we were able to successfully deploy
for the first time in the field our novel in vitro instrument [11]. Using this instrument, we exposed
A549 epithelial lung cells to 5 ambient days. In addition to these days, we also conducted 3 days
of clean air exposure (negative control) and 2 days of 0.4 ppm ozone exposure (positive control).
After all exposures, the supernatant was collected and the total RNA from the biology. This
included the small RNAs ≥18 nucleotides. The supernatant material was used to quantify LDH
proteins. The RNA extracted from A549 cells was evaluated for comparative expression of various
gene targets using NanoString’s nCounter Inflammation and PanCancer Panels.
These biomarkers were first analyzed to ensure the successful deployment of the instrument.
Both the results from the clean air and ozone exposures were consistent with similar exposures
conducted in the laboratory. This is significant as it means that the instrument itself and the field
deployment of the biology did not have an adverse impact on the cells. Thus, the toxicity responses
20
The ambient exposures days showed differentiated composition when compared to the clean
air. The biology was exposed to peaks of hourly ozone concentrations of 38 ppb and NOx at 29.5
ppb. There were also exposures to a variety of VOCs, most importantly aromatics where toluene
peaked at 5 ppb, benzene 15 ppb, and xylene at 1.44 ppb. There was no precipitation on these days
and resultant wind speed suggests calm winds. For the ambient days, the exposed biology mRNA
was used to determine the levels of expression of inflammation and cancer-related genes. Of the
594 immune-related genes and 730 pan cancer-related genes that were measured, 11 genes showed
significant (p<0.05) differential expression in response to one of the treatments. Of the 11 genes
that showed significant changes in gene expression, 10 ones were associated with immune and
inflammatory response: Arachidonate 5-Lipoxygenase (ALOX5), Complement Component 2
(C2), Chemokine (C-C Motif) Ligand 11(CCL11), Chemokine (C-C Motif) Ligand 24(CCL24),
Defensin, Alpha 1(DEFA1), Interferon-induced protein with tetratricopeptide repeats 3(IFIT3),
Interleukin 11(IL11), Interleukin 12B(IL12B), MX Dynamin-Like GTPase 2(MX2), and
Prostaglandin I2 (Prostacyclin) Receptor (PTGIR). The final gene, Fibroblast Growth Factor
Receptor 3 (FGFR3), is involved in mitogenesis and differentiation of bone development and
maintenance.
In this study, the success of this first field deployment for human lung cell exposure to
ambient air was highlighted. Moreover, the limitations of the study were acknowledged. The gene
expressions were analyzed as a group, while concentrations of a specific chemical would impact
the specific gene expression significantly. Another limitation was the limited time and location of
the study. Due to limited exposure of 4-hour during the afternoon, the exposures during the night,
when the atmospheric transformations are minimal, were not captured and compared. The longer
21
to other cities or rural areas, we would have more knowledge of the biological expressions due to
exposures to different urban and background gaseous mixtures. Finally, we only analyzed RNA of
the selected sets of genes related to inflammation and cancer pathways. Other genes related to
other pathways and other biological effects to DNA, proteins could also be considered to
22
REFERENCES
1. National Toxicology Program, 2014. Report on Carcinogens, Thirteenth Edition. Research Triangle Park, NC: U.S. Department of Health and Human Services, Public Health Service. http://ntp.niehs.nih.gov/pubhealth/roc/roc13/
2. Houston Exposure to Air Toxics Study (HEATS), 2007.
http://files.harc.edu/Projects/AirQuality/Projects/H052/H052FinalReport.pdf
3. Sexton, K., Linder, S., Delclos, G., et al. 2006. Mayor’s Task Force on the Health Effects of Air Pollution, Houston, Texas. A closer look at air pollution in Houston: Identifying priority health risks. University of Texas School of Public Health, Institute for Health Policy.
4. Doyle, M., Sexton, K.G., Jeffries, H., Bridge, K., Jaspers, I. 2004. Effects of 1,3-Butadiene, Isoprene, and Their Photochemical Degradation Products on Human Lung Cells. Environ Health Perspect 112, 1488–1495
5. Lin, Y.-H., Sexton, K.G., Jaspers, I., Li, Y.-R., Surratt, J.D., Vizuete, W., 2014. Application of chemical vapor generation systems to deliver constant gas concentrations for in vitro exposure to volatile organic compounds. Environ. Sci.: Processes Impacts, 16, 2703
6. Doyle, M., Sexton, K.G., Jeffries, H., Jaspers, I. 2007. Atmospheric photochemical transformations enhance 1,3-butadiene-induced inflammatory responses in human epithelial cells: The role of ozone and other photochemical degradation products. Chemico-Biological Interactions 166, 163–169
7. Mögel, I., Baumann, S., Böhme, A., Kohajda, T., Bergen, M., Simon, J.-C., Lehmann, I., 2011. The aromatic volatile organic compounds toluene, benzene and styrene induce COX-2 and prostaglandins in human lung epithelial cells via oxidative stress and p38 MAPK activation. Toxicology 289 (1), 28-37
8. Sisson, J. H., Tuma, D. J., and Rennard, S. I., 1991. Acetaldehyde-mediated cilia dysfunction in bovine bronchial epithelial cells. Am. J. Physiol. Lung Cell Mol. Physiol. 260: 29-36
9. Rager, J.E., Lichtveld, K., Ebersviller, S., Smeester, L., Jaspers, I., Sexton, K.G., Fry, R.C., 2011. A Toxicogenomic Comparison of Primary and Photochemically Altered Air Pollutant Mixtures. Environ. Health Perspect 119, 1583–1589
10. Olaguer, E.P., 2015. Overview of the Benzene and Other Toxics Exposure (BEE-TEX) Field Study. Environ Health Insights 9(4), 1–6.
23
12. The Benzene and other Toxics Exposure (BEE‐TEX) Study.
http://www.harc.edu/work/Benzene_and_other_Toxics_Exposure_BEE‐TEX_Study/
13. “Houston city, Texas”. QuickFacts. U.S. Census Bureau. July 1, 2016. https://www.census.gov/quickfacts/fact/table/houstoncitytexas/PST045217
14. Pierce™ LDH Cytotoxicity Assay Kit. Available from:
https://assets.thermofisher.com/TFS-Assets/LSG/manuals/MAN0011851_Pierce_LDH_Cytotoxicity_Asy_UG.pdf
15. Grubbs, F.E., 1969. Procedures for Detecting Outlying Observations in Samples. Technometrics 11(1): p. 1-21.
16. NanoString Technology. Gene expression panels. Available from: https://www.Nanostring.com/products/gene-expression-panels
17. Continuous Ambient Monitoring Station (CAM). Texas Commission on Environmental Quality. https://www.tceq.texas.gov/cgi-bin/compliance/monops/daily_summary.pl?cams=403 https://www.tceq.texas.gov/cgi-bin/compliance/monops/monthly_summary.pl?cams=1029
18. Arashiro M, Lin YH, Sexton K, et al. In vitro exposures to isoprene-derived secondary organic aerosol: assesing effects of SOA on inflammation-associated gene expression using direct-deposition approach. Paper presented at: Society of Toxicology (SOT); March 22-6, 2015; San Diego, CA.