STABILITY INDICATING METHOD DEVELOPMENT AND
VALIDATION FOR SIMULTANEOUS ESTIMATION OF
EMTRICITABINE AND TENOFOVIR DISOPROXIL FUMERATE IN
BULK AND TABLET DOSAGE FORM BY RP-HPLC
Modugula Jyothsna* and Podili Venkata Seshagiri
Department of Pharmaceutical Analysis SIMS College of Pharmacy, Guntur-522 001,
Andhra Pradesh, India.
ABSTRACT
An accurate, precise and simple stability indicating Chromatographic
method for development and validation for the simultaneous estimation
of Emtricitabine and tenofovir Disoproxil Fumerate in its
pharmaceutical dosage form by HPLC was carried out by using ACE
C18 (150 mmx4.6 mm i.d, 5 μ) column with gradient program, mobile
phase A: 0.01M Citrate buffer pH 4.0 with Ammonia & mobile phase
B: ACN , Flow rate 1.2 ml/min., Injection volume 20 μl, UV detection
was performed by using wavelength at 270 nm.The method was linear
over the concentration range of 20 µg/mL to 70 µg/mL for
Emtricitabine (r2- 0.9997) and 25 µg/mL to 100 µg/mL for Tenofovir
disoproxil fumerate (r2- 0.9996) with limits of detection and
quantification of 0.112 μg/ml & 0.346 μg/ml for Emtricitabine and 0.192 μg/ml & 0.585
μg/ml for tenofovir Disoproxil Fumerate. Forced degradation study was carried out according
to ICH guidelines in Acid Degradation, Base Degradation, Oxidative Degradation, Thermal
Degradation conditions and the method was specific. A study to establish the stability of
standard and test preparations on bench top was conducted and the solutions were stable for
24 hours.
KEYWORDS: Emtricitabine, Tenofovir Disoproxil Fumerate, RP-HPLC, ICH Guidelines.
INTRODUCTION
Emtricitabine works by inhibiting reverse transcriptase, the enzyme that copies HIV RNA
into new viral DNA. Emtricitabine is a synthetic nucleoside analogue of cytidine. It is
Volume 8, Issue 5, 1028-1046. Research Article ISSN 2277– 7105
Article Received on 06 Feb. 2019,
Revised on 26 Feb. 2019, Accepted on 21 March 2019
DOI: 10.20959/wjpr20195-14618
*Corresponding Author
Prof. Jyothsna Modugula
Department of
Pharmaceutical Analysis SIMS College of Pharmacy, Guntur-522 001, Andhra Pradesh, India.
phosphorylated by cellular enzymes to form Emtricitabine 5'-triphosphate, which is
responsible for the inhibition of HIV-1 reverse transcriptase. It competes with the natural
substrate deoxycytidine 5'-triphosphate and incorporates into nascent viral DNA, resulting in
early chain termination. Therefore Emtricitabine inhibits the activity of HIV-1 reverse
transcriptase (RT) both by competing with the natural substrate deoxycytidine 5'-triphosphate
and by its incorporation into viral DNA. By inhibiting HIV-1 reverse transcriptase,
emtricitabine can help to lower the amount of HIV or "viral load", in a patient's body and can
indirectly increase the number of immune system cells (called T cells or CD4+ T-cells). Both
of these changes are associated with healthier immune systems and decreased likelihood of
serious illness. Tenofovir inhibits the activity of HIV reverse transcriptase by competing with
the natural substrate deoxyadenosine 5’-triphosphate and, after incorporation into DNA, by
DNA chain termination. Specifically, the drugs are analogues of the naturally occurring
deoxynucleotides needed to synthesize the viral DNA and they compete with the natural
deoxynucleotides for incorporation into the growing viral DNA chain. However, unlike the
natural deoxynucleotides substrates, NRTIs and NtRTIs (nucleoside/tide reverse transcriptase
inhibitors) lack a 3'-hydroxyl group on the deoxyribose moiety. As a result, following
incorporation of an NRTI or an NtRTI, the next incoming deoxynucleotide cannot form the
next 5'-3' phosphodiester bond needed to extend the DNA chain. Thus, when an NRTI or
NtRTI is incorporated, viral DNA synthesis is halted, a process known as chain termination.
All NRTIs and NtRTIs are classified as competitive substrate inhibitors.
MATERIALS AND METHODS
Emtricitabine and Tenofovir disoproxil fumerate API was obtained as a gift sample from
MYLAN,Bollaram, Hyderabad.
Table.1: Instruments Used.
S. No. Name of Instruments
1 Waters HPLC 2695 with UV detector
2 ACE C18 column 150 X 4.6, 5µ
3 Thermo scientific Finn Pipette
4 Inolab WTW series pH meter
5 Afroset Electronic Balance FX -400
6 Elma S 300H Ultra sonicator
7 Spectra lab water bath shaker
8 Hermle Z 323 centrifuge
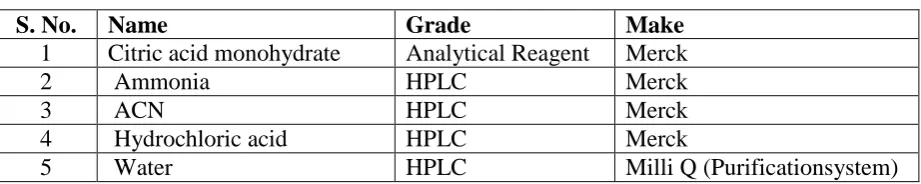
Table.2: Chemicals Used.
S. No. Name Grade Make
1 Citric acid monohydrate Analytical Reagent Merck
2 Ammonia HPLC Merck
3 ACN HPLC Merck
4 Hydrochloric acid HPLC Merck
5 Water HPLC Milli Q (Purificationsystem)
Selection of Wavelength: The sensitivity of method that uses UV detector depends upon the
proper selection of wavelength is that gives maximum absorbance and good response for the
given candidate drug. In setting up the conditions for development of the assay method, the
choice of the detection wavelength was based on the scanned absorption spectrum for
Emtricitabine and Tenofovir disproxil fumerate. The UV-spectrum of Emtricitabine and
Tenofovir disproxil fumerate was separately scanned in the wavelength range of 200-400 nm
against blank. After correlation of the both spectrums 270nm wavelength was selected for the
analysis.[1-6]
3.211 Emtricitabine 6.271 Tenofovir 208.0
261.0 214.0
238.0 281.0
AU
0.00 0.05 0.10 0.15 0.20 0.25 0.30 0.35 0.40 0.45
nm
[image:3.595.69.530.88.180.2]200.00 220.00 240.00 260.00 280.00 300.00 320.00 340.00 360.00 380.00 400.00
Figure. 1: Overlay UV spectrum of EMT and TDF.
Optimized Chromatographic Conditions
Column : ACE C18 (150 mmx4.6 mm i.d, 5 μ)
Flow rate : 1.2 mL/min
Selected wave length : 270nm
Program : Gradient
Detector : UV Detector/ PDA
Mobile phase A : 0.01M Citrate buffer pH 4.0 with Ammonia
[image:3.595.162.443.372.556.2]Injection volume : 20 μL
Temperature : 30ºC
Time (min) Mobile phase-A Mobile phase-B
0 70 30
4 20 80
7 20 80
8 70 30
12 70 30
Preparation of 0.01M Hydrochloric Acid (Diluent): About 8.5mL of concentrated
hydrochloric acid was diluted to 1000 mL with water in a volumetric flask and mixed well.
100 mL of this solution was further diluted to 1000 mL with water and mixed.
Preparation of 0.01M Citrate Buffer (Mobile Phase A): Accurately 2 gm of citric acid
monohydrate was weighed and transferred in to a 1000 mL standard flask and diluted to 1000
mL with water. The pH was adjusted to 4.0 with ammonia, filtered and degassed.
Preparation of Mobile Phase B
ACN was used as mobile phase B.
Preparation of Standard Stock Solution: Accurately 40 mg of Emtricitabine and 60mg of
Tenofovir disoproxil fumerate working standard were transfered into a 100mL volumetric
flask. 50 mL diluent was added and sonicated to dissolve and made up to volume with
diluent.
Preparation of Standard Solution: About 5 mL of the standard stock solution was pipetted
out into a 50mL volumetric flask and diluted up to the volume with diluent and filtered
through 0.45 PVDF filter.
Test Preparation: Accurately weighed amount of the powder equivalent to 200mg of
Emtricitabine and 300 mg of Tenofovir disoproxil fumerate were transfered into a 500mL
volumetric flask. 400mL of diluent was added and sonicated for 45min with intermediate
shaking. It is allowed to cool at room temperature, diluted to volume with diluent and mixed
well. A portion of the above solution was centrifuged in a centrifuge tube with cap at 5000
rpm for 10 min. About 5.0 mL of the above solution was pipetted into 50mL volumetric flask
and diluted to volume with diluent and mixed well. The solution was filtered through 0.45µ
Method Validation
System suitability[7-9]
About 20µL of blank, standard solution (six times) was injected, chromatogram was recorded
and peak response was measured.
The tailing factor for the Emtricitabine and Tenofovir disoproxil fumerate peak should be not
more than 2.0 from the chromatogram of standard solution.
The Relative standard deviation of Emtricitabine and Tenofovir disoproxil fumerate peak area
from six replicate injections of standard solution should be not more than 2.0%.
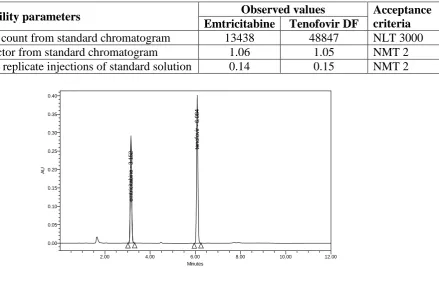
Table. 3: Data for System Suitability.
System suitability parameters Observed values Acceptance
criteria Emtricitabine Tenofovir DF
The USP plate count from standard chromatogram 13438 48847 NLT 3000
The Tailing factor from standard chromatogram 1.06 1.05 NMT 2
% RSD from 6 replicate injections of standard solution 0.14 0.15 NMT 2
e
m
tr
ici
ta
b
in
e
3
.1
5
2 te
n
o
fo
v
ir
6
.0
8
4
AU
0.00 0.05 0.10 0.15 0.20 0.25 0.30 0.35 0.40
Minutes
[image:5.595.115.555.298.579.2]2.00 4.00 6.00 8.00 10.00 12.00
Figure. 2: System Suitability Chromatogram for Standard.
System Precision
Procedure
System precision was performed by injecting six replicate injections of Emtricitabine and
Tenofovir disoproxil fumerate (40 ppm of Emtricitabine and 60ppm of Tenofovir disoproxil
Table. 4: Data for System precision for Emtricitabine.
Injection Number Emtricitabine Peak area
1 1276471
2 1255856
3 1254000
4 1252648
5 1256997
6 1255857
Average 1256313.167
SD 1643.222373
%RSD 0.14
For Tenofovir disoproxil fumerate
Injection number Tenofovir DF Peak area
1 1609813
2 1610262
3 1606962
4 1604478
5 1610537
6 1606525
Average 1608096.167
SD 2467.470236
%RSD 0.15
Precision of Test Method
Table 5: Data for Method precision for Emtricitabine.
S. No. Area % Assay
1. 1146433.0 99.1
2. 1163281.5 100.7
3. 1136656.5 98.3
4. 1148538.5 99.2
5. 1136979.0 98.5
6. 1151405.0 99.5
Mean 99.2
% RSD 0.9
For Tenofovir disoproxil fumerate
S. No. Area % Assay
1. 1608364.5 99.6
2. 1600735.0 99.2
3. 1596586.5 98.9
4. 1602959.0 99.2
5. 1576688.5 97.9
6. 1599553.0 99.0
Mean 99.0
Intermediate Precision
The ruggedness of method was demonstrated by conducting the precision study on different
HPLC system and different column of same make on different day. Assay was performed for
six individual test preparations of 200/300mg strengths as per test method.
Table. 6: Data for Intermediate Precision (Column to Column, System to System
variation).
System suitability parameters
Observed value
Acceptance criteria Column 1 &
system 1
Column 2 & system 2
The Tailing factor for Emtricitabine peak 1.06 1.02 NMT 2.0
The Tailing factor for Tenofovir DF peak 1.05 1.01 NMT 2.0
% Relative standard deviation for Emtricitabine peak 0.14 0.24 NMT 2.0
% Relative standard deviation for Tenofovir DF peak 0.15 0.14 NMT2.0
*(n = 6)
Table. 7: Datafor Intermediate Precision for EMT and TDF.
S. No.
% Assay
Emtricitabine Tenofovir DF
Column–1 and system 1
Column–2 and system-2
Column–1 and system-1
Column–2 and system-2
1 99.1 100.6 99.6 100.3
2 100.7 98.4 99.2 98.2
3 98.3 100.5 98.9 100.2
4 99.2 100.8 99.2 100.6
5 98.5 98.5 97.9 98.3
6 99.5 98.7 99.0 98.3
Average 99.2 99.6 99.0 99.3
% RSD 0.9 1.2 0.6 1.2
Linearity
Linearity of detector response was established by plotting a graph between concentrations
versus peak area. A series of solutions Emtricitabine and Tenofovir disoproxil fumerate
standard was prepared in the concentration ranging from 20 µg/mL to 70 µg/mL for
Emtricitabine and 25 µg/mL to 100 µg/mL for Tenofovir disoproxil fumerate and analyzed as
per test method. A graph was plotted with concentration in µg/mL on X- axis versus response
Table. 8: Data for Linearity for Emtricitabine.
S. No % Level Concentration (µg/mL) Peak Area
1 40 20.032 462372
2 60 28.048 713211
3 80 35.064 948758
4 100 48.079 1165361
5 120 57.095 1405071
6 160 70.127 1892006
For Tenofovir disoproxil fumerate
S. No % Level Concentration (µg/mL) Peak Area
1 40 25.968 639745
2 60 40.952 978324
3 80 57.936 1306936
4 100 71.92 1592068
5 120 86.904 1917759
6 160 100.872 2572312
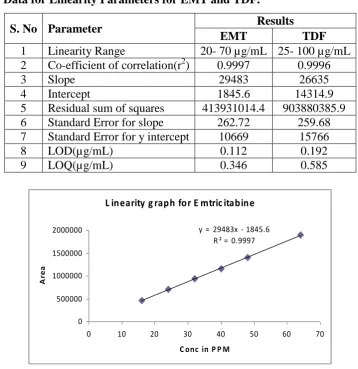
Table. 9: Data for Linearity Parameters for EMT and TDF.
S. No Parameter Results
EMT TDF
1 Linearity Range 20- 70 µg/mL 25- 100 µg/mL
2 Co-efficient of correlation(r2) 0.9997 0.9996
3 Slope 29483 26635
4 Intercept 1845.6 14314.9
5 Residual sum of squares 413931014.4 903880385.9
6 Standard Error for slope 262.72 259.68
7 Standard Error for y intercept 10669 15766
8 LOD(µg/mL) 0.112 0.192
9 LOQ(µg/mL) 0.346 0.585
L inearity g raph for E mtric itabine
y = 29483x - 1845.6 R ² = 0.9997
0 500000 1000000 1500000 2000000
0 10 20 30 40 50 60 70
C onc in P P M
A
re
a
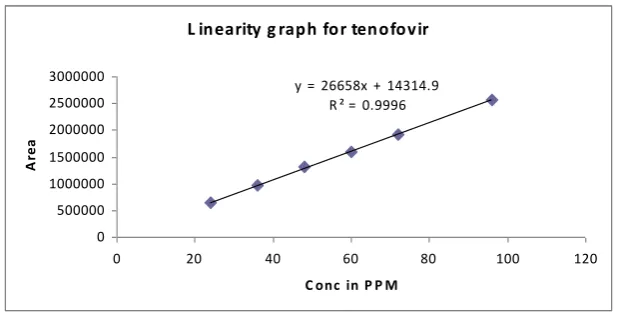
L inearity g raph for tenofovir
y = 26658x + 14314.9 R ² = 0.9996
0 500000 1000000 1500000 2000000 2500000 3000000
0 20 40 60 80 100 120
C onc in P P M
A
re
a
Figure. 4: Calibration Plot for Tenofovir disoproxil fumerate.
Accuracy: The accuracy was confirmed by recovery studies by adding known amount of
placebo to the pure API of Emtricitabine and Tenofovir disoproxil fumerate from about 50%
to 150% of the initial assay concentration. Sample solutions was prepared in triplicate for
each level and analyzed as per test method.
[image:9.595.143.454.72.229.2]
Table 10: Data for Accuracy.
For Emtricitabine
Sample No. % Spike level mg
added
mg
found % Recovery
Mean % Recovery
% RSD
1 50 99.3 99.95 100.7
101.1 0.7
2 50 99.8 100.36 100.6
3 50 99.6 101.46 101.9
1 100 197.61 199.89 101.2
100.6 0.6
2 100 197.51 198.55 100.5
3 100 197.11 197.33 100.1
1 150 296.71 296.01 99.8
99.8 0.4
2 150 297.11 295.32 99.4
3 150 297.31 297.73 100.1
For Tenofovir disoproxil fumerate
Sample No.
% Spike level
mg added
mg found
% Recovery
Mean % Recovery
% RSD
1 50 149.35 148.97 99.7
99.7 0.8
2 50 149.15 147.58 98.9
3 50 149.15 149.76 100.4
1 100 296.71 293.58 98.9
99.4 0.8
2 100 297.21 294.18 99.0
3 100 296.81 298.11 100.4
1 150 446.16 443.26 99.4
99.6 0.3
2 150 445.96 443.22 99.4
Interference from Degradation Products
A study was conducted to demonstrate the effective separation of degradants from
Emtricitabine and Tenofovir disoproxil fumerate peak in Assay method. Separate portions of
drug product and placebo were exposed to the following stress conditions to induce
degradation.[12-15]
1) Treated with 0.1N HCL solution.
2) Treated with 0.1 NaOH solution.
3) Treated with 3% H2O2 solution for about 5 minutes on bench top.
4) Exposed to heat for about 24 hrs at 105ºC.
The chromatograms of the stressed samples were evaluated for peak purity of Emtricitabine
and Tenofovir disoproxil fumerate.
5) Exposed to humidity at 25ºC/90%RH for about 48 hrs.
2 .0 8 7 2 .2 3 8 E M T R IC IT A B IN E 3 .1 8 9 4 .5 5 7 T E N O F O V IR 6 .1 3 4 AU 0.00 0.05 0.10 0.15 0.20 0.25 Minutes
[image:10.595.148.451.337.509.2]2.00 4.00 6.00 8.00 10.00 12.00
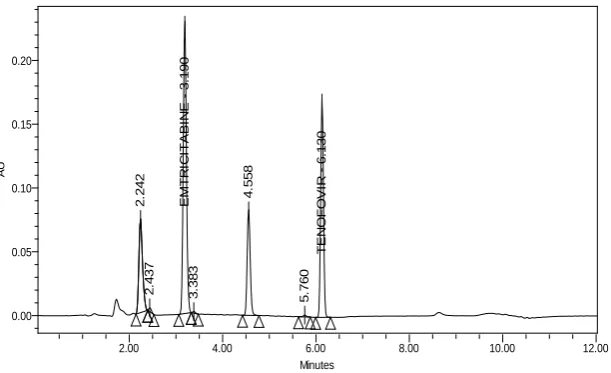
Figure. 5: Chromatogram for Acid Degradation Sample.
2 .2 4 2 2 .4 3 7 E M T R IC IT A B IN E 3 .1 9 0 3 .3 8 3 4 .5 5 8 5 .7 6 0 T E N O F O V IR 6 .1 3 0 AU 0.00 0.05 0.10 0.15 0.20 Minutes
2.00 4.00 6.00 8.00 10.00 12.00
[image:10.595.147.453.555.741.2]1 .7 3 4 2 .0 8 9 E M T R IC IT A B IN E 3 .1 8 6 4 .1 0 2 4 .5 5 6 T E N O F O V IR 6 .1 2 9 AU 0.00 0.10 0.20 0.30 Minutes
[image:11.595.146.452.73.239.2]2.00 4.00 6.00 8.00 10.00 12.00
Figure. 7: Chromatogram for Peroxide Degradation Sample.
1 .5 5 8 S -O x id e Im p u ri ty - 1 .9 8 2 2 .2 3 1 E m tr ic it a b in e 3 .2 2 6 3 .4 5 1 M o n o e st e r Im p u ri ty - 4 .6 7 1 5 .4 4 4 5 .7 7 6 T e n o fo v ir 6 .2 7 0 6 .5 0 0 6 .9 1 0 8 .2 7 9 AU 0.00 0.05 0.10 0.15 0.20 0.25 0.30 0.35 Minutes
[image:11.595.148.453.283.460.2]0.00 1.00 2.00 3.00 4.00 5.00 6.00 7.00 8.00 9.00 10.00 11.00 12.00
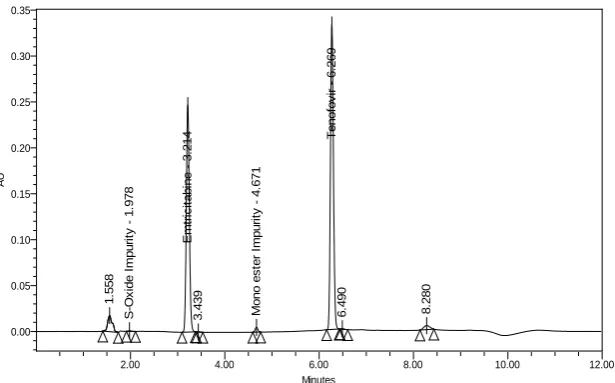
Figure. 8: Chromatogram for Thermal Degradation Sample.
1 .5 5 8 S -O x id e Im p u ri ty - 1 .9 7 8 E m tr ic it a b in e 3 .2 1 4 3 .4 3 9 M o n o e st e r Im p u ri ty - 4 .6 7 1 T e n o fo v ir 6 .2 6 9 6 .4 9 0 8 .2 8 0 AU 0.00 0.05 0.10 0.15 0.20 0.25 0.30 0.35 Minutes
2.00 4.00 6.00 8.00 10.00 12.00
[image:11.595.145.453.507.698.2]Table 11: Data for Emtricitabine Degradation.
Table. 12: Data for TDF Degradation.
Stability of Solutions
Bench Top Stability of Standard Preparation and Test Preparations
A study to establish the stability of standard and test preparations on bench top was
conducted for 24 hours. The assay of standard and test preparations was estimated against
freshly prepared standard at initial and after 24 hours.
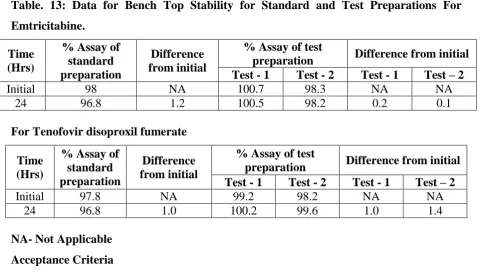
Table. 13: Data for Bench Top Stability for Standard and Test Preparations For
Emtricitabine.
Time (Hrs)
% Assay of standard preparation
Difference from initial
% Assay of test
preparation Difference from initial
Test - 1 Test - 2 Test - 1 Test – 2
Initial 98 NA 100.7 98.3 NA NA
24 96.8 1.2 100.5 98.2 0.2 0.1
For Tenofovir disoproxil fumerate
Time (Hrs)
% Assay of standard preparation
Difference from initial
% Assay of test
preparation Difference from initial
Test - 1 Test - 2 Test - 1 Test – 2
Initial 97.8 NA 99.2 98.2 NA NA
24 96.8 1.0 100.2 99.6 1.0 1.4
NA- Not Applicable
Acceptance Criteria
The % assay results of standard and test solutions should not deviate by ±2.0 from that of
initial.
Name Retention Time Area % Area
Acid 3.189 1073283 40.36
Base 3.190 1068103 39.51
Oxidation 3.186 1031224 38.08
Thermal 3.226 1098375 38.18
Humidity 3.253 1042165 38.12
Name Retention Time Area % Area
Acid 6.134 1138997 42.83
Base 6.130 723577 26.77
Oxidation 6.129 1490223 55.02
Thermal 6.270 1518599 52.79
Bench Top Stability of Mobile Phase
A study to establish stability of mobile phase on bench top was conducted for 5 days.
The system suitability parameters were evaluated as per the test method by using the same
mobile phase on different days (initial, after 1 day, 3 days and 5 days).
Table 14: Data for Mobile Phase Stability on Bench top for Emtricitabine.
System
Suitability Parameters
Observed value
Acceptance Criteria (%RSD) At
Initial
After 1 day
At Day-3
At Day-5
The Tailing factor for Emtricitabine peak in Standard solution
1.06 1.07 1.06 1.04 NMT 2.0
%RSD of peak area of
Emtricitabine 0.14 0.14 0.08 0.03 NMT 2.0
USP plate count of
Emtricitabine peak 13438 12204 13411 11847 NLT 3000
For Tenofovir disoproxil fumerate
System
Suitability Parameters
Observed value
Acceptance Criteria (%RSD) At
Initial
After 1 day
At Day-3
At Day-5
The Tailing factor for
Tenofovir DFpeak 1.05 1.04 1.02 1.10 NMT 2.0
%RSD of peak area of
Tenofovir DF 0.15 0.27 0.07 0.03 NMT 2.0
USP plate count of
Tenofovir DF peak 48847 44742 45416 44478 NLT 3000
Robustness
Effect of Variation in Flow Rate
A study was conducted to determine the effect of variation in flow rate. The system
suitability parameters were evaluated at the flow rate of 0.9 mL/min and 1.1 mL/min.
Table. 15: Data for Effect of Variation in Flow Rate.
System Suitability Parameters Observed value Acceptance
Criteria
0.9mL/min 1.1 mL/min
The tailing factor for Emticitabine peak 1.07 1.06 NMT 2.0
The tailing factor for Tenofovir DF peak 1.06 1.03 NMT 2.0
% Relative standard deviation for Emtricitabine peak 0.26 0.09 NMT 2.0
Effect of Variation in Column Temperature
A study was conducted to determine the effect of variation in column oven temperature. The
system suitability parameters were evaluated at 25°C and 35°C column oven temperatures.
Table. 16: Data for Effect of Variation in Column Temperature.
System
Suitability Parameters
Observed value Acceptance
Criteria
25°C 35°C
The tailing factor for Emticitabine peak 1.07 1.08 NMT 2.0
The tailing factor for Tenofovir DFpeak 1.07 1.07 NMT 2.0
% Relative standard deviation for
Emtricitabine peak 0.11 0.05 NMT 2.0
% Relative standard deviation for
Tenofovir DF 0.11 0.06 NMT2.0
Effect of Variation in pH of Buffer in Mobile Phase
A study to establish the Effect of variation in pH of buffer in mobile phase was conducted.
Mobile phase was prepared with buffer having different pH between 4.3 and 4.7. System
suitability parameters were evaluated by using the above mobile phases.[16-18]
Table. 17: Data for Effect of Variation in pH of Buffer in Mobile Phase.
Filter Interference
A study to establish the suitability of filters was conducted by using two different filters
namely, 0.45µm PVDF filter (Mfg. by: M/s. Millipore) and Nylon 0.45 µm filters (Mfg. by:
M/s. Millipore). Test solutions prepared in duplicate was centrifuged and filtered through the
above different filters and analyzed as per test method. The difference in % Assay between
centrifuged and filtered test solutions was determined.
The standard solution prepared as per test method was filtered through the above different
filters and analyzed along with unfiltered standard solution.[13,14]
The similarity factor of Emtricitabine and Tenofovir disoproxil Fumerate in filtered standard
solutions against unfiltered standard solution was calculated.
System
Suitability Parameters
Observed value Acceptance
Criteria
pH 4.3 pH 4.7
The tailing factor for Emtricitabine peak 1.07 1.07 NMT 2.0
The tailing factor for Tenofovir DF peak 1.04 1.05 NMT 2.0
% Relative standard deviation for Emtricitabine peak 0.14 0.13 NMT 2.0
Filter validation
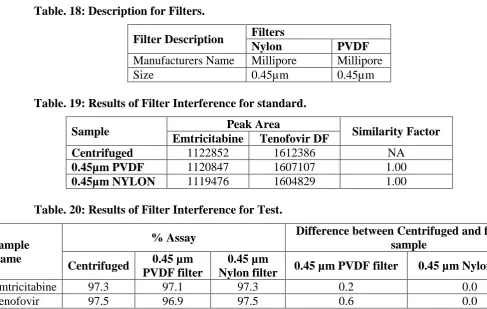
Table. 18: Description for Filters.
Filter Description Filters
Nylon PVDF
Manufacturers Name Millipore Millipore
Size 0.45µm 0.45µm
Table. 19: Results of Filter Interference for standard.
Sample Peak Area Similarity Factor
Emtricitabine Tenofovir DF
Centrifuged 1122852 1612386 NA
0.45µm PVDF 1120847 1607107 1.00
0.45µm NYLON 1119476 1604829 1.00
Table. 20: Results of Filter Interference for Test.
Sample Name
% Assay Difference between Centrifuged and filtered
sample
Centrifuged 0.45 µm
PVDF filter
0.45 µm
Nylon filter 0.45 µm PVDF filter 0.45 µm Nylon filter
Emtricitabine 97.3 97.1 97.3 0.2 0.0
Tenofovir 97.5 96.9 97.5 0.6 0.0
Acceptance Criteria: 1) The % assay of filtered test solutions should not deviate by ± 2.0
from that of centrifuged test solutions
RESULTS AND DISCUSSIONS
A wavelength of 270nm was selected as a detection wavelength for the estimation of
Emtricitabine and Tenofovir disoproxil fumerate in RP-HPLC system. A simple, precise and
accurate RP-HPLC method was developed for the analysis of Emtricitabine and Tenofovir
disoproxil fumerate in tablet dosage form using the mobile phase A consisting of 0.01M
citrate buffer (pH 4.0) and mobile phase B is 100% ACN. The flow rate was found to be
optimized at 1.2 mL/min. It reduced the usage of mobile phase. The system suitability
parameters like retention time, resolution, efficiency, capacity factor, tailing factor and %
RSD was found to be within the limits for the optimized chromatogram.
Method precision: The method precision study was conducted for the Emtricitabine and
Tenofovir disoproxil fumerate sample solutions. %RSD was found to be 0.9 for Emtricitabine
and 0.6 for Tenofovir disoproxil fumerate. Assay was performed to determine the purity of
was found to be 99.2% for Emtricitabine and 99.0% for Tenofovir disoproxil fumerate
respectively.
Intermediate precision: The intermediate precision (Ruggedness) was performed with two
different columns and different instrument but there is no change in retention time, system
suitability parameter and % content.
Linearity: It is evident that the responses for Emtricitabine and Tenofovir disoproxil
fumerate was found to be linear in the studied concentration ranges from 20µg/mL to
70µg/mL and 25µg/mL to 100µg/mL respectively and the correlation coefficient was found
to be r2=0.9997 and r2=0.9996 for Emtricitabine and Tenofovir disoproxil fumerate
respectively.
Accuracy: The accuracy studies was carried out at 3 levels (50%, 100% and 150%) to ensure
the accuracy of the method by adding known concentration of API to Placebo. The average
percentage recovery was found to be in the range of 100% Emtricitabine, 99.5% for
Tenofovir disoproxil fumerate respectively. Nearly 100% recovery showed that the method
was free from the interference of the excipients used in the formulation.
Specificity: The specificity was performed under stress conditions like acid, base, peroxide,
thermal and humidity was performed and observed the degradation of drugs. It was found to
be within the limits. From the above chromatograms of forced degradation studies, and their
purity plots, it can be inferred that peaks of the degradants was not interfere with the retention
time of the main peak of Emtricitabine and Tenofovir disoproxil fumerate.
Bench top stability: Bench top stability for standard, test and mobile phase was performed.
The difference in percentage assay of standard and test preparations between initial and after
24 hours is found to be within the limit. From the above study, it is concluded that the
standard and test preparations are stable for 24 hours on bench top. The mobile phase was
found to be clear and no haziness was observed during the stability period, it is concluded
that the mobile phase is stable for 5 days on bench top.
Robustness: The Robustness was performed by making deliberate changes in flow rate,
column temperature and pH of the buffer solution (mobile phase A). It shows that there is no
change in the retention time even after making deliberate change in the analytical procedure.
Filter validation: The filter validation was performed by using two different filters namely,
0.45µm PVDF filter (Mfg. by: M/s. Millipore) and Nylon 0.45 µm filters (Mfg. by: M/s.
Millipore). The similarity factor of Emtricitabine and Tenofovir disoproxil Fumerate in
filtered standard solutions against centrifuged standard solution is found to be within the
limit. From the above study, it is concluded that both the (PVDF and Nylon) filters are
suitable for standard and test solution filtration.
SUMMARY AND CONCLUSIONS
All the above parameters have shown that the developed method for the estimation of
emtricitabine and tenofovir disoproxil fumerate in bulk and tablet dosage form by rp-hplc
was successfully developed by using RP-HPLC and the method was validated as per the
ICH(Q2B)guidelines and the results have proved that the method is selective, precise,
accurate, stable and linear. Hence it was concluded that the developed method was found to
be applicable for routine quantitative analysis for the estimation of emtricitabine and
tenofovir disoproxil fumerate in bulk and tablet dosage form.
ACKNOWLEDGEMENT
The author would like to thankful the management of SIMS College of Pharmacy, Guntur,
for providing the necessary facilities to carry out this research work.
REFERENCES
1. Anandakumar Karunakaran, Kannan Kamarajan and Vetrichelvan Thangarasu. (A
validated RP-HPLC method for simultaneous estimation of Emtricitabine and Tenofovir
disoproxil fumerate in pure and in tablet dosage form). Der Pharmacia Sinica, 2010; 1(2):
52-60.
2. Anindita Behera AP, Amit Kumar M, Dannana Gowri Sankar, Swapan Kumar, Sudam
Chandra Si. (Development and validation of spectrophotometric method for
determination of Emtricitabine and Tenofovir disoproxil fumerate in bulk and tablet
dosage form). International Journal of Pharma Tech, 2011; 3(3): 1874-1882.
3. Appala Raju N, Shabana Begum. (Simultaneous RP-HPLC method for the estimation of
the Emtricitabine, Tenofovir disoproxil fumerate and Efavirenz in tablet dosage forms).
Research Journal of Pharmacy and Technology, 2008; 1(4): 522-525.
4. Kandagal P B, Manjunatha D H, Seetharamappa J. (RP-HPLC Method for the
determination of Tenofovir in pharmaceutical formulations and spiked human plasma).
5. Maithilee Joshi, Nikalje A P, Shahed M and Dehghan M. (HPTLC Method for the
Simultaneous estimation of Emtricitabine and Tenofovir in tablet dosage form). Indian
Journal of Pharmaceutical Sciences, 2009; 71(1): 95–97.
6. Arjun Goje, Sathis Kumar D, Yogeswaran. P, Sathyabrata Jena, David Banji, KNV Rao.
(A simple HPLC method for quantitation of Emtricitabine in capsule dosage form). Der
Pharma Chemica, 2010; 2(2): 281-285.
7. Beckett A H, Stenlake J B. Practical Pharmaceutical Chemistry. Part-II. 4th edition, CBS
Publishers and Distributors, New Delhi, 2007; 85: 86, 92.
8. Chung Chow Chan, Lee Y C, Herman Lam and Xue-Ming Zhang. Analytical Method
Validation and Instrument Performance Verification. A John wiley and sons, Inc., 2004;
15: 16-21.
9. Dan W Reynolds, Kevin L Facchine, June F Mullaney, Karen M Alsante, Todd D Hatajik
and Michael G Motto. Available guidance and best practices for conducting forced
degradation studies. Pharmaceutical Technology, 2002; 48-56.
10.David G Watson. Pharmaceutical Analysis. 3rd edition, Harcourt Publishers Limited,
2005; 268.
11.Douglas A Skoog, Donald M West, James F Holler and Stanley R Crouch. Fundamentals
of Analytical Chemistry. 8thedition, Thomson Asia Private Limited, Singapore, 2007;
3-10.
12.Gupta S C and Kapoor V K. Fundamentals of Mathematical Statistics. 9th edition, Sultan
Chand and Sons, New Delhi, 1994; 2.6, 3.2-3.28.
13.Gurdeep R Chatwal, Sham K Anand. Instrumental Methods of Chemical Analysis. 5th
edition, Himalaya Publishing House: Mumbai, 2006; 1.2, 2.108, 2.168, 2.147.
14.Hobart H Willard, Lynne L Merritt, John A Dean and Frank A Settle. Instrumental
Methods of Analysis. 7th edition, CBS Publishers and Distributors, New Delhi, 1986; 1,
592: 622-628.
15.Mendham J, Denney R C, Barnes J D and Thomas M J K. Vogel’s Text book of
Quantitative Chemical Analysis. 6th edition, Dorling Kindersley (India) Pvt. Limited.,
New Delhi, 2008; 29, 36: 289-295.
16.Sethi P D. Quantitative Analysis of Drugs in Pharmaceutical Formulations. 3rd edition,
CBS Publishers and Distributors; New Delhi, 2003; 6-9.
17.Yuri kezakevich, Rosario Lobrutto. HPLC for Pharmaceutical Scientist. A John. Wiley &
18.Anonymous. ICH Harmonized Tripartite Guidelines. Text on Validation of Analytical