The Temperature Field Measurement of Billet Based on Multi-Information Fusion
Ma Jiaocheng
1,+, Liu Jun
2, Yang Qiang
1and Chen Liangyu
11School of Mechanical Engineering & Automation, Northeastern University, Shenyang 110004, China
2School of Nuclear Engineering and Geophysics, East China Institute of Technology, Nanchang 330013, China
In the continuous casting process, the internal temperature of billet is difficult to be measured and the surface temperature of billet is also difficult to be measured accurately. The steady-state heat transfer models can only be used for simulating the steady-state casting operations in off-line. For better control over the whole continuous casting cycle, recently more attention have been paid to developing real-time heat transfer models which are valid under casting condition varying frequently. Considering the heat transfer coefficient is the precondition of solving the model, and it is difficult to be measured directly. An identification method of heat transfer coefficient based on genetic algorithm was developed. According to the measured temperature and shell thickness, the heat transfer coefficient of each spray zone was determined. In order to test the dynamic performance of the real-time heat transfer model, the surface temperature was measured using the CCD (charge coupled device) temperature measurement system, which can effectively eliminate the impact of the scales on the billet surface and keep thefluctuation of the measured surface temperature within the range of«10°C. The temperaturefield measurement of billet was realized by the multi-information fusion of CCD temperature measurement system, measured shell thickness and data acquisition system. This provides the possibility to improve the existing cooling system based on the feed-back control considering the measured surface temperature. [doi:10.2320/matertrans.M2014055]
(Received February 18, 2014; Accepted May 19, 2014; Published July 25, 2014)
Keywords: continuous casting, heat transfer coefficient, charge coupled device, measured temperature
1. Introduction
In the continuous casting process, the internal defects which can be formed in cast material are due to inappropriate casting operation and improper secondary cooling water distribution.1) In order to eliminate these defects, the billet solidification process must be controlled.24)The presence of steam within the spray chamber and the formation of scales randomly on the billet surface render the impracticable of continuous direct temperature measurements.5,6) Many heat transfer models have been developed and used to optimize the secondary cooling process.2,7) But these heat transfer models can only be used for simulating the steady-state casting operation in off-line. In the actual production, due to the impact of equipments, processes and actual production conditions, etc., the process parameters are fluctuant frequently, such as superheat, casting speed and secondary cooling water,8)more attention have been paid to developing real-time heat transfer models which are valid under dynamic casting conditions. However, the heat transfer coefficient of each spray zone as the precondition to solve the models is difficult to be measured directly. The empirical heat transfer coefficient to be obtained in specific conditions will lead to the large deviation in the application. Therefore, the heat transfer coefficient must be identified before the model application. In order to identify the heat transfer coefficient, the shell thicknesses and surface temperatures of billet under different conditions were measured and the optimization algorithm of identification the heat transfer coefficient was developed. The surface temperatures of billet were measured using CCD measurement system. The high-resolution CCD camera can eliminate the effect of scales on the billet surface. The temperature field measurement of billet was realized by the multi-information fusion of CCD temperature measure-ment system, measured shell thickness and data acquisition system, which provides the possibility to improve the
existing cooling system based on the feed-back control considering the measured surface temperature.
2. Real-Time Heat Transfer Model
The mathematical heat transfer model is used to describe the heat transfer and solidification process of billet continuous casting. Compared to the heat transfer in the lateral direction, the heat transfer in the casting direction can be ignored due to high energy, low conductivity and high casting speed of the steel. Thus it can be described by the two-dimensional non-steady state solidification equation as follows:2,3,7)
µc@T@¸ ¼@x@ k@T@x
þ@y@ k@T@y
þS ð1Þ
where T, ¸,k,c,µ and S represent billet temperature, time, thermal conductivity of steel, specific heat capacity of steel, density of steel, latent heat, respectively.
To solve the model, taking into account the billet symmetry, only a quarter of the billet section is calculated. The grid division and boundary conditions for the cross-section of the billet are shown in Fig. 1. The P is the control volume, andw,e,n,sare the correspondence interfaces. In the time interval (t, t+"t), eq. (2) is obtained by finite volume method and the discrete equation group of complete implied format is formulated.9)
Z n
s
Ze
w
Ztþt
t µc @T
@t dtdxdy
¼ Ztþt
t
Zn
s
Ze
w @ @x k
@T @x
dxdydt
þ Ztþt
t
Ze
w
Zn
s @ @y k
@T @y
dydxdt
þ Ztþt
t
Ze
w
Zn
s Sdxdydt ð2Þ
(1) Initial condition:
T ¼T0 ð3Þ
(2) Boundary condition: Mould zone:
k@T
@n ¼ab
ffiffi
t
p
ð4Þ
Secondary cooling zone:
k@T@n ¼hðTTwarÞ þ¾·ðT4Tair4Þ ð5Þ
Air cooling zone:
k@T@n ¼¾·ðT4T4
airÞ ð6Þ
where T is the billet temperature, T0 is the pouring temperature, a and b are the constants, t is the residence time of liquid steel in the mould, Twar is the cooling water temperature,Tairis the air temperature,¾is the emissivity,·is the Stefan-Boltzman constant, S is the latent heat, n is the exterior normal of cooling boundary.
The heat transfer coefficient h is calculated by the following equation:10)
h¼1570w0:55ð1¡ 0:0075TwarÞ ð7Þ
where h is the heat transfer coefficient (W/m2/K), w is the water flow density (L/m2/s), T
war is the cooling water temperature,¡is the machine-dependent calibration factor of each spray zone.
In order to calculate the real-time temperaturefield of billet in actual casting process, the casting process parameters must be gathered in real-time. The time interval of sampling must be very short enough so that the data can be updated in a timely to accurately reflect the transient variation of the billet temperaturefield. At the same time, the interval time must be longer than the model calculation time and has certain margin. Therefore, the acquisition time of process parameters must be determined according to the caster machine.
3. Surface Temperature Measurement and Heat Transfer Coefficient Identification
The accuracy of real-time heat transfer model is critical to optimize secondary cooling water dynamically to control the shell thickness, the liquid pool depth, and the temperature of straightening point, therefore the real-time heat transfer model must be revised and validated before application. The developers validated the model by measuring the shell thickness or surface temperature in different locations of the billet, but the thickness measurement cannot realize the real-time measurement for the billet. Therefore, in this paper, the model correction was carried out by means of measured billet surface temperatures, as well as a few measured shell thicknesses under steady-state condition.
The temperature measured by traditional infrared ther-mometer which is single-point measurementfluctuates up to 100°C under the impact of scales generated randomly, while the average filter used to eliminate temperature fluctuation causes the measurement lag and deviations.11)In this study, the CCD measurement system was developed to measure the surface temperature of billet. Figure 2 shows the system structure of the CCD measurement system. With the high-resolution CCD camera,12,13)subtle change within the range of 1 mm diameter on the billet surface can be detected, and the surface temperature of billet can be detected from the gap between the scales, effectively overcoming the effect of scales.
Model correction is important to ensure the accuracy of temperaturefield. The heat transfer coefficient of each spray zone is difficulty to be measured directly. The empirical heat
X
Y
= 0
x T k
0 = y T k
x T k = −q q
y T k =−
Axis of
symmetry
P w
e n
s
Fig. 1 The grid division and the boundary conditions for the cross-section of the billet.
Billet
CCD camera
Infrared thermometer
Soft measurement of billet temperature field Real-time heat transfer model Heat
Amplitude correction
Positionig
Combined
measured shell thickness
[image:2.595.76.264.71.248.2] [image:2.595.91.507.581.771.2]transfer coefficient to be obtained in specific conditions will lead to the large deviation in the application. Therefore, for the application of model, the calculation results of model must be consistent with the measured ones by identification the heat transfer coefficient. In this paper, the heat transfer coefficients were identified with genetic algorithm. The parameter ¡ of each spray zone was identified by the measured surface temperature and shell thickness of billet.
Considering the measurement error of shell thickness and surface temperature, the constraint conditions were as follows: (1) The error of measured and calculated shell thickness
must be limited to within the range of 2 mm.
jHcalHmeasj 2 ð8Þ
(2) The error of measured and calculated temperature must be limited to within the range of 10°C.
jTcalTmeasj 10 ð9Þ
The objective was to minimize deviation of the measured and calculated values as a function of the heat transfer coefficients and two constraints of measured shell thickness and temperatures, and the F(¡) was the objective function. This is achieved by carrying out a series of simulations performed by the heat transfer model. The optimization process using the penalty function method:
Fð¡Þ ¼Xn
i¼1 jHcal
i Himeasj Hmeas
i w
H i
þXm
i¼1 jTcal
i Timeasj Tmeas
i w
T
i þPð¡Þ ð10Þ
where wiH, wiT is the weight of the criterion. P(¡) is the penalty function.
The genetic algorithm2)applied for the parameter
identi-fication in continuous casting consists of:
Step 1: generation an initial population of results simu-lated with input parameters of process (nominal); Step 2: compute the billet surface temperature and shell thickness of setting points and the objective function;
Step 3: modify heat transfer parameters in each region where the constraint was violated;
Step 4: the generation of new results;
Step 5: compute the billet surface temperature and shell thickness of setting points and the objective function;
Step 6: if objective function decreased, then the result is
F(¡);
Step 7: if F(¡)¼0 end, and output the parameters of each sprays zone; otherwise go to step 2.
4. Results and Discussion
The real-time model was based on an actual caster in a steel plant. The caster radius is 10 m. The secondary cooling is spread over three zones, and each zone is independently controlled through control valves to regulate the flow of water to the spray nozzles. The parameters of caster and thermal physical properties of Q235 steel used in calculation were shown in Tables 1 and 2, respectively.
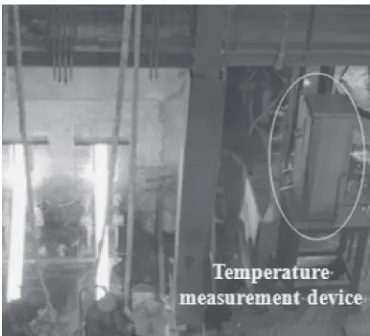
In the casting process, the fluctuation of superheat of molten steel causes frequently change of the casting speed and secondary cooling water. In order to research the dynamic temperature field of billet under varying casting conditions, the surface temperature was measured continu-ously at the secondary cooling zones. Figures 3, 4 and 5 show thefield application of CCD temperature measurement system, the CCD image of billet surface and surface temperature distribution of billet, respectively. It can be seen from Fig. 4 that the scales generated randomly on the surface of billet lead to measured temperaturefluctuation. In order to reduce or even eliminate the temperature fluctuation, the rectangle area at the measured point was divided into many small grids (the size of each small grid size is 1 mm©1 mm). The average temperature of each grid was regarded as the center point of grid. The surface temperature gradient of billet is very little in the withdrawal direction, so it was assumed that the temperature at measured point neighborhood doesn’t change in the withdrawal direction and the max temperature of grid of each column was near the actual temperature of correspondence grid of measured point transverse. The temperature of measured point can be obtained by the curve fitting of max temperature of each column. This peakfiltering method can effectively reduce or eliminate the impact of scales on the temperature measure-ment and keep the measured surface temperaturefluctuation within the range of «10°C. Figure 6 shows the comparison of measured temperatures between CCD measurement system and infrared single-point measurement system. Traditional temperature measurement method which adopts infrared single-point measurement technique can cause the
[image:3.595.304.550.83.173.2]fluctuation of measured temperature up to 100°C. The new CCD measurement system and its peakfilter method used in
Table 1 Geometry of the billet caster.
Parameter Value
Section size (mm) 150©150
Mold length (m) 0.85
Spray zone lengths (m)
zone 1 0.32
zone 2 1.95
[image:3.595.305.549.215.354.2]zone 3 5.69
Table 2 Thermal physical properties of Q235 steel.
Parameter Value
Liquidus temperature (°C) 1515
Solidus temperature (°C) 1485
Specific heat of liquid steel (kJ/kg/K) 0.84 Specific heat of solid steel (kJ/kg/K) 0.67 Density of liquid steel (kg/m3) 7000 Density of solid steel (kg/m3) 7600 Heat conductivity of liquid steel (W/m/K) 34.0 Heat conductivity of solid steel (W/m/K) 29.4
Heat of fusion (kJ/kg) 270
this study can effectively eliminate the impact of scales and keep the small temperaturefluctuation.
The real-time heat transfer model was revised by measur-ing the shell thicknesses and surface temperatures in different locations of the billet. The shell thickness was measured by using shooting nails, which include FeS, whose solute distribution has a very significant difference when sulfur element diffuses between liquid and solid.14) So the shell thickness can be gained at the shooting nails position by the sulfur print. The shell thicknesses and temperatures were shown in Tables 3 and 4 between the measured and calculated values after the identification of the heat transfer coefficient. The parameters ¡ of heat transfer of each spray zone were 3.73, 4.15 and 4.57, respectively. From the
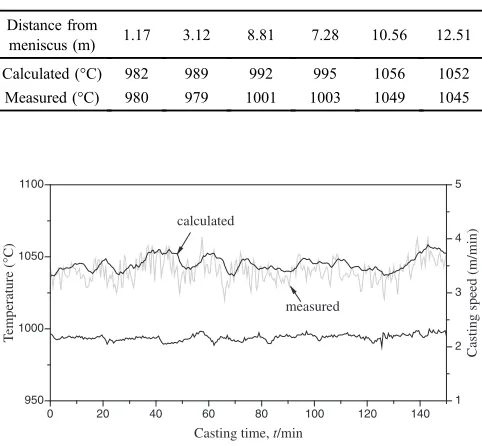
Table 3, the consistency of shell thickness between exper-imental data and numerical results was obtained. As shown in Table 4, the test error was within the range of «10°C between the measured and calculated temperatures of each secondary cooling zone under steady condition, and the calculated result was basically consistent with the measured data.
In order to test the dynamic performance and response to operation conditions of the real-time transfer model, the surface temperatures calculated by the real-time model and measured by the CCD temperature measurement system were compared at 12.51 m distance from meniscus in the actual casting process. As seen in Fig. 7, the calculated surface temperatures were agreement well with the measured ones. Fig. 4 The CCD image and grid division of billet surface at measured
point.
Fig. 5 Billet surface temperature distribution captured by CCD temper-ature measurement system.
0 10 20 30
900 920 940 960 980 1000 1020 1040 1060
2 3
infrared measurement system
Measurement temperature (
°
C)
Casting time, t/min CCD measurement system
Casting speed (m/min)
casting speed
[image:4.595.76.261.69.237.2]Fig. 6 Comparison between CCD measurement system and infrared single-point measurement system.
Table 3 Comparison between calculated and measured shell thickness at 3.07 and 8.71 m distance from meniscus.
No. Casting
temperature (°C)
Casting speed (m/min)
Secondary cooling waterflow (Mg/h)
Shell thickness (mm)
3.07 8.71
Zone1 Zone2 Zone3 measured calculated measured calculated
1 1560 2.10 9.39 9.22 2.76 27 28 50 49
2 1547 2.63 10.85 20.25 4.55 24 23 47 48
[image:4.595.323.530.70.231.2] [image:4.595.83.253.278.450.2] [image:4.595.316.539.288.443.2] [image:4.595.48.551.510.582.2]The temperature field measurement of billet was realized by the multi-information fusion of CCD temperature measure-ment system, measured shell thickness and data acquisition system, which provides the possibility to improve the existing cooling system based on the feed-back control considering the measured surface temperature.
5. Conclusion
The real-time heat transfer model and heat transfer coefficient identification method were developed. The surface temperatures were measured by CCD measurement system,
which can effectively eliminate the impact of scales on the temperature measurement and keep the measured surface temperature fluctuation within the range of «10°C. The temperature field measurement of billet was realized by the multi-information fusion of CCD temperature measurement system, measured shell thickness and data acquisition system, which provides the possibility to improve the existing cooling system based on the feed-back control considering the measured surface temperature.
Acknowledgements
The authors would like to gratefully acknowledge the
financial support of National Natural Science Foundation of China (61004135, 51304050).
REFERENCES
1) J. K. Brimacombe and K. Sorimachi:Metall. Trans. B8B(1977) 489 505.
2) C. A. Santos, J. A. Spim and A. Garia: Eng. Appl. Artif. Intel.16
(2003) 511527.
3) J. C. Ma, Z. Xie, Y. Ci and G. L. Jia:Mater. Sci. Technol.25(2009) 636639.
4) F. R. Camisani-Calzolari, I. K. Craig and P. C. Pistorius:ISIJ Int.38
(1998) 447453.
5) F. Meriaudeau:Image Vis. Comput.25(2007) 11241133.
6) G. Sutter, L. Faure, A. Molinari, N. Ranc and V. Pina:Int. J. Mach. Tools Manuf.43(2003) 671678.
7) H. M. Wang and G. R. Li:ISIJ Int.45(2005) 12911296.
8) S. Louhenkilpi, M. Makinen, S. Vapahti, T. Raisanen and J. Laine:
Mater. Sci. Eng. A413414(2005) 135138.
9) J. I. Ramos:Appl. Math. Comput.188(2007) 739748.
10) E. A. Mizkar: Iron Steel Eng.47(1970) 5360.
11) J. Liu, J. Ma, F. Yang, H. Xiao and L. Rao:J. Iron Steel Res. Int.19(8) (2012) 1216.
12) D. Zheng and Y. Zhou: Acta Electron. Sin.37(2009) 27742777. 13) J. Liu, Z. Hu, J. Lei and Z. Xie: Acta Electron. Sin.38(2010) 1196
1200.
14) T. Kawawa, H. Sato, S. Miyahara, T. Koyano and H. Nemoto: Testsu-to-Hagane02(1974) 206216.
0 20 40 60 80 100 120 140
950 1000 1050 1100
1 2 3 4 5
T
emperature (
°
C)
Casting time, t/min calculated
measured
Casting speed (m/min)
[image:5.595.49.290.90.313.2]Fig. 7 Comparison between calculated and measured temperature at changing the casting speed.
Table 4 Comparison between measured and calculated temperatures of secondary cooling zones.
Distance from
meniscus (m) 1.17 3.12 8.81 7.28 10.56 12.51
Calculated (°C) 982 989 992 995 1056 1052