Advances in Engineering Software 00 (2017) 1–22
Advances
in Eng.
Software
-An integrated platform for design and numerical analysis of shield
tunnelling processes on different levels of detail
Jelena Nini´c
a,, Christian Koch
a, Janosch Stascheit
baCentre for Structural Engineering and Informatics, The University of Nottingham, UK bMaidl Tunnelconsultants GmbH & Co. KG, Duisburg, M¨unchen, Germany
Abstract
Building and construction information modelling for decision making during the life cycle of infrastructure projects are vital tools for the analysis of complex, integrated, multi-disciplinary systems. The traditional design process is cumbersome and in-volves significant manual, time-consuming preparation and analysis as well as significant computational resources. To ensure a seamless workflow during the design and analysis and to minimise the computation time, we propose a novel concept of multi-level numerical simulations, enabling the modelling on different Levels of Detail (LoDs) for each physical component, process information, and analysis type. In this paper, we present SATBIM, an integrated platform for information modelling, structural analysis and visualisation of the mechanised tunnelling process for design support. Based on a multi-level integrated parametric tunnel information model, numerical models for each component on different LoDs are developed, considering proper geometric as well as material representation, interfaces and the representation of the construction process. Our fully automatic modeller for arbitrary tunnel alignments provides a high degree of automation for the generation, the setup and the execution of the simula-tion model, connecting the multi-level informasimula-tion model with the open-source simulasimula-tion software KRATOS. The software of SATBIM is organized in a modular way in order to offer high flexibility not only for further extensions, but also for adaptation to future improvements of the simulation software. The SATBIM platform enables practical, yet flexible and user-friendly generation of the tunnel structure for arbitrary alignments on different LoDs, supporting the design process and providing an insight into soil-structure interactions during construction.
Keywords:
Mechanised Tunnelling, Building Information Modelling, Numerical Analysis, Finite Element Model, Level of Detail, Soil-structure Interaction.
1. Introduction
Building Information Modelling (BIM) enables the design and analysis of complex, multi-disciplinary systems as often encountered in infrastructure projects and, in particular, tunnelling. Complex projects such as shield-driven tunnels in urban areas require demanding data management as well as analysis during the complete life cycle (design, planning, and construction).
Following the state-of-the-art in engineering practice, the design of a tunnel is assessed by analytical, empirical, or very complex numerical models. In recent years, extensive multi-disciplinary research has been carried out to promote the development and implementation of underground construction. Special focus has been put on the development of
numerical models and design concepts to deal with the manifold complex interactions of the components and processes in mechanised tunnelling in urban areas. This allowed to move from empirical models for prediction of tunnelling-induced effects, which neglected the soil-structure interaction effects [1, 2, 3], to modern numerical strategies for the modelling of 3D interaction effects [4, 5, 6]. Combining sophisticated simulation models with machine learning tools enables predictions of tunnelling-induced effects and steering of the construction process in real-time [7].
On the other hand, in recent years, BIM has gained increasing attention in infrastructure projects, simplifying the planning and analysis and increasing productivity in design and construction. Although BIM was initially developed for managing building data during the building’s life cycle, recently, the concept has been extended to enable the representation of subsurface construction and geo-related data, such as geological, hydrogeological and geotechnical objects and properties [8]. Moreover, the BIM concept has been used to create a tunnel information modelling frame-work that creates and interlinks a ground model, a tunnel lining model, a tunnel boring machine model as well as a built environment model [9]. The most recent advances in BIM for infrastructure allow for multi-level information representation of the built environment with the adequate Level of Detail (LoD) to support planning and analysis tasks of large tunnel projects [10].
Considering the fact that each project from its early design stage over construction to the operation phase requires both information management and numerical analysis, the need for a unified approach becomes evident. Currently, in engineering practice, the generation of numerical models based on tunnel design and reports (even when those are part of a BIM) requires demanding manual intervention of experts and is thus error-prone. In addition, the resulting simulations can incur substantial computational effort. Recently, the link between information and numerical mod-elling for modmod-elling of structures has been addressed in [11, 12] where the Finite Element (FE) method is used for the analysis of the structural behaviour of design alternatives generated in the BIM framework. Another example is the Analysis in Computer Aided Design (AiCAD) concept for integrated design and analysis of structural membranes, where Isogeometric Analysis (IGA) [13] is applied to non-uniform rational B-Splines (NURBS) surfaces, i.e. unmod-ified CAD geometry [14, 15, 16]. This approach fully exploits the benefits of geometrical definitions in design tools (NURBS surfaces) and makes use of basis functions from CAD for representing the geometry as well as the solu-tion fields in IGA. Yet, for geotechnical problems, there is no generic link between BIM and numerical simulasolu-tions. Some initial research in this direction has been presented in [17, 18], where data obtained from a Tunnel Information Model (TIM) [19] is applied for the generation of the numerical model for a real-world tunnelling project, namely the Wehrhahn metro line in Duesseldorf.
A unified integration of all information in one multi-level model not only facilitates technical design and construc-tion aspects, but can also be employed in cost estimates, accounting, quality controlling, producconstruc-tion management and, last but not least, in claim management for the project. For these economically important aspects, every investment in the configuration of the model and the supply of suitably processed data pays off as soon as any technical or con-tractual problem occurs and information needs to be retrieved fast and reliably. A seamless documentation along with clear definitions of times, locations and components of the tunnel are a prerequisite for that. To this end, the here proposed BIM can be linked to a process controlling system [20] in the construction phase of the project to allow for a real-time update of the project information.
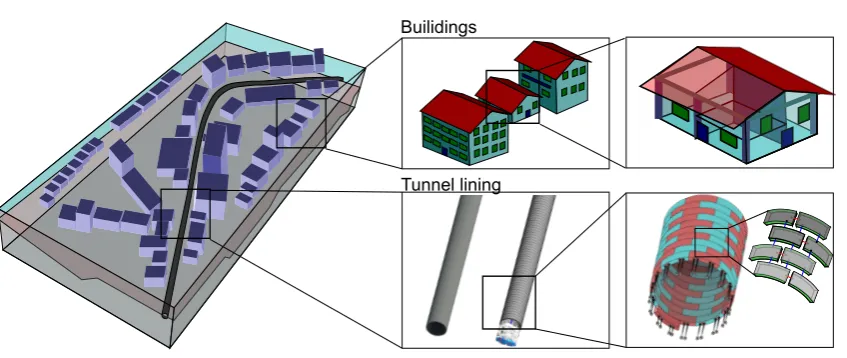
During the design and analysis of major infrastructure projects such as shield-driven tunnels, different scales have to be considered: from the kilometre scale for the general alignment of the track, down to the centimetre scale for detailed design of connection points, as illustrated in Figure 1. Moreover, both the planning and the design phase require data analysis, modelling, numerical analysis, and visualisation. These tasks are supported by Geographic Information Systems (GIS), BIM tools, and software for numerical simulation.
To carry out those tasks with high consistency when changing scales and modelling the components on different LoDs, a sound foundation for handling such multi-level representations is required. Multi-level modelling is already well-established in the GIS field [21], where most often the “bottom-up” approach is used, generalizing detailed models to more abstract ones [22]. Besides, multi-level modelling has become standard for modelling buildings [23, 24] as well as an integral part of CityGML [25]. However, there is only a very limited number of examples where the multi-level approach is used to support the planning, design, and analysis of large tunnel projects [10].
Builidings
[image:3.595.89.513.101.280.2]Tunnel lining
Figure 1. In large infrastructural projects planning, design and analysis is performed on different scales (from kilometre to centimetre), which requires modelling on different LoDs.
phases. Nowadays those analyses are usually conducted using different models and software on different stages, and therefore the link between them is not generic and may suffer from inconsistencies. Therefore, multi-level concepts would be extremely useful in the context of numerical analysis for such projects.
To enable information and numerical modelling preserving the consistency of data on different LoDs, this paper presents SATBIM, a comprehensive platform for incorporating multi-level representations into BIM and numerical analysis. A particular focus of this paper is the link between(i)the geometric-semantic modelling of shield tunnels on different LoD,(ii)the numerical analysis and(iii)the visualisation of central results of the numerical analysis.
This paper is organised as follows: Section 2 introduces the concept for parametric multi-level information mod-elling as a basis for numerical analysis, giving an overview on the software architecture and the data flow. Sec-tion 3 presents the automatic modellerSatBimModellerfor the generation of multi-level numerical simulations for soil-structure interaction in tunnelling based on the multi-level information model. Moreover, in Section 3, the visualisation of simulation results within the BIM design environment and our strategy for real-time design optimi-sation is introduced. Section 4 gives examples of integrated information and numerical modelling, demonstrating the capabilities of the proposed concept. In Section 5, we conclude, summarizing the central findings of this paper.
2. Integrated multi-level information and numerical modelling for design support
2.1. Multi-level parametric information and numerical modelling 2.1.1. The Concept
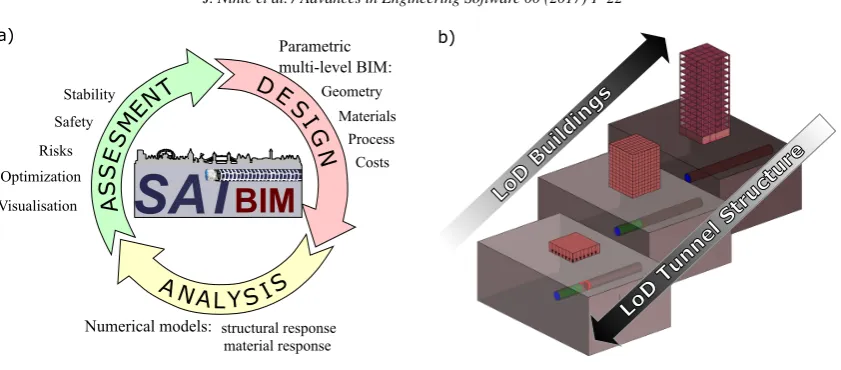
Nowadays, large infrastructural projects require both information management and numerical analysis on different LoDs throughout the complete project life cycle. To facilitate the tasks of design, analysis and assessment of different design solution, SATBIM provides a unified platform for information and numerical modelling (see Fig. 2a). The central goal of SATBIM is to develop a multi-level simulation model for the tunnel-structure interaction integrated in the framework of BIM to support engineering decisions in the planning and design phase. This allows for the subsequent evaluation and minimisation of risks on existing infrastructure. Our approach also enables the general evaluation of the efficiency of such a multi-level simulation approach in other fields related to engineering design and risk assessment.
The appraisal of different design alternatives is essential for ensuring an optimal design alternative. The current state-of-the-art process for dealing with alternatives involves repeated manual changes of the simulation model, re-simulation of the complete model, and manual evaluation of the results. This is cumbersome, error-prone, and requires significant computing resources and time. Note that in the conceptual phase, a designer often only needs approximate estimations for many different scenarios, e.g. tunnel track alternatives. Moreover, different design objectives require
A NALYS IS
D E
SI
G
N
A
S
S
E
S
M
E
T
N
Parametric multi-level BIM:
Numerical models:
Geometry Materials
Costs Process Stability
Safety
Optimization Risks
structural response material response
Visualisation
SAT
BIM
LoD B uild
ings
LoD T unne
l Str uctu
re
a) b)
Figure 2. a) Concept for integrated SATBIM platform for design, numerical analysis and assessment on different LoD; b) multi-level approach in information and numerical modelling.
different approaches for assessing the safety and stability. For example, minimising the overall risk of damage to buildings needs high LoD for structures and low LoD for lining, while estimating stresses in the tunnel structure needs high LoD for lining, while low LoD for buildings is sufficient (see Fig. 2b).
To ensure a seamless workflow, the analysis time should be minimised, i.e., the simulation model should be configured such that it captures all important effects at minimal complexity. In SATBIM, this is enabled by adopting a multi-level representation for both information and numerical modelling. It is also crucial to ensure consistency across different scales, i.e., representations on different LoDs. The approach of SATBIM fulfils the requirements of efficiency and consistency by dynamically generating simulation models from BIM models at the required LoD for the specific problem to be solved. Moreover, SATBIM provides an integrated platform for structural analysis, visualisation and optimisation of the mechanised tunnelling process from early stages of the design over to the construction and the operation phase.
2.1.2. Multi-level approach
As mentioned above, in the design phase of tunnelling projects, decisions have to be made on widely differing scales: from the kilometre scale for tunnel alignment to the centimetre scale for modelling the tunnel structure and its details. Those scales have to be consistently connected in order to avoid spatial conflicts (see Fig. 3a).
In SATBIM, for each component of the shield tunnelling process further described in Section 3.1, three LoDs are defined:Low,MediumandHigh, also referred to as LoD 1, 2, and 3 in the following.
In general, on the lowest LoD 1, a non-volumetric representation of the respective component is assumed, since in the corresponding numerical model, the component is not represented with actual structural models, but instead with an empirical model realized through a set of boundary conditions. On the medium LoD 2, for each component, a vol-umetric representation is established, where the component is “occupying” the exact volume, however, the geometry is simplified, i.e., approximated. Finally, on the highest LoD 3, we include more details about the actual geometry of the component. In some cases, higher LoDs would be conceivable. For example, components like the Tunnel Boring Machine (TBM) do not include all details of the machinery and the equipment inside the shield on LoD 3. Therefore, an even higher LoD 4 could be introduced as an extension. Since the structure of the information model and the SatBimModelleris very flexible, adding a further LoD can be done without affecting the existing model structure, which will be further addressed in Section 3.
[image:4.595.89.510.97.282.2]Parameter list Revit family Revit model
LoD 1
LoD 2
[image:5.595.181.414.107.268.2]LoD 3
Figure 3. Multi-level representation of geometry: parameter consistency between different LoDs for individual components. Lining representation on LoD 1: outer surface boundary of occupied volume; LoD 2: 3D lining shell; LoD 3: 3D lining segment of typen.
In order to keep consistency between different LoDs, in SATBIM parametric consistency between Families is defined as shown in Fig. 3: the full set of parameters defining a component is needed for definition on the highest LoD, while only a subset of the parameter list is used on lower LoDs. This way of handling parameters allows for automated preservation of the consistency of the multi-scale model.
2.2. Software architecture, tools and workflow
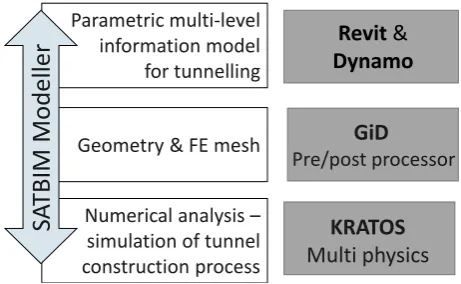
To perform the tasks of design, analysis and assessment of a tunnel project, different tools for BIM, (re-)meshing and numerical analysis are integrated into the user-friendly SATBIM platform, providing a high level of automation. For BIM, the industry-standard Autodesk tools Revit and Dynamo [26] are employed. For numerical simulations, we use the pre/post-processor GiD [32] together with KRATOS [33], an open-source FE platform for high performance computing. These software packages are connected through our newly developedSatBimModellerfor automated data exchange and communication between the information model, the re-meshing and modelling tool, and the FE software (see Fig. 4).
Parametric multi-level information model
for tunnelling
Geometry & FE mesh
Numerical analysis – simulation of tunnel construction process
GiD
Pre/post processor
SA
TBIM
Modelle
r
Revit
&
Dynamo
KRATOS
Multi physics
Figure 4. Tools used in SATBIM: Revit and Dynamo [26], GiD [32] and KRATOS [33].
Different software packages could be applied for each of the aforementioned tasks, however, in the SATBIM framework, we have chosen those particular tools due to their flexibility, availability, adaptability, compatibility and pre-existing developments in terms of numerical simulation for tunnelling. Each of the employed software tools is briefly described in the following subsections.
[image:5.595.180.411.495.637.2]2.2.1. Revit and Dynamo
The authors are not aware of any open-source BIM design tools, however, there are many different commercial BIM design tools on the market that provide open Application Programming Interfaces (APIs). What all of the BIM design tools have in common are (a) the functionality of viewing, designing, documenting and visualising building and infrastructure systems, and (b) the add-on to support computational or algorithmic design. Examples are Au-todesk Revit [26] and Dynamo [27], Bentley MicroStation [28] and GenerativeComponents [29], and GRAPHISOFT ARCHICAD [30] and Rhino-Grasshopper-ARCHICAD toolset [31]. While the proposed parametric multi-level in-formation modelling concept could be implemented using any of the mentioned tools, the authors have decided to use Revit and Dynamo for the following reasons. First, in civil and building engineering Revit is the most popular BIM design tool. Second, the authors have got prior knowledge on the usage and programming of Revit. Third, Revit is used by our project industry partner.
Revit is a software for BIM design including features for architectural design, MEP and structural engineering and construction [26]. It offers the possibility to define custom parametric Families for structural components, assigning geometric and semantic (e.g. material) properties as parameters, which are then exchangeable in the information model. This feature is used in the Tunnel Information Model when creating custom families on different LoDs for individual structural components.
Dynamo is an Add-on for computational design in Revit – a visual programming tool for designers that makes use of external libraries or any Autodesk product that has an API [27]. Another advantage of Dynamo is that the Python programming language can be used to extend existing Dynamo models in a programming manner. Python offers much more flexibility when writing conditional statements and loops, or other operations in order to write algorithms for the generation on custom nodes.
2.2.2. GiD
GiD is a universal, adaptive and user-friendly pre and post processor for numerical simulations in science and engineering [32]. GiD is used to perform the geometry and FE mesh generation based on the TIM. The geometrical entities imported as ACIS files (volumes, surfaces, lines and points) are assigned to logical layers, to which the individual conditions and boundary conditions are assigned. Furthermore, GiD is used to generate a suitable FE mesh for the simulation model.
GiD allows for a customisation of its user interface by means of so-calledproblem types. These problem types define a set of application-specific conditions and materials to be applied to all geometrical entity types, i.e. points, lines, surfaces, or volumes. By means of an input file template, the mesh and the conditions can be translated to a user-defined format that can be read by the simulation kernel. During the mesh generation, GiD automatically assigns the conditions to the mesh according to their definition of layers. Thus, the definition of model conditions is independent from the actual mesh. This approach allows for a large amount of flexibility for the automatically generated meshes, since the user does not have to know about the mesh topology prior to meshing.
Recent developments in GiD include the possibility for pre and postprocessing, including visualizazion of results, based on NURBS-based geometries. This feature renders GiD a suitable tool for IGA. This allows for a new approach called AiCAD, which uses NURBS-based B-Rep models in combination with isogeometric B-Rep analysis (IBRA) for modelling and analysis of free-form geometries [15]. An equivalent approach will be adopted in further extensions of SATBIM for modelling of tunnel lining.
2.2.3. KRATOS Multiphysics
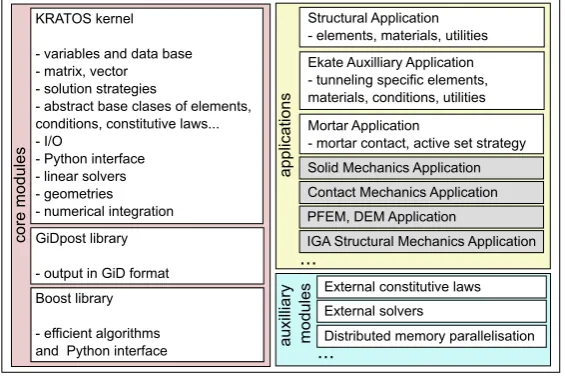
KRATOS is a modular, object-oriented open source framework for the development of FE applications for multi-physics simulations [34, 33]. The aim of KRATOS is to allow for a simple yet robust and efficient implementation of various FE algorithms. The main requirements are: generality in design and implementation, flexibility and extensi-bility, a good level of reusability of libraries and tools, and good performance and memory efficiency.
and general numeric tools such as prototypes for the classes used in KRATOS (Element,Node,ConstitutiveLaw, etc.), the central database used to store the mesh, the global and solution step variables, and a large collection of efficient linear solvers for various problems . The Kernel is the core based on which the different applications are built. More-over, providing a common infrastructure for all applications, it also enables communication between the applications.
core m
odule
s
KRATOS kernel
- variables and data base - matrix, vector - solution strategies
- abstract base clases of elements, conditions, constitutive laws... - I/O
- Python interface - linear solvers - geometries - numerical integration GiDpost library
- output in GiD format
applica
tions
Structural Application - elements, materials, utilities Ekate Auxilliary Application - tunneling specific elements, materials, conditions, utilities
Boost library
- efficient algorithms and Python interface
Mortar Application
- mortar contact, active set strategy
aux
illia
ry
mo
dules
External constitutive laws External solvers
Distributed memory parallelisation Solid Mechanics Application
...
Contact Mechanics Application PFEM, DEM Application
IGA Structural Mechanics Application
[image:7.595.157.440.181.369.2]...
Figure 5. Modular structure of KRATOS
Applications. For the simulation of mechanized tunnelling, several parts of KRATOS have been utilized. The core of the simulation software is formed by theStructural Applicationand a couple of auxiliary applications such as the Mortar Applicationand theekateAuxiliary Application, which serve special requirements of 3D FEA in tunnelling. TheStructural Applicationincludes the implementation of elements, constitutive laws, solution strategies, specific conditions and utilities for general applications in structural mechanics. TheMortar Applicationcontains an interface formulation including tying and contact, while in theekateAuxiliary Applicationincludes some additional algorithms and components which are specifically defined for shield tunnelling problems [39].
In addition to applications used for development of the numerical model for tunnelling, KRATOS provides a number of fully featured applications that each define a whole class of engineering problems, for example: Solid Mechanics Application,Contact Mechanics Application,IGA Structural Mechanics Application,Wind Turbine Application,Soil Freezing Application, etc. Since KRATOS is an open-source FE framework, it offers possibilities for experienced engineers and developers to use and adapt the code or build interfaces and integrate the analysis in BIM workflows for a wide range of civil engineering applications.
2.2.4. SatBimModeller
Revit, GiD and KRATOS Multiphysics are connected through our newly developed SatBimModeller, en-abling the tasks of modelling, analysis and visualisation (see Fig. 4) in a unified way. SatBimModeller is mainly written in Python, using a modular architecture that allows for easy extension and adaptation of the platform. SatBimModelleris explained in more detail in Section 3.2. Furthermore, we developed a number of Dynamo programs (so-called “Dynamo nodes”), which allow to parametrically generate the BIM model for the tunnel project within Revit.
2.2.5. Workflow and data exchange
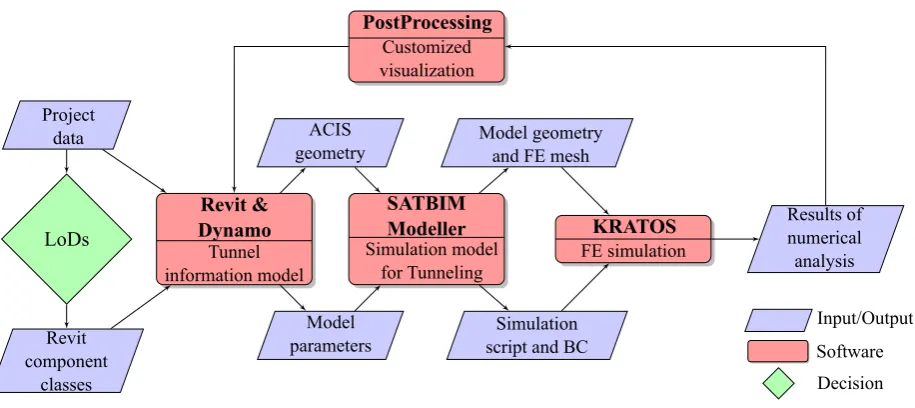
Figure 6 shows the data flow for the tunnelling project, starting from the specific requirements of the project, over to the Tunnel Information Model (TIM) generated using Revit/Dynamo to GiD andSatBimModeller(where the FE simulation is generated) to the actual simulation software KRATOS. The simulation results can be imported back to Revit for visualisation and assessment of the design.
LoDs Project
data
Revit component
classes
Revit & Dynamo Tunnel information model
ACIS geometry
Model parameters
SATBIM Modeller Simulation model
for Tunneling PostProcessing
Customized visualization
Model geometry and FE mesh
Simulation script and BC
KRATOS FE simulation
[image:8.595.74.532.110.314.2]Input/Output Software Decision Results of numerical analysis
Figure 6. Data flow in SATBIM.
The interface between the design and analysis tools is at the heart of the SATBIM system. The interface is responsible for handling the input and output data of the information model, the re-meshing preprocessor GiD, and the simulation software KRATOS. To achieve this, different data formats are exchanged between the three main software packages. The flow of this exchange is illustrated in Fig. 6. The input data for the design process of an actual tunnel project (e.g., with defined alignment, tunnel diameter, materials, semantic data, etc.) along with definitions for the LoD of each component is defined using the Dynamo interface. The remaining process is realised as an automated tool. When pressing theRun button in Dynamo, the model generation and calculation starts without further user interaction or the need for additional assignment of parameters. From the information model generated in Revit, the geometry of the complete model is exported in ACIS format using Dynamo, while the component-specific parameters and semantics are exported as text files using a key-value format. Based on those files,SatBimModellergenerates a set of scripts (so-calledbatch files) for GiD and performs all operations of import and manipulation of the Revit data in order to create an FE model with geometry identical to the TIM. GiD employs a simple scripting language for its batch files that allows for the generation of arbitrary ASCII files. These ASCII files contain all necessary data for the simulation in the form required for the simulation kernel KRATOS. The KRATOS simulation script (further described in Section 3.2.4), which controls the flow of the numerical simulation, also may include a special algorithm to output the results in a customized format, which are then imported by custom Dynamo visualisation nodes and displayed within Revit.
Although the complete workflow normally runs without further user interaction, if required, the user may edit data at any of the intermediate steps and modify some parameters if, based on his/her engineering judgement, this may improve the results (e.g. modifying the FE model for re-meshing).
2.3. Integrated multi-level information model for tunnelling
Soil Lining TBM Building
1
2
3
LoD
1 2
3 4
5
6
a) b)
Figure 7. a) Main components of the urban tunnelling process: 1) soil, 2) lining, 3) TBM, 4) existing infrastructure, 5) grouting, 6) alignment; b) tunnel information model with components modelled on different LoDs: soil, lining, TBM and buildings.
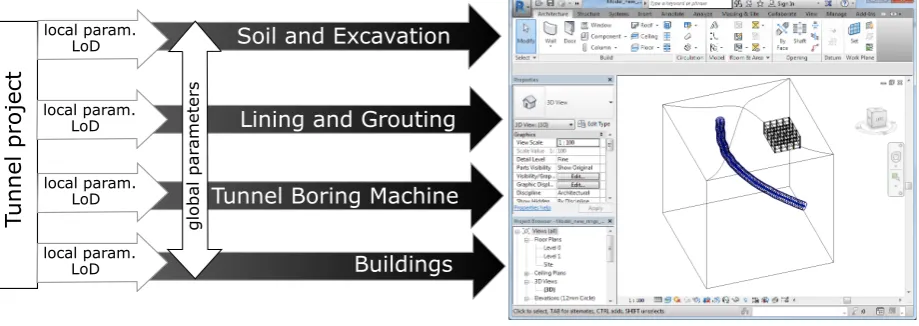
Combining all individual components (lining with its alignment and grouting, soil with excavation, TBM, and buildings), the complete TIM is generated as shown in Fig. 8. For each component, individuallocal parameters (char-acteristic for each individual component) are defined, however, there are also a number of parameters that are shared by multiple components. Those parameters, such as ring lengthLr, excavation radiusrexc, number of steps/slices, overburden, etc., are defined asglobal parameters(see Fig. 8). Based on this data, the simulation model is generated subsequently.
Soil and Excavation
Lining and Grouting
Tunnel Boring Machine
Buildings
gl
obal par
ameters
Tunnel
project
local param. LoD
local param. LoD
local param. LoD
[image:9.595.70.532.99.272.2]local param. LoD
Figure 8. Tunnel information model: combining sub-models based on their local and global parameters leading to a fully parametric tunnel information model.
Data export and exchange. In order to generate the simulation model for tunnelling with identical geometry, material and process parameters, the generated TIM is exported by newly developed Dynamo nodes. The geometry of all individual components is exported in ACIS format. Each volume of each individual component is exported separately in order to enable the flexible manipulation of those volumes when assigning custom layer entities needed for the numerical simulation. The model semantics are exported to text files for each component separately, containing the local parameters, together with one main file containing the global parameters. These text files use a straightforward key-value syntax (one key-value pair per line) with the formkey: value\n\r.
[image:9.595.72.532.412.575.2]3. Multi-level simulation model for the soil-structure interactions in tunnelling
In the planning and the design phase, various analyses are carried out to gather information on a specific project. In case that different design variants for a project are to be investigated, the generation of different numerical models is needed, which often leads to a significant amount of manual work. Thus, the model generation becomes the bottleneck of efficiency. To enable efficient investigation of design alternatives,SatBimModelleris developed to generate numerical models based on the multi-level TIM in a highly automated way. As previously explained, the numerical model is compatible to the information model in terms of geometrical representation as well as semantic data, preserving the level-based structure. In the following, the numerical models, the procedure of automated model generation and the visualisation of numerical results are described in detail.
3.1. Model components and dependencies
In Section 2.3, the components of the multi-level tunnel information model are presented. Here, the same compo-nents are introduced, however in the context of numerical models for analysis and assessment of the design.
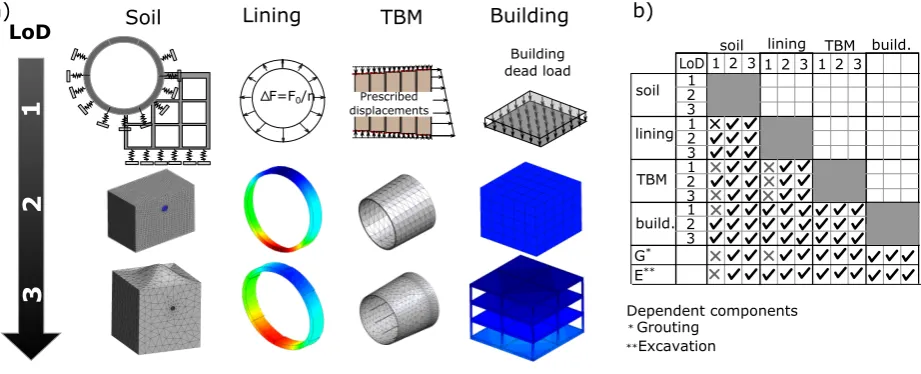
Numerical models for tunnel components on different LoDs. Figure 9a illustrates the numerical models for tunnel components equivalent to the corresponding information models shown in Fig. 7b. On LoD 1, the soil is modelled applying a non-structural model (using the subgrade reaction method), while on LoD 2 and 3, structural elements are used: the geometry is a substitute soil domain for LoD 2, while for LoD 3, detailed geometry is imported in a CAD format. On both LoD 1 and 2, a two (three)-phase soil model for fully (partially) saturated soils is applied [35]. The numerical models again follow a multi-level structure (LoD 1: linear elastic model, LoD 2: Mohr-Coulomb model; LoD 3: Clay and Sand Model (CASM) [36]).
For the tunnel structure on LoD 1, a non-structural model (volume loss method [37]) is applied. On LoD 2, the tunnel lining is represented with structural rings installed step by step, while on LoD 3, the lining ring consists of individual segments. On LoD 3, in the simulation model, the lining structure is installed segment-wise.
On LoD 1, the TBM is modelled with a displacement control approach [38]; on LoD 2 as a solid deformable body interacting with the soil through the contact interface, while on LoD 3, a more detailed structural model is implemented and the TBM is advanced by elongation of hydraulic jacks controlled with a steering algorithm [39].
Finally, for the built environment, in case of the simplest representation (LoD 1), buildings are modelled with a substitute dead load acting on the soil surface, and therefore neglecting the soil-structure interaction effects. Proper structural models are used on LoD 2 and LoD 3, where either a substitute [40] or a detailed structural model, re-spectively, as well as the interface between the foundations and the soil is implemented to properly consider the soil-structure interaction effects.
Dependencies between components on different LoDs. While the main components of the tunnel system (soil, lining, TBM and grouting) are modelled considering different LoDs, grouting and excavation are defined as dependent struc-tural components. Their existence in the model depends on the selected LoDs for the lining and soil, respectively. Furthermore, the dependent components are modelled considering a single LoD. The table in Fig. 9b shows how dif-ferent main components on difdif-ferent LoDs, as well as dependent components, can be combined together. ×denotes the non-meaningful combinations.
To exemplify how these possible combinations were derived, consider modelling the soil on LoD 1 (soil is repre-sented with elastic springs) and the lining on LoD 1 (volume loss method) as well. In this case, both soil and lining geometry do not exist—they are described with parameters only. An alternative for this combination would be the im-plementation of an analytical model for determination of tunnelling-induced surface settlements and structural forces in lining based on model parameters [1, 41] .
3.2. Fully automated modellerSatBimModeller
Soil Lining TBM Building
Prescribed displacements
F=F0/n
1
2
3
LoD
Building dead load
soil
lining
TBM
build.
LoD soil lining
1 2 3 TBM build.
G*
E**
1 2 3 1 2 3 1
2 3 1 2 3 1 2 3 1 2 3
Dependent components
* **
Grouting Excavation
[image:11.595.69.530.110.297.2]a) b)
Figure 9. Consistent information and numerical modelling on different LoDs. a) Numerical models for soil, lining, TBM and building based on information models at different LoDs (see Fig. 7a); b) dependencies between numerical models on different LoDs w.r.t. possibility to combine components into compatible numerical models.
process model input generated by industry-standard software (Revit), leaving as little work (and therefore little room for human error) as possible for the user.
A second important aspect of software efficiency is the ease with which the software can be maintained and extended. Therefore, the software ofSatBimModelleris organised in a highly modular way to offer flexibility not only for further extensions, but also to adapt to any changes in the simulation software. This not only facilitates debugging, but also allows to use a large part of the complete modeller’s functionality even for situations where fully automatic model generation is infeasible (e.g., if numerical models need to be modified to overcome numerical issues or to consider special boundary conditions). Therefore,SatBimModellercan also be employed as a collection of tools for assistance in model generation for a large variety of situations, in addition to being a fully automatic software for a more restricted scope of situations.
3.2.1. Program structure
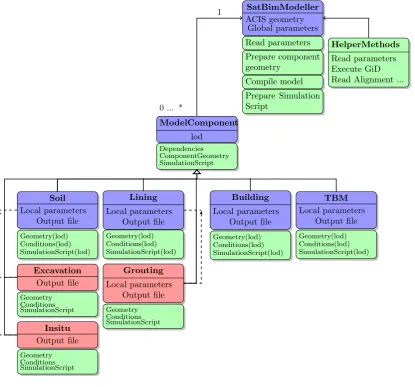
SatBimModelleris realised as a set of Python scripts, which are used to generate models both for particu-lar components on a particuparticu-lar LoD as well as the assembled global simulation model together with the KRATOS simulation scripts. SatBimModellergenerates a number of batch files that are used to control the GiD prepro-cessor for generation of the FE mesh. These batch files contain all instructions necessary to read and generate the geometry, apply the boundary conditions and generate the mesh. To provide flexibility in terms of model generation, and to allow for further changes and extensions,SatBimModelleris implemented following a modular structure (see Fig. 10). The main class isSatBimModeller. It contains the methodsReadParams(),InvokeGiD(), Run(), CompileSystem() and CreateSimulationScript(). These methods implement the complete SATBIM workflow (cf. Section 2.2.5), interfacing Revit, KRATOS, and GiD. The individual components (soil, lining, grouting, building) are defined as classes inherited from the abstract classModelComponent.ModelComponent defines the methodsReadParams(),PrepareModel()andAddToSimulationScript(), which are im-plemented in the derived sub-classes. The methods inSatBimModelleriterate over each component and call the appropriate functions to add the “contribution” of an individual component to the overall model. When initialising and executingSatBimModeller, the following steps are performed:
• Create the model directory,
• read global parameters,
• establish dependencies between model components,
• prepare geometry of each component and compile system
• create KRATOS simulation script,
SatBimModeller ACIS geometry
Global parameters
Read parameters Prepare component geometry
Compile model Prepare Simulation Script
HelperMethods Read parameters Execute GiD Read Alignment ...
ModelComponent lod
0 ... *
Dependencies ComponentGeometry SimulationScript
Lining Local parameters
Output file
Geometry(lod) Conditions(lod) SimulationScript(lod)
Building Local parameters
Output file
Geometry(lod) Conditions(lod) SimulationScript(lod)
TBM Local parameters
Output file
Geometry(lod) Conditions(lod) SimulationScript(lod)
Grouting Local parameters
Output file
Geometry Conditions SimulationScript
Soil Local parameters
Output file
Geometry(lod) Conditions(lod) SimulationScript(lod)
Excavation Output file
Geometry Conditions SimulationScript
Insitu Output file
Geometry Conditions SimulationScript
[image:12.595.93.509.115.502.2]1
Figure 10. Object model forSatBimModeller.
• run the numerical model in KRATOS, and
• output simulation results in the appropriate format.
3.2.2. Input parameters
The model is generated based on geometry as well as global and local (component) parameters exported from the TIM using a custom Dynamo node to the model directory defined by the parametermodel path. The files ACIS/component name,parameters/main model.datandparameters/component name.dat(for each component) are written, respectively.
It is important to mention that the LoD is stored as a local parameter for each component and than dependen-cies between different components are defined in the central classSatBimModeller. Material parameters are stored inparameters/matfile.dat, while process data is stored inparameters/semantic.dat. The coordinates of the calculated tunnel alignment are stored inparameters/alignment.dat. These parameters (related to geometry) subsequently facilitate the definition of boundary conditions in the simulation model through SatBimModeller.
Listing 1. Preparation of individual components of the model and compilation of the system # P r e p a r e m o d e l s f o r a l l m o d e l c o m p o n e n t s
p r i n t ” Run : P r e p a r i n g model c o m p o n e n t s . . . ”
f o r c o m p o n e n t i n s e l f . m o d e l c o m p o n e n t s : # P r e p a r e m o d e l
o u t p u t p a t h = s e l f . w o r k i n g d i r + s e l f . p a r a m s [ ’ model name ’ ] + ” ” + c o m p o n e n t . c o m p o n e n t n a m e + ” . bch ”
# Open f i l e
b c h h a n d l e = open( o u t p u t p a t h , ’w ’ )
# P r e p a r e c o m p o n e n t
c o m p o n e n t . P r e p a r e M o d e l ( b c h h a n d l e )
# C l o s e f i l e b c h h a n d l e . c l o s e ( )
# I n v o k e GID
s e l f . InvokeGID ( o u t p u t p a t h )
# C o m p i l e a l l m o d e l c o m p o n e n t s i n t o s i m u l a t i o n m o d e l s e l f . C o m p i l e S y s t e m ( )
simulation model.
3.2.3. Generation of finite element model
For each component, a dedicated Python class is implemented that contains methodsPrepareModel LodX() to generate specific batch files for GiD for the respective LoDX. For the structural components (soil, lining, TBM and building), the LoD handler decides whichPrepareModel LodX()method to call depending on the local variable lod. On the other hand, the dependent components (excavation, insitu, and grouting) are defined on only one LoD, and are called based on defined dependencies. When executing theSatBimModellermethodRun(), after reading the global parameters and establishing the dependencies between components, the individual models are prepared and then compiled to a complete simulation model as shown in Listing 1.
For each individual component, inPrepareModel(), the respectivePrepareModel LodX()for the se-lected LoD is called. There, the following tasks are executed in order to define the processes for GiD through batch files:(i)read local parameters and assigned LoD,(ii)insert geometry and assign layers to entities,(iii)prepare material file,(iv)prepare boundary condition file, and(v)compile system.
In theCompileSystem()method, all individual components are exported into the filemodel name system, and all material parameters and boundary conditions are assigned. GiD is invoked in silent command-line mode and executes the written batch files. Finally, the FE mesh is generated. Executing theCalculateModel()GiD method, ASCII files that contain all necessary data for the simulation, including the mesh information, boundary and initial conditions, material properties, and model parameters are generated in a form that can be read by KRATOS.
3.2.4. Generation of simulation scripts
To assign all boundary conditions representing different construction phases and control the simulation workflow, a separate Pythonsimulation scriptis generated. This script serves as the interface between the FE model and the simulation software, providing a customised setup of the kernel and preparing the model for the simulation. This script is designed as an own module that defines all necessary functions needed for the simulation workflow, containing the actual FE model as an object. In the simulation script, the functionsSolve() andWriteOutput() are called to solve the model and write the results to disk. However, there are also a number of different functions to assign boundary conditions (loads, displacements, contact interfaces, deactivation, activation, etc.) to each individual component in order to simulate the tunnel excavation process [39].
Depending on the LoD of each component and the mutual dependency between components, different simula-tion models are generated and each of them requires a special part in the simulasimula-tion script. Therefore, each com-ponent class contains the methodAddToSimScript() for each LoD where the “contribution” of the respective LoD of the component is added to the base simulation script calledSimulationTemplate.py(see Listing 2) . SimulationTemplate.pycontains the basic initialisation of the simulation software kernel. With the additions
Listing 2. Add contribution of each component to simulation script s e l f . C r e a t e S i m u l a t i o n S c r i p t ( )
f o r c o m p o n e n t i n s e l f . m o d e l c o m p o n e n t s : # W r i t e s i m u l a t i o n s c r i p t m o d e l
o u t p u t p a t h = s e l f . w o r k i n g d i r + s e l f . p a r a m s [ ’ model name ’ ] + ” s i m u l a t i o n . py ”
# Open f i l e
b c h h a n d l e = open( o u t p u t p a t h , ’ a ’ )
# Add c o m p o n e n t c o n t r i b u t i o n t o s i m u l a t i o n s c r i p t c o m p o n e n t . A d d T o S i m S c r i p t ( b c h h a n d l e )
# C l o s e f i l e b c h h a n d l e . c l o s e ( )
from the individual components, the final simulation scriptmodel name simulation.pyis generated. Executing this script, the numerical analysis is performed by KRATOS.
3.3. Visualisation of numerical results
The visualisation of “raw” numerical analysis output (e.g., simulation results stored in each node or Gauss point of the FE model) might not be efficient in order to draw conclusions about phenomena occurring during tunnel construction.
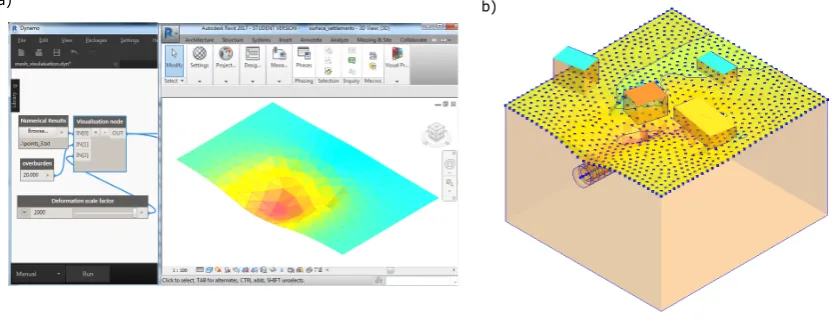
Therefore, these results are processed by a user-defined evaluation algorithm. As an example, an algorithm can be applied that searches and processes the stresses in buildings and returns the risk of damage of structures due to tunnelling in a simplified way. To enable this, a new visualisation method was developed within the SATBIM project. With this approach, the results of the numerical simulations (e.g., settlements) and their impact on the existing envi-ronment (e.g., structural forces, risk of damage) can be visualised within the multi-level TIM to enable comprehensive, intuitive, and quick understanding of effects of design actions on the stability and safety of the existing environment or the tunnel itself.
[image:14.595.89.506.460.619.2]a) b)
Figure 11. Visualisation of numerical results in the design software Revit, i.e., tunnelling induced effects: a) surface settlements; b) effect on buildings.
non-experts, which may be involved in the decision process of the project development. Besides surface settlements, the risk on existing infrastructure is also visualised as shown in Figure 11b, where the buildings are sorted in relative scale from green (safe) to red (in risk) based on the tunnel excavation influence.
Alternatively, if the user needs to access the detailed results of the analysis, this data is stored in result files and can be visualised in the post-processing module of GiD. Then, results such as displacements, stresses, or internal variables can be easily illustrated. Also, the construction sequence (TBM moving forward) can be animated.
3.4. Real-time optimization
In order to apply numerical simulations as a tool for real-time design optimisation, we can substitute numerical simulations with computationally cheap meta models. To enable real-time predictions of tunnelling-induced surface settlements, meta models are trained a priori from the process-oriented simulation model based on the multi-level TIM. For the generation of meta models, i.e., learning of numerical results, Artificial Neural Networks (ANN) [42, 7] are applied here.
x1
xn xi
o1
ok Design alternatives Structural response Trained metamodel
Multi-level TIM Numerical analysis Meta model -> Dynamo -> Revit
Real-time prediction SatBim Model ler Custom o utout Meta model parameters
[image:15.595.72.525.281.435.2]Trained meta model Meta model predction
Figure 12. Scheme of the real-time prediction for design optimisation within the TIM.
Figure 12 illustrates a way of using the simulation-based meta models for real-time optimisation of the design. Based on different design alternatives of the tunnel project, characterised with particular design parameters, simulation models are generated and executed usingSatBimModeller. The simulation results are stored in a format suitable for meta model training. The training time is optimised using Particle Swarm Optimisation (PSO) [7]. The trained ANN with adjusted free parameters (connecting weightswijand biasθj) is then implemented as a Dynamo node for direct prediction of tunnelling-induced effects (ok(x,w)) within Revit for the investigated design parameters (xi) and observed ranges (see Eqn. 1).
ok(x,w)=f
m X
j=1 wjkf
n X
i=1
wijxi+θj
(1)
Combining the already implemented visualisation nodes (see Section 3.3) with the meta model prediction, the real-time assessment of design alternatives is enabled. It has to be noted that the meta models are able to predict the structural response not only for the trained set of parameters, but also interpolate between the defined ranges, and therefore allow for fine-grained assessment of the design.
4. Numerical examples
In this section, examples are presented to practically demonstrate the concept of integrated simulation and nu-merical modelling on different LoDs for design assessment. In the first example, we show the importance of the selected LoD in numerical modelling, while in the second example, the complete workflow of the SATBIM project is demonstrated, where the final design is assessed in Revit based on meta models.
4.1. Example 1: consideration of different LoDs in numerical models
Solid ring and segmented ring representation. The first example (cf. Fig. 13) shows the difference in deformation of the tunnel lining between LoD 2 and LoD 3, using a subgrade reaction model, the simplest possible representation (LoD 1) for the soil. In the subgrade reaction model, the soil is represented by infinitely thin, uncoupled springs with stiffnessKs[43] on the outer boundary of the lining. Moreover, the initial soil stresses, depending on soil properties, tunnel depth, and water pressures are applied as surface loads acting perpendicular to the outer surface highlighted in Fig. 13a.
Ks= E
r
1−ν
(1+ν)(1−2ν) (2)
longitudinal joints transversal joints
b)
lining_outer_surface_n
LoD2 LoD3
a)
TIM FEM geometry TIM FEM geometry
Disp. Z [mm]
2.0
[image:16.595.70.532.201.389.2]-1.5
Figure 13. a) Lining LoD 2: solid model and lining LoD 3: rings consist of segments, bedded on elastic springs (soil LoD 1 in both cases); b) vertical displacements for the two different model.
Although in both cases (lining LoD 2 and LoD 3), the same NEUMANand DIRICHLETboundary conditions are applied, the response (Fig. 13b) of the lining modelled as a solid shell (LoD 2) is stiffer than of the lining modelled with segmented rings (LoD 3). This behaviour is expected due to presence of joints in the lining model on LoD 3 and due to the relative displacement between the segments.
The orientation of the joints is tested in this implementation, and it has to be noted that the distribution of joints (rotated) gives a significantly stiffer response compared to aligned segment joints, which is in agreement with the findings in [6]. Moreover, while the detailed modelling of lining rings is required for detailed lining design, the choice between lining on LoD 2 and LoD 3 does not make a significant difference when calculating tunnelling-induced settlements, as shown in the Appendix in Figure 18.
Tunnel construction under existing building modelled on different LoDs. In the second example, the LoD of a building is varied from LoD 1 (dead load from building weight acting on the soil surface) over LoD 2 (reduced models with a substitute elastic stiffnessE, heightHand weightρcomputed according to an approach proposed in [40]) to LoD 3 (full structural frame model), cf. Fig. 14a. As a simple representation of shield tunnelling, i.e., confinement and support by lining without explicit modelling of the lining structure, the volume loss method is implemented. For this method, the confinement is described with the volume loss coefficient Vl = (V0−Vdef)/V0 · 100%. In the implementation of the volume loss method, after the deconfinement, the deformed area of the tunnel is continuously calculated at each computation cycle, and deformations of the excavation boundaries are fixed when the volume loss value of the tunnel boundary is reached [37].
Settlem
ents [m
m
]
-12 -10 -8 -6 -4 -2 0 2
-60 -40 -20 0 20 40 60 Distance from the centerline [m]
[image:17.595.73.530.108.262.2]Building LOD3 Building LOD2 Building LOD1 a) building LoD1 building LoD2 building LoD3 b)
Figure 14. Effect of different LoDs for building on surface settlements using the volume loss method: a) geometry and vertical displacements; b) surface settlements.
4.2. Example 2: instant prediction of the soil-structure interaction using simulation-based meta models
In this example, SATBIM is applied for a (synthetic) example of design assessment of the tunnel alignment alternatives in the vicinity of existing infrastructure. The tunnel is connecting pointsAandBas illustrated in Fig. 15b. The design question is the optimal tunnel alignment and tunnel depth w.r.t. risk induced on the existing building. To this end, 25 TIM models for the given problem were generated considering five different alignment alternatives and five overburdens (see Fig. 15b). The representation adopted for this model is: soil on LoD 2, lining on LoD 1, TBM on LoD 0 (see dependency), and building on LoD 3. A possible resulting model is illustrated in Fig. 15a.
Top view
X Y
Y Z Side view
A
B
0.5 1 1.5 2 2.5 Overburden [D]
D
a) b)
Figure 15. a) TIM for investigation of alignment design alternatives; b) design alternatives in terms of different alignment from pointAto pointB
and depth of tunnel w.r.t. foundation of the existing building.
The 25 information and numerical models combining two parameters (alignment alternative and overburden) are generated with minimum efforts, since, as explained previously, the multi-level TIM is fully parametrized and the simulation model generation is fully automated. The simulation models are then executed in parallel on a computing node with 32 processors (two simulations at a time, each using 16 threads), taking advantage of a shared memory implementation based on openMP. The total calculation time was approximately 11 h. The simulation results (surface settlements and deformation of the building top) are output in a form suitable for subsequent training of the ANN. The meta models were trained with an overall relative Root Mean Square (rRMSE) accuracy of 4.2 %. The trained ANN (adjusted synaptic weights) is imported into Revit/Dynamo, or the design environment, and the forward model is executed by the respective Dynamo node as explained in Section 3.4. Figure 16 shows the surface settlements and deformation of the building based on meta model predictions using the visualisation algorithms implemented in Dynamo. When looking at the top of the building, it is clear how the influence of the tunnel excavation changes from
[image:17.595.72.533.414.556.2]Meta model parameters Meta model parameters Meta model parameters Meta model parameters Meta model parameters
Figure 16. Real-time assessment of the soil-structure interaction w.r.t. tunnel alignment solution in TIM.
negative (red) to significantly improved (green) by setting the alignment to pass around the building (alternative 5) and by increasing the tunnel depth. It is possible to visualise this in real-time by setting the parameters (using a slider user interface) describing the geometry of the alignment in the Dynamo window shown in Fig. 16.
Figure 17. Real-time assessment of the design alternatives in terms of soil-structure interaction effects on multi-user multi-touch video wall . Utilizing the latest technology like a multi-touch multi-user video wall ( Fig. 17), the design alternatives can be evaluated directly to support design, collaboration and decision making in important meetings, for example with investors.
5. Conclusions
To ensure optimal solutions from early stages of the project planning up to final design adaptations during the construction, different design alternatives have to be considered. Nowadays, the associated design process can be cumbersome and requires significant manual intervention of experts. Moreover, when analyses on different scales are required (from kilometre to centimetre), if not considered properly, compatibility might become an issue.
[image:18.595.183.413.341.530.2]practical, yet flexible and user-friendly generation of the tunnel structure for arbitrary alignments on different LoDs. The major novel aspects of this concept are:
Unified platform for multi-level information and numerical modelling , and visualisation: The multi-level infor-mation model for tunnelling is developed using the industry-standard tools Revit and Dynamo, allowing for consistent parametric modelling on different LoDs. The resulting TIM serves as a basis for the generation of numerical models for soil-structure interaction in tunnelling using the developedSatBimModeller. The numerical models are subsequently simulated in KRATOS, an open-source platform for FE simulation.
Modular structure: The SATBIM software is organized in a modular way to provide high flexibility not only for further extensions, but also for adaptation to any changes in the simulation software.
Assessment of structural response in BIM: SatBimModellerallows to generate simulation output in a form which can be imported back into Revit for visualisation of the soil-structure interaction effects induced by tunnelling. The simulation results are visualised within the TIM to enable comprehensive, intuitive and quick understanding of effects of design actions on the stability and safety of the tunnel and the existing environment.
Real-time design optimisation: SATBIM allows for conducting real-time analyses of a complex and computation-ally demanding problem to enable on-demand numerical predictions and optimisations. The real-time prediction is enabled by substituting numerical simulations with computationally cheap meta models. The design process and optimisation is integrated within a state-of-the-art design environment, avoiding the pitfalls of traditional pre and post-processing workflows.
The previously mentioned aspects lead to efficient modelling in terms of time and costs by: (i)minimisation of the efforts needed for model generation;(ii) representation on different LoDs leading to computationally efficient simulations;(iii)effective visualisation of the simulation results; and(iv)the possibility for real-time optimisation of the design.
The practical examples presented in this paper demonstrate the new possibilities offered by our unified platform. In all examples, the generation of the design and the numerical analysis is fully automated, leading to minimum efforts for the user to investigate alternative solutions. In the first example, the importance and the difference in the numerical predictions for different LoDs are highlighted. Depending on the objective of the analysis, different combinations of the components’ LoDs can be adopted, minimising the communicational effort.
In the second example, it has been shown how the SATBIM platform can be used for real-time design assessment within the BIM tool Revit using meta models. The choice of the tunnel alignment and tunnel depth can be dynamically adjusted to minimise the tunnelling-induced effect on an existing building. In this example, the effort of generating the alternatives is minimised by usingSatBimModeller.
The computing time for design alternatives is determined by the available computational resources. This implies that, although in most steps the effort for performing the analysis is minimised, the total time for completing the workflow mainly depends on computing time. However, those tasks are part of the preparation phase, and the final output, the real-time assessment of design alternatives, is aimed to be used at meetings to support decision making. Moreover, if the visualisation is performed in advanced environments like a multi-user multi-touch video wall, this by all means can facilitate and support design, collaboration, and decision making in engineering.
The SATBIM framework will be further extended in terms of definition of the level-based structure, improvement of the computational efficiency and development of methods for design assessment. To this end, connecting this open-source framework with recent advances in computational modelling, the following extensions are under development:
• Extending the component description to LoD 0, implementing analytical and empirical solutions for structural response to tunnelling (settlements, soil-structure interaction with foundations, lining forces, face stability, etc).
• Integration of IGA into the SATBIM framework for modelling of tunnel linings to make direct use of the B-rep geometries generated in the BIM for definition of numerical models [14].
• Application of parallelisation strategies to perform large-scale simulations to decrease the computational ef-forts [44].
• Development of a methodology for evaluation the reliability of the prognosis based on uncertainties of the numerical models w.r.t. adopted LoDs and important model parameters. [45].
Note that this paper presents a framework for maximum automation of structural behaviour assessment in tun-nelling from the early stages of the design to construction. A more detailed evaluation of the importance of modelling on different LoDs and the compatibility of the results will be presented in a follow-up publication. The SATBIM toolkit will be made available as open source software together with tutorials, a complete manual, and a number of benchmark examples. The project’s Github repository (not yet public) can be found at:
https://github.com/satbim
Acknowledgements
This project has received funding from the European Union’s Horizon 2020 research and innovation programme under the Marie Sklodowska-Curie grant agreement No 702874 “SATBIM — Simulations for multi-level Analysis of interactions in Tunnelling based on the Building Information Modelling technology”. This support is gratefully acknowledged.
References
[1] R. Peck, Deep excavations and tunnelling in soft ground, in: 7th International Conference on Soil Mechanics and Foundation Engineering Mexico City, 1969, pp. 225–290.
[2] H. D. Morgan, A contribution to the analysis of stress in a circular tunnel, Geotechnique 11 (1).
[3] J. Burland, C. Wroth, Settlement of buildings and associated damage, in: Conference on Settlement of Structures, 1975.
[4] K. Komiya, Fe modelling of excavation and operation of a shield tunnelling machine, Geomechanics and Tunneling 2 (2) (2009) 199–208. [5] G. Meschke, J. Nini´c, J. Stascheit, A. Alsahly, Parallelized computational modeling of pile-soil interactions in mechanized tunneling,
Engi-neering Structures 47 (2013) 35 – 44.
[6] N. Do, D. Dias, P. Oreste, I. Djeran-Maigre, Three-dimensional numerical simulation for mechanized tunnelling in soft ground: the influence of the joint pattern, Acta Geotechnica 9 (4) (2014) 673–694.
[7] J. Nini´c, G. Meschke, Model update and real-time steering of tunnel boring machines using simulation-based meta models, Tunnelling and Underground Space Technology 45 (2015) 138 – 152.
[8] F. Zobl, R. Marschallinger, Subsurface geo building information modelling geobim, GEO Informatics 11, 2008.
[9] C. Koch, F. Hegemann, M. K¨onig, Tunnel information modelling to support interactions in mechanized tunneling, in: Proc. of the 32nd CIB-W78 Conference on Information Technology in Construction, Eindhoven, The Netherlands, 2015.
[10] A. Borrmann, M. Flurl, J. R. Jubierre, R. P. Mundani, E. Rank, Synchronous collaborative tunnel design based on consistency-preserving multi-scale models, Advanced Engineering Informatics 28 (4) (2014) 499 – 517.
[11] L. Svoboda, J. Nov´ak, L. Kurilla, J. Zeman, A framework for integrated design of algorithmic architectural forms, Advances in Engineering Software 72 (2014) 109 – 118.
[12] N. Nawari, M. Kuenstle, Building Information Modeling: Framework for Structural Design, ISBN 978-1-4822-4043-6, CRC Press, 2015. [13] J. Cottrell, T. Hughes, Y. Bazilevs, Isogeometric Analysis, Wiley, 2009.
[14] M. Breitenberger, R. W¨uchner, K.U. Bletzinger, Design and Analysis of Curved Precast Concrete Components Using CAD-based Approaches to build lightweight structures in the future, Beton- und Stahlbetonbau 108 (11) (2013) 783 – 791.
[15] M. Breitenberger, A. Apostolatos, B. Philipp, R. W¨uchner, K.U. Bletzinger, Analysis in computer aided design: Nonlinear isogeometric B-Rep analysis of shell structures, Computer Methods in Applied Mechanics and Engineering 284 (2015) 401–457.
[16] B. Philipp, M. Breitenberger, I. D’Auria, R. W¨uchner, K.U. Bletzinger, Integrated design and analysis of structural membranes using the Isogeometric B-Rep Analysis, Computer Methods in Applied Mechanics and Engineering 303 (2016) 312 – 340.
[17] G. Meschke, S. Freitag, A. Alsahly, J. Nini´c, S. Schindler, C. Koch, Numerical Simulation in Mechanized Tunneling in Urban Environments in the Framework of a Tunnel Information Model, Bauingenieur 89 (11) (2014) 457–466.
[18] J. Nini´c, S. Freitag, G. Meschke, A hybrid finite element - surrogate modelling approach for simulation and monitoring supported TBM steering, Tunnelling and Underground Space Technology 63 (2017) 12–18.
[19] J. Amann, A. Borrmann, F. Hegemann, J. Jubierre, M. Flurl, C. Koch, M. K¨onig, A refined product model for shield tunnels based on a gen-eralized approach for alignment representation, in: Proc. of the 1st International Conference on Civil and Building Engineering Informatics, 2013.
[20] U. Maidl, J. Stascheit, Real time process controlling for EPB shields / Echtzeit-Prozesscontrolling bei Erddruckschilden, Geomechanics and Tunnelling 7 (1) (2014) 64–71.
[21] P. van Oosterom, V. Schenkelaars, The development of an interactive multi-scale GIS, International Journal of Geographical Information Systems 9 (5) (1995) 489–507.
[22] A. Forberg, Generalization of 3D building data based on a scale-space approach, Journal of Photogrammetry and Remote Sensing 62 (2) (2007) 104 – 111, including Special Section:Young Author Award.
[23] J. Xie, L. Zhang, J. Li, H. Wang, L. Yang, Automatic simplification and visualization of 3D urban building models, International Journal of Applied Earth Observation and Geoinformation 18 (1) (2012) 222–231.
[24] F. Biljecki, H. Ledoux, J. Stoter, An improved LoD specification for 3D building models, Computers, Environment and Urban Systems 59 (2016) 25 – 37.
[26] AUTODESK, Autodesk Revit, http://www.autodesk.co.uk/products/revit-family/ (2017). URLhttp://www.autodesk.co.uk/products/revit-family/
[27] M. Jezyk, the Dynamo Development team at Autodesk, The Dynamo Primer. V.1.1.0, AUTODESK, http://dynamoprimer.com/ (2016). URLhttp://dynamoprimer.com/en/
[28] BENTLEY, Bentley MicroStation, https://www.bentley.com/en/products/product-line/modeling-and-visualization-software/microstation (2017).
URL https://www.bentley.com/en/products/product-line/modeling-and-visualization-software/ microstation
[29] BENTLEY, Bentley GenerativeComponents, https://www.bentley.com/en/products/product-line/modeling-and-visualization-software/generativecomponents (2017).
URL https://www.bentley.com/en/products/product-line/modeling-and-visualization-software/ generativecomponents
[30] GRAPHISOFT, GRAPHISOFT ARCHICAD, http://www.graphisoft.com/archicad/ (2017). URLhttp://www.graphisoft.com/archicad/
[31] GRAPHISOFT, Rhino-Grasshoper-ARCHICAD toolset, http://www.graphisoft.com/archicad/rhino-grasshopper/ (2017). URLhttp://www.graphisoft.com/archicad/rhino-grasshopper/
[32] CIMNE International Center for Numerical Methods in Engineering, GiD: the personal pre- and postprocessor (2017). URLhttp://www.gidhome.com/
[33] International Center for Numerical Methods in Engineering (CIMNE), Kratos – multi-physics., website Edition (2016). URLhttp://www.cimne.com/kratos/
[34] P. Dadvand, R. Rossi, E. O˜nate, An object-oriented environment for developing finite element codes for multi-disciplinary applications, Archives of Computational Methods in Engineering 17 (2010) 253–297.
[35] F. Nagel, G. Meschke, An elasto-plastic three phase model for partially saturated soil for the finite element simulation of compressed air support in tunnelling, International Journal for Numerical and Analytical Methods in Geomechanics 34 (2010) 605–625.
[36] H. Yu, CASM: a unified state parameter model for clay and sand, International Journal for Numerical and Analytical Methods in Geome-chanics 48 (1998) 773–778.
[37] N.-A. Do, D. Dias, P. Oreste, I. Djeran-Maigre, 2D tunnel numerical investigation: The influence of the simplified excavation method on tunnel behaviour, Geotechnical and Geological Engineering 32 (1) (2014) 43–58.
[38] V. Founta, J.Nini´c, A. J. Whittle, G. Meschke, J. Stascheit, Numerical simulation of ground movements due to EPB tunnelling in clay, in: EURO:TUN 2013, 3rd International Conference on Computational Methods in Tunneling and Subsurface Engineering, Ruhr University Bochum, 2013, pp. 97–108.
[39] J. Stascheit, Parallelisation and model generation methods for large-scale simulations of shield tunnelling processes, Ph.D. thesis, Ruhr-Universit¨at Bochum (2010).
[40] S. Schindler, P. Mark, Evaluation of building stiffness in the risk-assessment of structures affected by settlements., in: Proc. 3rd Int. Conf. on Comp. Meth. in Tunneling and Subsurface Engineering - EURO:TUN 2013, RUB, Bochum, Germany, 2013, pp. 477–486.
[41] A. Bouma, Elasto-statics of slender structures, Ph.D. thesis, Delft University of Technology (1993).
[42] J. Nini´c, J. Stascheit, G. Meschke, Prediction of tunnelling induced settlements using simulation-based artificial neural networks, in: Y. Tsom-panakis, B. Topping (Eds.), Proceedings of the Second International Conference on Soft Computing Technology in Civil, Structural and Environmental Engineering, Civil-Comp Press, Stirlingshire, Chania, Greece, 2011, p. paper 26, cD-ROM.
[43] D. Kolymbas, Geotechnik - Tunnelbau und Tunnelmechanik, Springer, 1998.
[44] H.G. Bui, A. Alsahly, J. Nini´c, G. Meschke, High Performance Multi-level Soil-Structure Interaction Modelling of the Urban Tunnelling Process, in:Proceedings of the Fifth International Conference on Parallel, Distributed, Grid and Cloud Computing for Engineering PARENG, Pecs, Hungary (2017).
[45] S. Freitag, B.T. Cao, J. Nini´c, G. Meschke, Hybrid surrogate modelling for mechanised tunnelling simulations with uncertain data, Interna-tional Journal of Reliability and Safety, 9(2/3) (2015) 154–173.
6. Appendix
Figure 18 shows that the LoD of the lining has insignificant influence on the tunnelling-induced settlements. This is due to fact that the gap between the lining and the soil is refilled with the pressurised grouting and that the soil deformation in the vicinity of the tunnel, as well as displacements which propagate to the soil surface, will be mainly controlled by this factor.
-5 -4 -3 -2 -1 0
-60 -40 -20 0 20 40 60
Settlem
ents [m
m
]
Distance from the centerline [m] Lining LoD3 Lining LoD2
Lining LoD 3 Lining LoD 2
[image:22.595.70.528.198.338.2]Surface settlements for different lining LoDs
Figure 18. The choice of the LoD of the lining structure does not influence significantly the tunnelling induced settlements.
Figure 19 shows that if the building is located far from the tunnel alignment, i.e., far from the influence of the tunnelling-induced displacement, the model used for representation of the building plays no role. The quantification of the factors determining this adequate choice of the building LoD, as well as the LoD of other components, will be the subject of further research. The choice of the lower LoD can significantly reduce the computational costs.
-7 -6 -5 -4 -3 -2 -1 0
-90 -70 -50 -30 -10 10 30 50 70 90
Settlem
ents [m
m
]
Distance from the centerline [m] Building LoD1 Building LoD2 Building LoD3
[image:22.595.71.527.435.579.2]a) building LoD1 building LoD2 building LoD3 b)