Python in Field of Data Science: A Review
Mani Butwall
Assistant Professor Computer Science Department, MIT
Mandsaur
Pragya Ranka
Assistant Professor Computer Science Department, MIT
Mandsaur
Shuchi Shah
Scholar INSOFE, Bangalore
ABSTRACT
Python is a interpreted object oriented programming language which gaining popularity in field of data science and analytics by creating complex software applications. Python has very large and robust standard libraries which are used for analyzing and visualizing the data. Data scientists have to deal with huge amount of data known as big data. With simple usage and a large set of python libraries, Python has become a popular option to handle big data. Python builds better analytics tools which can help data scientist in developing machine learning models, web services, data mining, classification etc. In this paper we will review various tools which are used by python programmers for efficient data analytics and its scope and comparison with other languages.
Keywords
Machine learning, data science, big data
1.
INTRODUCTION
The rapidly growing digital information is moving very fastly over internet infrastructure and the major portion of which is comprises of unstructured data i.e. images, video, audios, blogs, tweets, facebook posts, Google map location and many more. The traditional approaches for handling such complex unstructured enormous amount of data is very challenging for software industry [1]. For such applications like big data, data science, social media analytics and market research the software professional are using python which provided a dynamic standard library set for efficient machine learning and data analytics.
2.
DATA ANALYTICS AND ITS LIFE
CYCLE
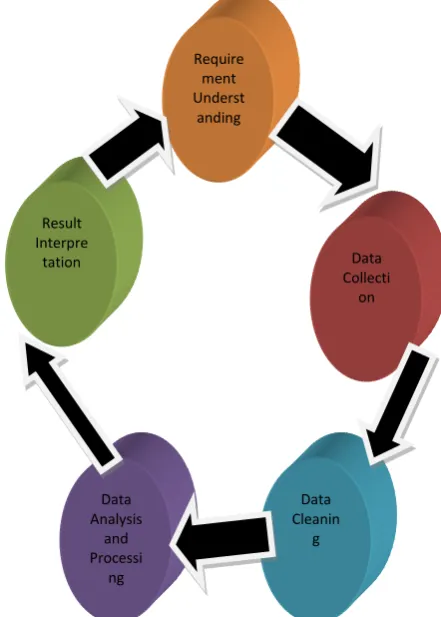
Data analytics is the process and methodology of analyzing data to draw meaningful insight from the data.
A.
Requirement Understanding:-
In this phase weneed to understand the basic requirement of analysis like why we need, its application and basic detail. The process can be long and arduous so we need a road map to do the same.
B.
Data Collection:-
In this phase, wide variety of data sources are identified depending upon the severity of problem. More data resources mean more chances of finding hidden correlations and patterns. Tools are needed to capture keywords, data and information from these heterogeneous data sources. The captured structured and unstructured data need to be stored in databases/ data warehouse. NoSQL databases are needed to accommodate Big Data. Various frameworks and databases have been developed by organizations like Apache, Oracle etc. that allow analytics tools to fetch and process data from these repositories.C.
Data Cleaning:-
This phase is dedicated to removal of replicated, corrupt, null and irrelevant data objects from the gathered information. This stage applies validation rules based on the business case to confirm the necessity and relevance of data extracted for analysis. Although it may be difficult sometimes to apply validation constraints to the extracted data due to complexity. Aggregation helps to combine multiple data sets into fewer numbers based on common fields. This simplifies further data processing.D.
Data Analysis and Processing:-
This stagecarries out actual data mining and analysis to establish unique and hidden patterns for making business decisions. Data analytics technique may vary depending upon the scenario i.e. exploratory, confirmatory, predictive, prescriptive, diagnostic or descriptive.
E.
Result interpretation:-
This phase involves [image:1.595.350.571.420.729.2]representation of analysis results into visual or graphical form that makes it easier to understand for the audience.
Fig 1 Cycle of Data Analysis Process
Data Cleanin
g Data
Analysis and Processi
ng Result Interpre tation
Require ment Underst
anding
Data Collecti
21
3.
DATA MINING TOOLS
Before data mining, the data must be cleaned and processed from their raw state. For the same various tools are available like Microsoft Excel and Google Sheets. But the drawback with this tools is that they can’t be used for large datasets, although can be used for small scale feature engineering [2]
3.2
EDM
EDM is a tool used for automated feature distillation and data labeling. Much of the automated feature distillation functionality of EDM workbench is addressed at specific shortcomings of excel and Sheets for specific tasks of relevance to data scientists, such as the generation of complex sequential features, data sampling, labeling, and the aggregation of data into subsets of student-tutor transactions based on user-defined criteria.[2]. The workbench currently allows learning scientists to [3]
Label previously collected educational log data with behavior categories of interest (e.g. gaming the system, help avoidance), considerably faster than is possible through previous live observation or existing data labeling methods.
Collaborate with others in labeling data.
Automatically distill additional information from log files for use in machine learning, such as estimates of student knowledge and context about student response time (i.e. how much faster or slower was the student’s action than the average for that problem step).
3.3
SQL
SQL, or the Structured Query Language, is used to organize some databases. SQL queries can be a powerful method for extracting exactly the desired data, sometimes integrating (“joining”) across multiple database tables. [2]
SQL can be used by data scientist for basic filtering like generate query from a query, handle dates, text mining, find the medians, load data into your database and generate sequences. [4]
4.
DATA MINING ALGORITHMS FOR
DATA ANALYSIS
Once features have been engineered and structured properly, we need some powerful algorithms to model the collected data for further analysis and feature predictions.
4.1
Rapid Miner:-
RapidMiner can load and analyzeany type of data including both structured and unstructured like text, images and media. It has access to more than 40 file types including SAS,ARFF,Stata and via URL. It provide support for all databases including NOSQL ,MangoDB, Oracle, IBM DB2, Microsoft SQL Server, Postgres,Teradata, Ingres, VectorWise and many more. It also allow access to cloud storage like Dropbox and Amazon3. [5]
4.2
WEKA:-
The Waikato Environment forKnowledge Analysis is a free and open source software package that assembles a wide range of data mining and model building algorithms. Weka has an extensive set of classification, clustering, and association mining algorithms that can be used in isolation or in combination, through methods such as bagging, boosting, and stacking. Users can invoke the data mining algorithms from the command line, a GUI (graphical user interface), or through a Java API. Weka can output the models it generates either in terms of the actual
mathematical models, or in PMML (Predictive Modeling Markup Language) files which can be used to run the model on new data using the Weka scoring plugin to run the model. [3]
4.3
KNIME:-
KNIME(“naim”, KoNstanzInformation MinEr, www.knime.org), formerly Hades, is a data cleaning and analysis package that offers a host of specialized algorithms in areas such as sentiment analysis and social network analysis. An especially powerful aspect of KNIME is its ability to integrate data from multiple sources (e.g. a .csv of engineered features, a word document of text responses, and a database of student demographics) within the same analysis. KNIME also offers extensions that allow it to interface with R, Python, Java, and SQL. [3]
4.4
KEEL:- KEEL, which is a open sourcesoftware tool available under GNU to assess evolutionary algorithms for Data Mining problems of various kinds including as regression, classification, unsupervised learning, etc. It includes evolutionary learning algorithms based on different approaches: Pittsburgh, Michigan and IRL, as well as the integration of evolutionary learning techniques with different pre-processing techniques, allowing it to perform a complete analysis of any learning model in comparison to existing software tools. [6]
4.5
Tableu:-
Tableau is an easy-to-use tool forcreating customized, interactive visualizations. Although Tableau is often discussed in the context of business intelligence, it can also be used to create effective scientific and biomedical visualizations in the context of research, public health, and medical care. Although Tableau’s drag-and-drop interface is more user-friendly and easier to learn than many other visualization tools, effective use of the software does require some practice, as well as familiarity with best practices in data visualization. [7]
4.6
R Language:-
R is an open-source data analysisenvironment and programming language. R consists of numerous ready-to-use statistical modeling algorithms and machine learning which allow users to create reproducible research and develop data products. R has a diverse community, extensible and free software that help in big data processing . R has capabilities to integrate with many other programming languages like C++, Java. It can store objects in hard disc and process it chunk wise. [8]
5.
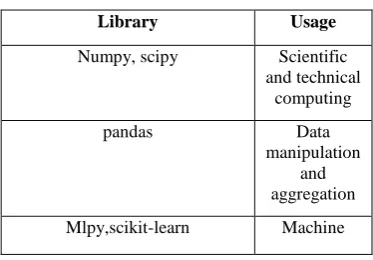
PYTHON FOR DATA ANALYSIS
[image:2.595.335.522.639.769.2]The features of python makes it a perfect fit for data analytics easy to learn, robust, readable, scalable, extensive set of libraries, integration with other languages and active community and support system. Python libraries for data analysis [9]:
Table 1: Python Libraries and its Functions
Library Usage
Numpy, scipy Scientific and technical
computing
pandas Data
manipulation and aggregation
Learning
Theano, tensorflow,keras Deep learning
statsmodels Statistical analysis
Nltk,genism Text processing
networkx Network analysis and visualization
Bokeh,matplotlib,seaborn,plotly Visualization
Beautifulsoup,scrapy Web scraping
5.1 The Top 5 Development Environments
Python provide different editors for different applications. But there are some editors which can be used in the field of data science.[11]
[image:3.595.71.263.70.256.2]5.1.1 Spyder:-
Different of most of IDEs around the web, Spyder was built specifically for data science. Spyder contains features like a text editor with syntax highlighting, code completion and variable exploring, which you can edit its values using a Graphical User Interface (GUI).Fig. 2 Spyder IDE
[image:3.595.317.544.72.239.2]5.1.2 PyCharm:-
PyCharm is an IDE made by the folks at JetBrain, a team responsible for one of the most famous Java IDE, the IntelliJ IDEA. PyCharm integrates its tools and libraries such as NumPy and Matplotlib, allowing you work with array viewers and interactive plots.In addition to Python, PyCharm provides support for JavaScript, HTML/CSS, Angular JS, Node.js, and so on, what makes it a good option for web development. Just like other IDEs, PyCharm has interesting features such as a code editor, errors highlighting, a powerful debugger with a graphical interface, besides of Git integration, SVN, and Mercurial. You can also customize your IDE, choosing between different themes, color schemes, and key-binding. Additionally, you can expand PyCharm’s features by adding plugins.Fig. 3 PyCharm IDE
5.1.3 Thonny:-
The next IDE is Thonny: an IDE for learning and teaching programming. It’s a software developed at The University of Tartu. Among its features, Thonny supports code completion and highlight syntax errors, but it also provides a simple debugger, which you can run your program step-by-step. This is very nice for beginners, as they can step through statements and expressions. While editing a function, a new window is opened with local variables and the code being shown separately from your main code.Fig. 4 Thonny IDE
5.1.4 Atom:-
An open source text editor developed by Github. Although this text editor is available for many popular programming languages such as Ruby on Rails, PHP, Java and so on, Atom has interesting features that create a good experience for Python developers. One of the best advantages of Atom is its community, chiefly due to the constants enhancements and plugins that they develop in order to customize your IDE and improve your workflow. [image:3.595.56.283.372.545.2]23 Fig. 5 Atom IDE
5.1.5 Jupyter:-
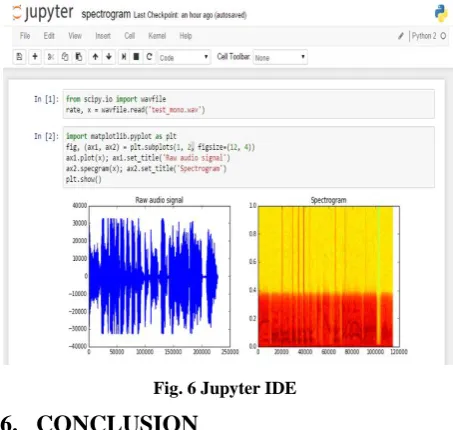
Jupyter Notebook was born out of IPython in 2014. It is a web application based on the server-client structure, and it allows you to create and manipulate notebook documents - or just “notebooks”. Jupyter Notebook provides you with an easy-to-use, interactive data science environment across many programming languages that doesn’t only work as an IDE, but also as a presentation or education tool. It’s perfect for those who are just starting out with data science.The Jupyter Notebook supports markdowns, allowing you to add HTML components from images to videos. We can use data visualization libraries like Matplotlib and Seaborn and show your graphs in the same document where our code is. Besides all of this, you can export your final work to PDF and HTML files, or you can just export it as a .py file. In addition, you can also create blogs and presentations from your notebooks.Fig. 6 Jupyter IDE
6.
CONCLUSION
Python provide various libraries and editors to work efficiently for data analytics. Python is fastest growing language which is rapidly using by data scientist for analysis purpose like You tube, Google and many more. Beyond the mathematical research that Python supports, there are a vast array of computational resources that are at the fingertips of those well versed in Python. Our research group is interested in developing algorithms for modern distributed supercomputers that leverage GPUs to accelerate computations. As one can see, Python is an effective tool for
cutting edge Data Science research. Of course, there are many such tools, and often the specific choice of language for Data Science research is a matter of taste. However, we would respectfully submit that few languages have the broad range of support for Data Science research that Python provides.
7.
REFERENCES
[1] Randy Paffenroth, Xiangnan Kong, Proc. Of the 14th Python in Science Conf. (SCIPY 2015) https://www.youtube.com/watch?v=EUEHOYl0mR “Python in Data Science Research and Education”
[2] Slater, S., Joksimovic, S., Kovanovic, V., Baker, R.S., Gasevic, D. “Tools for educational data mining: a review”
[3] Rodrigo, M. M. T., Baker, R.S.j.D., McLaren, B.M., Jayme, A. & Dy, T.T. (2012). In: K. Yacef, O. Zaïane, H. Hershkovitz, M. Yudelson, & J. Stamper, J. (Eds.) Proceedings of the 5th International Conference on
Educational Data Mining (EDM 2012). (pp. 152-155) “Development of a Workbench to Address the Educational Data Mining Bottleneck”
[4] https://www.mastersindatascience.org/data-scientist-skills/sql/
[5] https://rapidminer.com/products/studio/feature-list/
[6] J. Alcal´a-Fdez1, L. S´anchez2, S. Garc´ıa1, M.J. del Jesus3, S. Ventura4, J.M. Garrell5, J. Otero2, C.Romero4, J. Bacardit6, V.M. Rivas3, J.C. Fern´andez4, F. Herrera1 “KEEL: A Software Tool to Assess Evolutionary Algorithms for Data Mining Problems”
[7] Federer, Lisa M., and Douglas J. Joubert. 2018. "Providing Library Support for Interactive Scientific and Biomedical Visualizations with Tableau." Journal of eScience Librarianship 7(1): e1120. https://doi.org/10.7191/jeslib.2018.1120
[8] Sanchita Patil MCA Department, Vivekanand Education Society's Institute of Technology, Chembur, Mumbai in International Research Journal of Engineering and Technology (IRJET) e-ISSN: 2395 -0056 Volume: 03 Issue: 07 | July-2016 www.irjet.net p-ISSN: 2395-0072 © 2016, IRJET | Impact Factor value: 4.45 | ISO 9001:2008 Certified Journal | Page 78 “Big Data Analytics Using R”
[9] Kang P.Lee ITS-RS/U13 “Introduction to Python Data Analytics” in June 2017 10, RP1
[10] https://www.datacamp.com/community/tutorials/data-science-python-ide
[11] Thirunavukkarasu K1 and Dr.Manoj Wadhawa in International Journal of Computer Science, Engineering and Applications (IJCSEA) Vol.6, No.1, February 2016 “Analysis and Comparisison Study of Data Minimg Algorithms Using Rapidminer”.
[12] Makrufa Sh. Hajirahimova, Marziya I. Ismayilova DOI: 10.25045/jpit.v09.i1.07 Institute of Information Technology of ANAS, Baku, Azerbaijan “Big Data Visualization: Existing Approaches and Problems”.
[image:4.595.54.281.442.657.2]reserved 1012 “A Review Paper on Big Data Analytics Tools”
[14] Kalpana Rangra Dr. K. L. Bansal ,Volume 4, Issue 6, June 2014 ISSN: 2277 128X International Journal of Advanced Research in Computer Science and Software Engineering Research Paper (ijarcsse) “Comparative Study of Data Mining Tools”
[15]Anmol Bansal and Dr. Satyajee Srivastava et al. International Journal of Recent Research Aspects ISSN: 2349-7688, Vol. 5, Issue 1, March 2018, pp. 15-18 “ Tools Used in Data Analysis: A Comparative Study”
[16]Ken Kelly, Keke Lai and Po-Ju Wu, A Best Practice for Research “Using R For Data Analysis”
[17]Dr. Snezhana Sulova, Dr. Latinka Todoranova, Dr. Bonimir Penchev, Radka Nacheva, Bulgaria www.sgem.org “Using Text Mining to Classify Research Papers”
[18]D G Rossiter Version 1.4; May 6, 2017 “An example of statistical data analysis using the R environment for statistical computing”
[19] K. R. Srinath Telangana, India International Research Journal of Engineering and Technology (IRJET) e-ISSN: 2395-0056 Volume: 04 Issue: 12 | Dec-2017 www.irjet.net p-ISSN: 2395-0072 © 2017, IRJET | Impact Factor value: 6.171 Page 354 “Python – The Fastest Growing Programming Language”
[20] Shivangi Kaushal Jagpuneet Kaur Bajwa,Mohali India International Journal of Advanced Research in Computer Science and Software Engineering Volume 2, Issue 10, October 2012 ISSN: 2277 128X www.ijarcsse.com “Analytical Review of User Perceived Testing Techniques”